Data Driven Miscellaneous Measuring Graphics diagrams slides and templates
- Sub Categories
-
 0414 5 staged column chart design powerpoint graph
We are proud to present our 0414 5 staged column chart design powerpoint graph. Hit the ground running with our 5 Staged Column Chart Design PowerPoint Graph Powerpoint Templates. Go the full distance with ease and elan. Leave a lasting impression with our 5 Staged Column Chart Design PowerPoint Graph Powerpoint Templates. They possess an inherent longstanding recall factor.
-
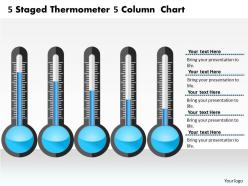 0414 5 staged thermometer 5 column chart powerpoint graph
We are proud to present our 0414 5 staged thermometer 5 column chart powerpoint graph. Hit the right notes with our 5 Staged Thermometer 5 Column Chart PowerPoint Graph Powerpoint Templates. Watch your audience start singing to your tune. Walk your team through your plans using our 5 Staged Thermometer 5 Column Chart PowerPoint Graph Powerpoint Templates. See their energy levels rise as you show them the way.
-
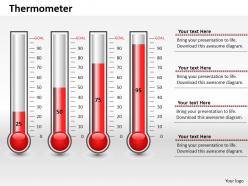 0414 business growth thermometer chart powerpoint graph
Thoroughly editable predesigned slides. Ease of inclusion and exclusion of content as per the need. Compatibility with number of online and offline software options. Compatibility with numerous format options. Impressive image quality. The visuals do not deter in quality when projected on wide screen. Freedom to personalize the content with company name and logo. Used by marketers, professionals of various departments, students and educators.
-
 0414 column chart in thermometer style powerpoint graph
PowerPoint infographic fully adaptable with Google slides. Adaptable to wide screen view without the problem of pixilation. Modifiable color, text and font as per the trade requirement. Easy to download and can be turned into JPG and PDF format. Accessibility of addition of logo and trademarks for personalization. Awesome use of colors and innovatively designed. Corresponding designs accessible with different nodes and stages.
-
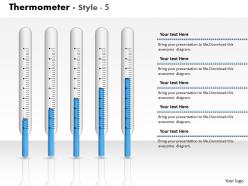 0414 column chart thermometer graph powerpoint graph
Impressive visuals of high quality. Good quality resolution. No issue of blurred images when projected on wide screen. Compatible with multiple number of online and offline software options. Ease of personalization and customization. Add the data and figures with ease. For assistance refer to the editing guidance provided in the presentation itself. Effectively downloaded and used by entrepreneurs, strategists, marketers, students and teachers.
-
 0414 cylinders column chart of percentage growth powerpoint graph
PPT example works perfectly with Google slides. Fluently download and variable into JPEG and PDF document. Smoothly editable PowerPoint clipart as color, text and font are editable. Alternate of insertion of trade representation and pictograph for personalization. Presentation slide template can be exhibited in both standard and widescreen view. Convenience to download identical designs with different nodes and stages. Perfect for business entrepreneurs, event management team, project management team, industry professionals etc.
-
 0414 design of thermometer column chart powerpoint graph
We are proud to present our 0414 design of thermometer column chart powerpoint graph. Our 0414 Design Of Thermometer Column Chart Powerpoint Graph Powerpoint Templates provide you the cutting edge. Slice through the doubts in the minds of your listeners. You aspire to touch the sky with glory. Let our 0414 Design Of Thermometer Column Chart Powerpoint Graph Powerpoint Templates provide the fuel for your ascent.
-
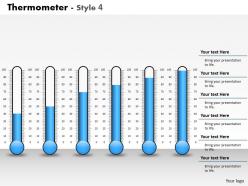 0414 display of thermometer column chart powerpoint graph
We are proud to present our 0414 display of thermometer column chart powerpoint graph. You are an avid believer in ethical practices. Highlight the benefits that accrue with our 0414 Display of Thermometer Column Chart Powerpoint Graph Powerpoint Templates. Set your controls for the heart of the sun. Our 0414 Display of Thermometer Column Chart Powerpoint Graph Powerpoint Templates will be the propellant to get you there.
-
 0414 graphics of thermometer column chart powerpoint graph
We are proud to present our 0414 graphics of thermometer column chart powerpoint graph. Stamp the authority of your intellect with our Graphics Of Thermometer Column Chart Powerpoint Graph Powerpoint Templates. Your superior ideas will hit the target always and everytime. Use our Graphics Of Thermometer Column Chart Powerpoint Graph Powerpoint Templates to embellish your thoughts. See them provide the desired motivation to your team.
-
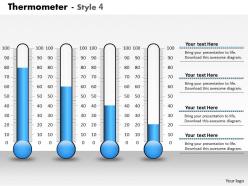 0414 increasing flow thermometer column chart powerpoint graph
We are proud to present our 0414 increasing flow thermometer column chart powerpoint graph. Our Increasing Flow Thermometer Column Chart Powerpoint Graph Powerpoint Templates are the layers of your gourmet cake. Provide the icing of your ideas and produce a masterpiece. Use our Increasing Flow Thermometer Column Chart Powerpoint Graph Powerpoint Templates and and feel the difference. Right off they generate a surge of interest.
-
 0414 inreasing profit ratio column chart powerpoint graph
We are proud to present our 0414 inreasing profit ratio column chart powerpoint graph. Let our Inreasing Profit Ratio Column Chart Powerpoint Graph Powerpoint Templates be the vehicle of your sucessful journey. Ride the bus to glory with your grand ideas. Our Inreasing Profit Ratio Column Chart Powerpoint Graph Powerpoint Templates are like a basic christmas tree. Decorate it with your beautiful thoughts and spread joy and happiness.
-
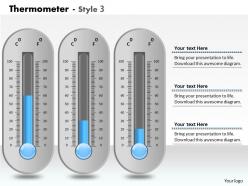 0414 layout of thermometer column chart powerpoint graph
We are proud to present our 0414 layout of thermometer column chart powerpoint graph. Our Layout of Thermometer Column Chart Powerpoint Graph Powerpoint Templates give you that extra zing. Add your views and make your audience sing. Our pretty Layout of Thermometer Column Chart Powerpoint Graph Powerpoint Templates are like snowflakes that fall. Gather them together and have a ball. Put your wondrously glowing ideas into them. Bind them together and create mayhem.
-
 0414 percentage cylinders column chart 2 stages powerpoint graph
We are proud to present our 0414 percentage cylinders column chart 2 stages powerpoint graph. Put your wonderful verbal artistry on display. Our Percentage Cylinders Column Chart 2 Stages Powerpoint Graph Powerpoint Templates will provide you the necessary glam and glitter. You have the co-ordinates for your destination of sucess. Let our Percentage Cylinders Column Chart 2 Stages Powerpoint Graph Powerpoint Templates map out your journey.
-
 0414 percentage data champagne bottle column chart powerpoint graph
Picture quality does not deter when opened on a big screen display. Trouble-free incorporation of customized content or graphics. Provided guidance to modify the graphical content. Save the presentation visual in JPG or PDF format. Compatible with the online as well as offline PowerPoint softwares. Effectively useful for the Marketing professionals, interpreters and the strategy designers.
-
 0414 percentage data thermomete column chart powerpoint graph
The PPT images offer compatibility with Google templates. High resolution icons for clear message delivery. An easy access to make the desired changes or edit it anyways. Wide screen view of the slides. Easy conversion into JPG or PDF format. Unique and informational content. Valuable for health and care professionals.
-
 0414 percentage growth column chart powerpoint graph
Presentation slide supports changing the color, size and orientation of any icon to your liking. It’s easy for the PPT design to run smoothly on any software. All images are 100% editable in the presentation visual. Best feature being the conversion of presentation slide show to PDF or JPG format. Can be used by businesses of all sizes. Offers high resolution without compromising on pixels quality in PPT layout when viewed on a larger screen. Compatible with Google slides.
-
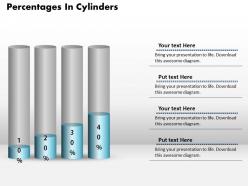 0414 percentage growth cylinders column chart powerpoint graph
We are proud to present our 0414 percentage growth cylinders column chart powerpoint graph. Bet on your luck with our Percentage Growth Cylinders Column Chart Powerpoint Graph Powerpoint Templates. Be assured that you will hit the jackpot. Let our Percentage Growth Cylinders Column Chart Powerpoint Graph Powerpoint Templates be the string of your bow. Fire of your ideas and conquer the podium.
-
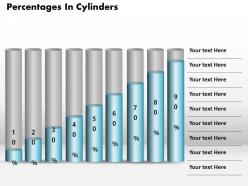 0414 percentage in cylinders 9 stages column chart powerpoint graph
We are proud to present our 0414 percentage in cylinders 9 stages column chart powerpoint graph. Tee off with our Percentage In Cylinders 9 Stages column chart Powerpoint Graph Powerpoint Templates. They will reward you with a hole in one. Launch your ideas with our Percentage In Cylinders 9 Stages column chart Powerpoint Graph Powerpoint Templates. Take your audience along on a magnificent flight.
-
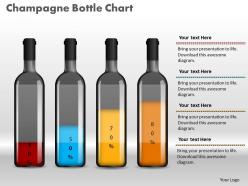 0414 percentage increase champagne bottle column chart powerpoint graph
Proofing and editing can be done with ease in PPT design. Smooth functioning is ensured by the presentation slide show on all software’s. Color, style and position can be standardized, supports font size which can be read from a distance. When projected on the wide screen the PPT layout does not sacrifice on pixels or color resolution.
-
 0414 percentage increase in battery column chart powerpoint graph
Useful for professionals working in corporates and college going students studying finance. Easily convertible into JPEG and PDF. High resolution graphics will not pixilate on bigger or wider screen. Customisable PPT layout in terms of orientation, design, color and text. Add titles and sub-titles as it has ample space. Compatible with Google slides and runs with all softwares. Company’s name, logo and trademark can be added conveniently. Easy to download due to small size.
-
 0414 progress thermometer column chart powerpoint graph
We are proud to present our 0414 progress thermometer column chart powerpoint graph. Our Progress Thermometer Column Chart Powerpoint Graph Power Point Templates Will Provide Weight To Your Words. They Will Bring Out The Depth Of Your Thought Process. Words Like Arrows Fly Straight And True. Use Our Progress Thermometer Column Chart Powerpoint Graph Power Point Templates To Make Them Hit Bulls eye Every time.
-
 0414 thermometer 4 staged column chart powerpoint graph
We are proud to present our 0414 thermometer 4 staged column chart powerpoint graph. Our Thermometer 4 Staged Column Chart Powerpoint Graph Powerpoint Templates are the layers of your gourmet cake. Provide the icing of your ideas and produce a masterpiece. Use our Thermometer 4 Staged Column Chart Powerpoint Graph Powerpoint Templates and and feel the difference. Right off they generate a surge of interest.
-
 0414 thermometer business design column chart powerpoint graph
We are proud to present our 0414 thermometer business design column chart powerpoint graph. Whatever the nuance you want to project. We have a Thermometer Business Design Column Chart Powerpoint Graph Powerpoint Templates that will get it across. Create a connection with your audience using our Thermometer Business Design Column Chart Powerpoint Graph Powerpoint Templates. Transfer your depth of knowledge clearly across to them.
-
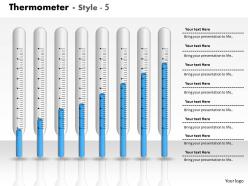 0414 thermometer business graph column chart powerpoint graph
We are proud to present our 0414 thermometer business graph column chart powerpoint graph. Let our Thermometer Business Graph Column Chart Powerpoint Graph Powerpoint Templates be the vehicle of your sucessful journey. Ride the bus to glory with your grand ideas. Our Thermometer Business Graph Column Chart Powerpoint Graph Powerpoint Templates are like a basic christmas tree. Decorate it with your beautiful thoughts and spread joy and happiness.
-
 0414 thermometer column chart business layout powerpoint graph
We are proud to present our 0414 thermometer column chart business layout powerpoint graph. Our Thermometer Column Chart Business Layout Powerpoint Graph Powerpoint Templates provide the links in your chain of thought. Once intertwined they enhance the strength of your words. Our Thermometer Column Chart Business Layout Powerpoint Graph Powerpoint Templates are like ingredients in your recipe of sucess. Stir them together and get people licking their lips.
-
 0414 thermometer column chart data illustration powerpoint graph
We are proud to present our 0414 thermometer column chart data illustration powerpoint graph. Our Thermometer Column Chart Data Illustration Powerpoint Graph Powerpoint Templates give you that extra zing. Add your views and make your audience sing. Our pretty Thermometer Column Chart Data Illustration Powerpoint Graph Powerpoint Templates are like snowflakes that fall. Gather them together and have a ball. Put your wondrously glowing ideas into them. Bind them together and create mayhem.
-
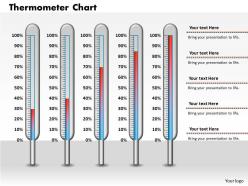 0414 thermometer column chart design powerpoint graph
Educate your team with the knowledge you have gained. Professionals can use this slide for health and column chart graph representation. All the colors used in the PPT slide is editable. Use this template in full screen for the best experience, get rid of the watermark and use it with google slides, just click download and follow the steps.
-
 0414 thermometer column chart for business growth powerpoint graph
We are proud to present our 0414 thermometer column chart for business growth powerpoint graph. Our Thermometer Column Chart For Business Growth Powerpoint Graph Powerpoint Templates are creatively constructed and eye catching. Focus attention on the key issues of your presentation. Use our Thermometer Column Chart For Business Growth Powerpoint Graph Powerpoint Templates and nail the day. Lead your team show them the way.
-
 0414 thermometer column chart for growth powerpoint graph
We are proud to present our 0414 thermometer column chart for growth powerpoint graph. Our Thermometer Column Chart For Growth Powerpoint Graph Powerpoint Templates are building a great reputation. Of being the driving force of a good presentation. Use our Thermometer Column Chart For Growth Powerpoint Graph Powerpoint Templates and surely win the game. As a presenter gain great name and fame.
-
 0414 thermometer column chart graphics powerpoint graph
All images are 100% editable in the presentation design. Presentation slide supports changing the color, size and orientation of any icon to your liking. PPT design supports the best graphic features; objects can be re arranged according to the requirement. Smooth animations, transitions and movement of objects across the slide. PPT slide is beneficial in business, academics, science, weather and science projections.
-
 0414 thermometer column chart layout powerpoint graph
We are proud to present our 0414 thermometer column chart layout powerpoint graph. Our Thermometer Column Chart Layout Powerpoint Graph Powerpoint Templates give good value for money. They also have respect for the value of your time. Take a leap off the starting blocks with our Thermometer Column Chart Layout Powerpoint Graph Powerpoint Templates. They will put you ahead of the competition in quick time.
-
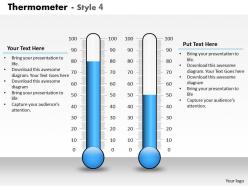 0414 thermometer column chart style graphics powerpoint graph
We are proud to present our 0414 thermometer column chart style graphics powerpoint graph. Put the wind in your sails with our Thermometer Column Chart Style Graphics Powerpoint Graph Powerpoint Templates. Skim smoothly over the choppy waters of the market. Let our Thermometer Column Chart Style Graphics Powerpoint Graph Powerpoint Templates give the updraft to your ideas. See them soar to great heights with ease.
-
 0414 thermometer column chart to compare data powerpoint graph
We are proud to present our 0414 thermometer column chart to compare data powerpoint graph. Timeline crunches are a fact of life. Meet all deadlines using our Thermometer Column Chart To Compare Data Powerpoint Graph Powerpoint Templates. Connect the dots using our Thermometer Column Chart To Compare Data Powerpoint Graph Powerpoint Templates. Fan expectations as the whole picture emerges.
-
 0414 thermometer column chart to display data powerpoint graph
We are proud to present our 0414 thermometer column chart to display data powerpoint graph. Let our Thermometer Column Chart To Display Data Powerpoint Graph Powerpoint Templates mark the footprints of your journey. Illustrate how they will lead you to your desired destination. Conjure up grand ideas with our magical Thermometer Column Chart To Display Data Powerpoint Graph Powerpoint Templates. Leave everyone awestruck by the end of your presentation.
-
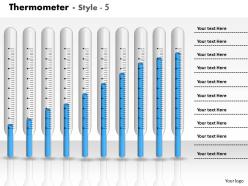 0414 thermometer column chart with 10 stages powerpoint graph
We are proud to present our 0414 thermometer column chart with 10 stages powerpoint graph. Bubbling and bursting with ideas are you. Let our Thermometer Column Chart With 10 Stages Powerpoint Graph Powerpoint Templates give them the shape for you. You have gained great respect for your brilliant ideas. Use our Thermometer Column Chart With 10 Stages Powerpoint Graph Powerpoint Templates to strengthen and enhance your reputation.
-
 0414 thermometer data driven column chart powerpoint graph
We are proud to present our 0414 thermometer data driven column chart powerpoint graph. Channelise the thoughts of your team with our Thermometer Data Driven Column Chart Powerpoint Graph Powerpoint Templates. Urge them to focus on the goals you have set. Give impetus to the hopes of your colleagues. Our Thermometer Data Driven Column Chart Powerpoint Graph Powerpoint Templates will aid you in winning their trust.
-
 0414 thermometer design column chart powerpoint graph
PPT slide supports resize, recolor and reverse the images. Good quality images can be used to compliment and reinforce message. Works well in Windows 7, 8, 10, XP, Vista and Citrix. Editing in presentation slide show can be done from anywhere by any device. PDF integrated features help to convert PPT to PDF. Supports to work offline and later upload the changes.
-
 0414 thermometer designed column chart powerpoint graph
PPT slide is compatible with Google slide. High resolution. PPT visual is useful to businessmen, academicians, for science, weather and science projections. Presentation slide show helps to insert links of stored files and can be used t create animated GIF if required. PPT graphic can be optimized and viewed in tablets, phone, widescreen monitors and projector screens.
-
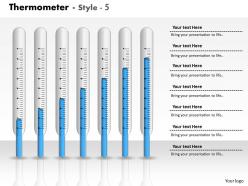 0414 thermometer graph column chart powerpoint graph
Can be viewed in 4: 3 standard screen size or 16:9 wide screen size. PPT design has many supporting actions like write, erase, correct, clean and select. Internet based click facilities like image search, oxford dictionary and others can be added with. ease and gives professional look to the PPT slide. Enables real time edition or collaboration with auto saving options.
-
 0414 thermometer layout column chart powerpoint graph
Beneficial for sales, marketing and productivity business by entrepreneurs. All images are 100% editable in the presentation slide. Presentation icon supports changing the color, size and orientation of any icon to your liking. Internet based click facilities like image search, oxford dictionary and others can be added with. ease and gives professional look to the PPT slide. Supports sharing and co-authoring of slide.
-
 0414 three thermometers column chart powerpoint graph
We are proud to present our 0414 three thermometers column chart powerpoint graph. Our Three Thermometers Column Chart Powerpoint Graph Powerpoint Templates provide you the cutting edge. Slice through the doubts in the minds of your listeners. You aspire to touch the sky with glory. Let our Three Thermometers Column Chart Powerpoint Graph Powerpoint Templates provide the fuel for your ascent.
-
 0514 3d graphic of dollar bag powerpoint slides
The PPT images offer compatibility with Google templates. High resolution icons for clear message delivery. An easy access to make the desired changes or edit it anyways. Wide screen view of the slides. Easy conversion into JPG or PDF format. Unique and informational content. Valuable for business professionals, sales representatives, marketing professionals and finance managers.
-
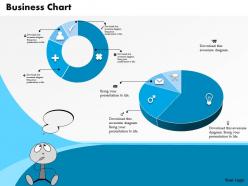 0514 business analysis growth data driven chart powerpoint slides
Businessmen, micro, small and medium enterprises can use the PPT visual as a master slide. PowerPoint presentation supports filling background in a different color from the text. All images are 100% editable in the presentation slide. Text can be differentiated form the background by the handy features provided by PPT layout. There is no space constrain in the PowerPoint design, thus enabling easy addition or edition of data. Offers high resolution is offered by PPT slide show.
-
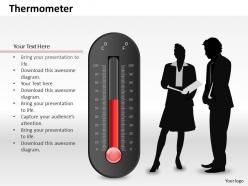 0514 data driven thermometer diagram powerpoint slides
We are proud to present our 0514 data driven thermometer diagram powerpoint slides. Unique design data driven thermometer is used in this Business Power Point template. To display various reading in any science related presentation use this graphic masterpiece and get noticed.
-
 0514 three business use thermometer graphic powerpoint slides
We are proud to present our 0514 three business use thermometer graphic powerpoint slides. Graphic of three business thermometer is used in this Business Power Point template. To display various reading in any science related presentation use this graphic masterpiece and get noticed.
-
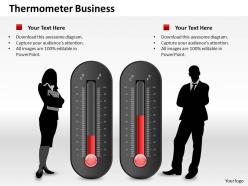 0514 two business use thermometer graphic powerpoint slides
We are proud to present our 0514 two business use thermometer graphic powerpoint slides. Graphic of two business use thermometer is used in this Business Power Point template. To display various reading in any science related presentation use this graphic masterpiece and get noticed.
-
 0514 unique design thermometer graphic powerpoint slides
We are proud to present our 0514 unique design thermometer graphic powerpoint slides. Unique design scientific thermometer is used in this Business Power Point template. To display various reading in any science related presentation use this graphic masterpiece and get noticed.
-
 0514 use good quality scientific thermometer powerpoint slides
We are proud to present our 0514 use good quality scientific thermometer powerpoint slides. Graphic of scientific thermometer is used in this Business Power Point template. To display various reading in any science related presentation use this graphic masterpiece and get noticed.
-
 1214 battery icon with power icons energy technology powerpoint slide
We are proud to present our 1214 battery icon with power icons energy technology powerpoint slide. Graphic of battery icons are used to craft this power point template. This PPT slide contains the concept of energy technology. Use this PPT slide and build an innovative presentation for your viewers.
-
 1214 battery with alert sign and dices power technology powerpoint slide
We are proud to present our 1214 battery with alert sign and dices power technology powerpoint slide. Graphic of battery with alert sign and dices are used to craft this power point template. This PPT contains the concept of energy conservation and power technology. Use this PPT for your energy and technology related presentations.
-
 1214 battery with empty sign for power generation powerpoint slide
We are proud to present our 1214 battery with empty sign for power generation powerpoint slide. This Power point template slide has been crafted with graphic of battery with empty sign. This PPT slide contains the concept of power generation. This PPT slide is usable for power related presentations.
-
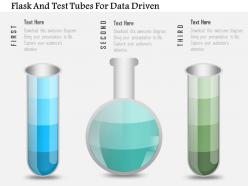 1214 flask and test tubes for data driven powerpoint slide
We are proud to present our 1214 flask and test tubes for data driven powerpoint slide. Graphic of flask and test tubes are used to craft this power point template slide. This PPT slide can be used for data driven measurement and analysis. Use this PPT slide for your science and math related presentation.
-
 1214 flask with data driven chart powerpoint slide
We are proud to present our 1214 flask with data driven chart powerpoint slide. This power point template slide has been designed with graphic of flask and data driven chart. This PPT slide contains the concept of data analysis for different measurement. Use this PPT and build quality presentation for your viewers.
-
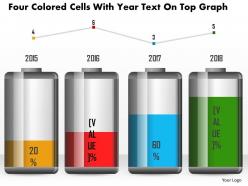 1214 four colored cells with year text on top graph powerpoint slide
We are proud to present our 1214 four colored cells with year text on top graph powerpoint slide. This Power Point template slide has been crafted with graphic of four colored cells and year text on top with graph. This PPT slide is usable for power technology and energy conservation related presentations.
-
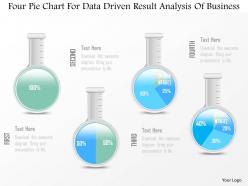 1214 four pie chart for data driven result analysis of business powerpoint slide
We are proud to present our 1214 four pie chart for data driven result analysis of business powerpoint slide. This Power Point template has been crafted with graphic of four pie charts. This PPT slide contains the concept of data driven result analysis. Use this PPT slide for your business and marketing related presentations.
-
 1214 green battery cell with full charging symbol powerpoint slide
We are proud to present our 1214 green battery cell with full charging symbol powerpoint slide. This power point template slide has been designed with graphic of green battery cell with full charging symbol. This PPT slide contains the concept of power technology and energy conservation. Use this PPT slide for your technology related presentations.
-
 1214 hour glass with 3d man and icons powerpoint slide
We are proud to present our 1214 hour glass with 3d man and icons powerpoint slide. Graphic of hour glass and 3d man with icons are used to craft this power point template slide. This PPT slide contains the concept of time management. Use this PPT slide for all your time related presentations.
-
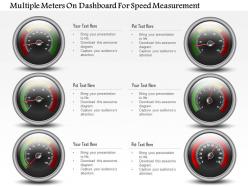 1214 Multiple Meters On Dashboard For Speed Measurement Powerpoint Slide
This template with speed meters is convenient to use. You can easily insert or remove any kind of figures or illustrations as per your requirements by simply following the instructions that have been given in the sample slides. The font size, font color and the font style that you use in the slides is 100% editable and can be changed easily as per your needs. You can get these slides in widescreen display with ratio of 16:9 by just a click. You can even upload these slides to Google Slides and they will work automatically. Also you can save the template in JPG or PDF format.
-
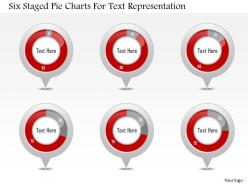 1214 six staged pie charts for text representation powerpoint slide
We are proud to present our 1214 six staged pie charts for text representation powerpoint slide. six staged pie charts are used to craft this power point template slide. This PPT slide contains the concept of process analysis. This analysis can be used for business and marketing related presentations.
-
 1214 three test tubes with magnifier for data search powerpoint slide
We are proud to present our 1214 three test tubes with magnifier for data search powerpoint slide. Three test tubes and magnifier are used to craft this power point template slide. This PPT slide contains the concept of data search. This PPT slide can be used for data related presentation.
-
Very unique, user-friendly presentation interface.
-
Easily Understandable slides.
-
Innovative and attractive designs.
-
The content is very helpful from business point of view.
-
Best way of representation of the topic.
-
Excellent work done on template design and graphics.
-
Awesomely designed templates, Easy to understand.
-
Great designs, really helpful.
-
Out of the box and creative design.
-
Great experience, I would definitely use your services further.


