- Sub Categories
-
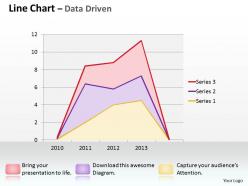 Data driven line chart shows revenue trends powerpoint slides
We are proud to present our data driven line chart shows revenue trends powerpoint slides. This PowerPoint diagram helps you chart the course of your presentation.This unique image makes your presentations professional and interactive. Deliver amazing presentations to mesmerize your audience.
-
 Data driven line chart to demonstrate data powerpoint slides
We are proud to present our data driven line chart to demonstrate data powerpoint slides. This line chart displays information as a series of data points connected by straight line segments.You can illustrate your ideas and imprint them in the minds of your team with this PPT diagram
-
 Data driven market analysis line chart powerpoint slides
We are proud to present our data driven market analysis line chart powerpoint slides. This Line chart is ideal for showing trends over time. A standard example would be how the stock value for a certain company develops over time. Impress upon audience with this PPT diagram
-
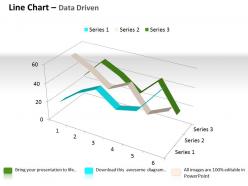 Data driven 3d line chart for comparison of data powerpoint slides
We are proud to present our data driven 3d line chart for comparison of data powerpoint slides. Our Data Driven 3D Line Chart For Comparison Of Data Powerpoint Slides Power Point Templates Are Building A Great Reputation. Of Being The Driving Force Of A Good Presentation. Use Our Data Driven 3D Line Chart For Comparison Of Data Powerpoint Slides Power Point Templates And Surely Win The Game. As A Presenter Gain Great Name And Fame.
-
 Data driven economic analysis line chart powerpoint slides
We are proud to present our data driven economic analysis line chart powerpoint slides. Set Pulses Racing With Our Data Driven Economic Analysis Line Chart Powerpoint Slides Power Point Templates. They Will Raise The Expectations Of Your Team. Our Data Driven Economic Analysis Line Chart Powerpoint Slides Power Point Templates Will Let Your Ideas Bloom. Create A Bed Of Roses For Your Audience.
-
 Data driven economic status line chart powerpoint slides
We are proud to present our data driven economic status line chart powerpoint slides. Kick Up A Storm With Our Data Driven Economic Status Line Chart Powerpoint Slides Power Point Templates. The Heads Of Your Listeners Will Swirl With Your Ideas. Ascend The Ladder Of Success With Ease. Our Data Driven Economic Status Line Chart Powerpoint Slides Power Point Templates Will Provide Strong And Sturdy Steps.
-
 Data driven line chart business graph powerpoint slides
We are proud to present our data driven line chart business graph powerpoint slides. Throw The Gauntlet With Our Data Driven Line Chart Business Graph Powerpoint Slides Power Point Templates. They Are Created To Take Up Any Challenge. Hit The Nail On The Head With Our Data Driven Line Chart Business Graph Powerpoint Slides Power Point Templates. Embed Your Ideas In The Minds Of Your Audience.
-
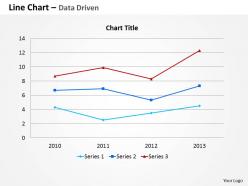 Data driven line chart for business information powerpoint slides
We are proud to present our data driven line chart for business information powerpoint slides. Our Data Driven Line Chart For Business Information Powerpoint Slides Power Point Templates Are Endowed To Endure. Ideas Conveyed Through Them Will Pass The Test Of Time. Bait Your Audience With Our Data Driven Line Chart For Business Information Powerpoint Slides Power Point Templates. They Will Bite The Hook Of Your Ideas In Large Numbers.
-
 Data driven line chart for business performance powerpoint slides
We are proud to present our data driven line chart for business performance powerpoint slides. Our Data Driven Line Chart For Business Performance Powerpoint Slides Power Point Templates Provide The Perfect Balance. Your Weighty Ideas Will Get The Ideal Impetus. You Can Safely Bank On Our Data Driven Line Chart For Business Performance Powerpoint Slides Power Point Templates. They Will Provide A Growth Factor To Your Valuable Thoughts.
-
 Data driven line chart for business trends powerpoint slides
We are proud to present our data driven line chart for business trends powerpoint slides. Hit A Home Run With Our Data Driven Line Chart For Business Trends Powerpoint Slides Power Point Templates. See Your Ideas Sail Into The Minds Of Your Audience. Score A Slam Dunk With Our Data Driven Line Chart For Business Trends Powerpoint Slides Power Point Templates. Watch Your Audience Hang Onto Your Every Word.
-
 Data driven line chart for market survey powerpoint slides
We are proud to present our data driven line chart for market survey powerpoint slides. Bask In The Warmth Of Our Data Driven Line Chart For Market Survey Powerpoint Slides Power Point Templates. Enjoy The Heartfelt Glowing Response Of Your Listeners. Rise To The Occasion With Our Data Driven Line Chart For Market Survey Powerpoint Slides Power Point Templates. You Will Bring Your Audience On Their Feet In No Time.
-
 Data driven line chart market graph powerpoint slides
We are proud to present our data driven line chart market graph powerpoint slides. You Have Belief Am Faith In Your Futuristic Plans. Chalk Them Out For Your Team With Our Data Driven Line Chart Market Graph Powerpoint Slides Power Point Templates. Use Our Bewitching Data Driven Line Chart Market Graph Powerpoint Slides Power Point Templates. They Will Delight Your Audience With The Magic Of Your Words.
-
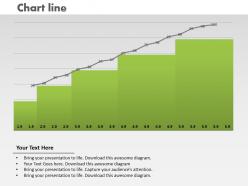 0414 column chart with growth line powerpoint graph
Multiple display option such as standard and widescreen view. Adjustable presentation background with remarkable pixel quality. Easy customization of presentation graphic and content. Proficiently transformable into numerous software options such as JPG or PDF. Provides a uniform approach to your PowerPoint illustration. Choice to insert company name, badge and label. Similar PPT designs accessible with different nodes and stages.
-
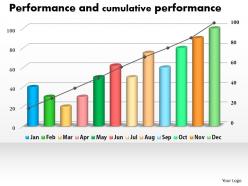 0414 column line chart for cumulative performance powerpoint graph
Incredible quality Presentation visual design with better display. Easy to include personalized content corporate logo or emblem. Contents of slide background are 100% editable to the extent. Multiple options like JPG and PDF for saving the presentation visual. PPT background downloadable with different nodes and stages. The PowerPoint illustration presentable in standard and widescreen view. Impeccable use of vectors which can be customized as per your requirement.
-
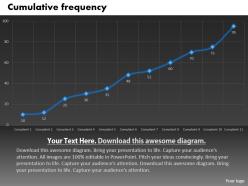 0414 cumulative frequency data line chart powerpoint graph
Presentation background can be amend easily as access to change color, text accessible. Astonishing PowerPoint visual accessible in standard and widescreen display. Far fetched picture quality as pixels don’t break. Merge well with online software tools i.e. JPG and PDF. Hundred percent compatible with Google slides. Pre-designed PPT infographic saves you valuable time. Modify the presentation slide with your company trademark, badge and design.
-
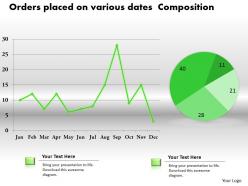 0414 data composition line pie chart powerpoint graph
Smoothly adaptable PowerPoint sample as changes accepted with color, text and shape. PPT guides are well-compatible with Google slides. Presentation clip art can be displayed in standard and widescreen view. Give peculiar touch to the presentation with business symbol, name and image. Alike designs downloadable with different nodes and stages. Effortless to download and change into other format such as JPEG and PDF.
-
 0414 dotted line business chart powerpoint graph
Presentable and easy to comprehend info graphic format. The presentation template can be downloaded and saved in any desired format. Privilege of insertion of logo and trademarks for more personalization. Adaptable to wide screen view without the problem of pixilation. Beneficial and productive insight for industry professionals, teachers, students, strategists and management planners.
-
 0414 line chart comparing stock performance powerpoint graph
We are proud to present our 0414 line chart comparing stock performance powerpoint graph. Our Line Chart Comparing Stock Performance Powerpoint Graph Powerpoint Templates are creatively constructed and eye catching. Focus attention on the key issues of your presentation. Use our Line Chart Comparing Stock Performance Powerpoint Graph Powerpoint Templates and nail the day. Lead your team show them the way.
-
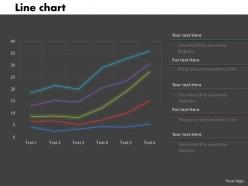 0414 line chart for data analysis powerpoint graph
We are proud to present our 0414 line chart for data analysis powerpoint graph. Our Line Chart For Data Analysis Powerpoint Graph Powerpoint Templates are building a great reputation. Of being the driving force of a good presentation. Use our Line Chart For Data Analysis Powerpoint Graph Powerpoint Templates and surely win the game. As a presenter gain great name and fame.
-
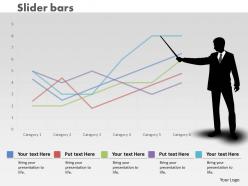 0414 man illustrating slider line chart powerpoint graph
We are proud to present our 0414 man illustrating slider line chart powerpoint graph. Our Man Illustrating Slider Line Chart Powerpoint Graph Powerpoint Templates give good value for money. They also have respect for the value of your time. Take a leap off the starting blocks with our Man Illustrating Slider Line Chart Powerpoint Graph Powerpoint Templates. They will put you ahead of the competition in quick time.
-
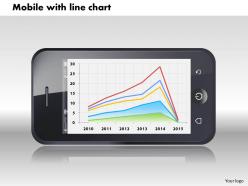 0414 mobile with line chart display powerpoint graph
Scrupulously collected PowerPoint slides having swift downloading procedure, Comfortably tractable into different arrangements like PDF or JPG, Quite Simple to add your titles or subtitles in the PPT templates, Restructure able subject matter, forms, source etc. of the PowerPoint images, Furnished well with all Google slides and other system program also, Lively Presentation graphic designs beneficial for business investors, business managers and management professionals and business analysts etc.
-
 0414 pareto analysis column chart with stylized markers powerpoint graph
High-resolution images and the slide icons. Allow saving in the multiple formats like JPG or PDF format. Easy to edit and customize the content or the slide icons. 100% access to edit the background, style and orientation of the slide icons once downloaded. Provided guidance to customize the background or the slide icons content. Beneficial for the business leaders, sales and marketing professionals.
-
 0414 pareto variation with column line chart powerpoint graph
Pixel-friendly images and graphics in the icons. No effect on picture quality when used on a wide screen display. Attune well with the major online and offline softwares. Allow instant customization of the slide icons and the graphics. Provided instructions to customize the content and the slide icons. 100% editable slide icons. Useful for the business entrepreneurs and the marketing individuals.
-
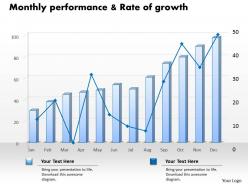 0414 rate of growth column line chart powerpoint graph
Beneficial for the business managers, marketing professionals and the strategy designers. Access to convert the presentation design into JPG and PDF. Offer 100% access to change the size and style of the slides once downloaded and saved in the desired format. High quality images and visuals used in the designing process. Choice to get presentation slide in standard or in widescreen view. Easy to convert in JPEG and PDF document. Compatible with Google slides.
-
 0414 sales and profit column line chart powerpoint graph
Fast and simple to download without unnecessary hassles. Thoroughly editable PowerPoint presentation. Modify the charts at your personal comfort and need. Download and save the presentation in desired format. Compatible with wide variety of online and offline software options. Available in both Standard and Widescreen slide sizes. Add this slide anywhere within your own slides for maximum impact.
-
 0414 sales volume column and line chart powerpoint graph
High resolution images do not pixelate when projected on wide screen. Personalize the PPT with your company name and logo. Modify the presentation elements as per the need of an hour. Compatible with numerous software and format options. Used by entrepreneurs, marketers, managerial department, stakeholders and students. Self-explanatory and intellectual slide charts. Access to edit the content, style, size and orientation of the PPT slides.
-
 0414 slider line chart marketing illustration powerpoint graph
We are proud to present our 0414 slider line chart marketing illustration powerpoint graph. Our Slider Line Chart Business Illustration Powerpoint Graph Powerpoint Templates are aesthetically designed to attract attention. We guarantee that they will grab all the eyeballs you need. Our Slider Line Chart Business Illustration Powerpoint Graph Powerpoint Templates are specially created by a professional team with vast experience. They diligently strive to come up with the right vehicle for your brilliant Ideas.
-
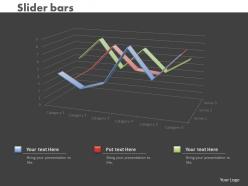 0414 slider line chart business illustration powerpoint graph
Easy data input like company logo, name or trademark. This PowerPoint icon is completely compatible with Google slides. Great for entrepreneurs, marketing and sales persons. Change PPT layout, font, text, color and blueprint as per your approach. Quick downloading speed and formats can be changed to JPEG and PDF. Quality of picture remain unaffected even when we resize the image.
-
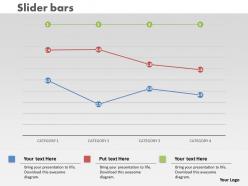 0414 slider line chart for communicating data powerpoint graph
We are proud to present our 0414 slider line chart for communicating data powerpoint graph. Activate the energies of your audience with our Slider Line Chart For Communicating Data Powerpoint Graph Powerpoint Templates. Get their creative juices flowing with your words. Enhance the stature of your presentation with our Slider Line Chart For Communicating Data Powerpoint Graph Powerpoint Templates. Adorn the beauty of your thoughts with their colourful backgrounds.
-
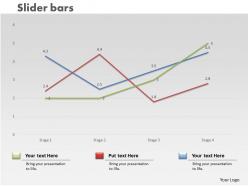 0414 slider line chart trend series powerpoint graph
We are proud to present our 0414 slider line chart trend series powerpoint graph. Our Slider Line Chart Trend Series Powerpoint Graph Powerpoint Templates provide the skeleton of your presentation. Flesh them out with your weighty ideas. Our Slider Line Chart Trend Series Powerpoint Graph Powerpoint Templates are the sinews of your lecture. Give them the muscle of your vibrant thoughts.
-
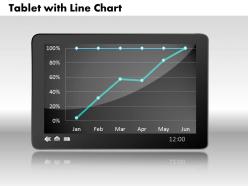 0414 tablate with line chart powerpoint graph
We are proud to present our 0414 tablate with line chart powerpoint graph. Our Tablate With Line Chart Powerpoint Graph Powerpoint Templates provide the pitch to bowl on. Mesmerise your audience with your guile. Our Tablate With Line Chart Powerpoint Graph Powerpoint Templates are stepping stones to success. Climb them steadily and reach the top.
-
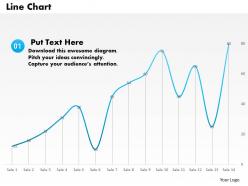 0514 3d linear growth for business powerpoint slides
Pixel-friendly images and graphics in the icons. No effect on picture quality when used on a wide screen display. Attune well with the major online and offline softwares. Allow instant customization of the slide icons and the graphics. Provided instructions to customize the content and the slide icons. 100% editable slide icons. Useful for the business entrepreneurs and the marketing individuals.
-
 0514 annual business data driven chart powerpoint slides
We are proud to present our 0514 annual business data driven chart powerpoint slides. An annual based data driven chart graphic is used in this business power point template. This professional template is well crafted for various business presentations.
-
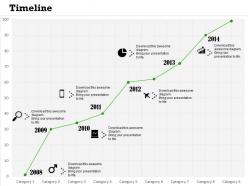 0514 business growth analysis time line diagram powerpoint slides
High resolution visuals. No fear of image pixilation when output is viewed on large screen. Ease of executing changes as it is thoroughly editable. Thoroughly editable slide design visual. Easy to customize and personalize the presentation with company specific name, logo and trademark. Thoroughly editable slide design model. Ease of addition and deletion of content, Guidance for marking changes has been provided in pictorial form.
-
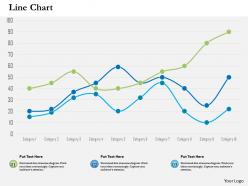 0514 data driven line chart diagram powerpoint slides
SlideTeam announces the 0514 data driven line chart diagram PowerPoint slides that help you in presenting the conclusion of a project. All these slides are fully compatible with Google slides. These slides can be edited at any time as and how you want. Our experts have been working on this slideshow since a long time and the result is going to be very fruitful for you. Now you can even view the presentation in 16:9 widescreen size instead of the old 4:3 standard screen size.
-
 0514 unique financial growth chart powerpoint slides
Runs jitter free and smoothly on all compatible software. PowerPoint images exhibit sharp resolution. When projected on widescreen, the Presentation graphics never pixelate. Hassle-free download of PPT slides. Further customize slide by appending your company’s logo, trademark. Add and employ titles and sub titles at will with no space constraints. Compatible with Google slides. Useful for strategic firms engaged in intense data analysis, technical startups, businesses, project management, educational colleges and universities teaching economics, management and statistics and many more.
-
 0514 unique pattern data driven line chart powerpoint slides
We are proud to present our 0514 unique pattern data driven line chart powerpoint slides. This Business Power Point template slide is designed with 3d graphic growth line chart. This template is crafted for financial growth display.
-
 0514 use line chart for business powerpoint slides
Slide runs quite smoothly on all software. Use slides in matter of moments. Insert company logo, name or trademark with no issues. Zero pixilation when slide is viewed on widescreen. Quite Compatible with google slides. Easily display titles and subtitles with no space constraints. High resolution PPT slides. Convert to JPG and PDF formats lucidly and rapidly. Useful for businesses, small and large, technical startups, project management and strategic organizations, educational institutes teaching courses on management, economics, statistics, computer science.
-
 1214 data driven bar graph and pie chart for analysis powerpoint slide
We are proud to present our 1214 data driven bar graph and pie chart for analysis powerpoint slide. This Power point template slide has been crafted with graphic of bar graph and pie chart . These graph and charts are data driven. Display any analysis with this exclusive PPT slide and build professional presentation.
-
 Data driven growth chart financial planning powerpoint slides
Basic theme yet it can modified with respect to font, color and layout. Attractive and professional color scheme. Presentation graphic offers font size which can be read from a distance. High resolution is offered by the presentation slide show. Easy to download and instant use of pre designed PPT layout adds to its advantage. High color resolution offered by PPT. Beneficial for businessmen, project managers for business and financial accounting purposes.
-
 Globe with bar graph data driven success indication powerpoint slides
We are proud to present our globe with bar graph data driven success indication powerpoint slides. Explain the global success indication with this power point template diagram. This PPT diagram contains the graphic of globe with bar graph. Use this PPT diagram for global marketing and business related presentations.
-
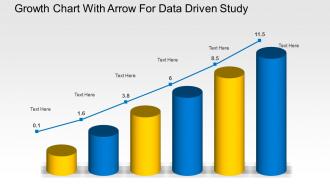 Growth chart with arrow for data driven study powerpoint slides
We are proud to present our growth chart with arrow for data driven study powerpoint slides. Graphic of growth chart with arrow has been used to design this power point template diagram. This PPT diagram contains the concept of data driven growth analysis. Use this PPT diagram for business and finance related presentations.
-
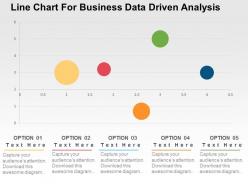 Line chart for business data driven analysis powerpoint slides
Visually stunning presentation infographics. Best quality of Presentation slide graphics. Picture quality don't pixelate when anticipated on wide screen. Effortlessly blend with other software’s such as JPG and PDF. Access to modify the content as color, text and layout can be edited. Adjust the substance at your simplicity. Presentation design compatible with Google slides. Alter the design with by inserting your company name and logo.
-
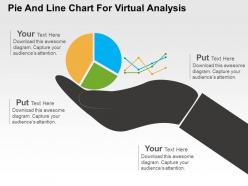 Pie and line chart for virtual analysis powerpoint slides
High resolution PPT example for pie and line chart for virtual analysis. Increase the level of personalization with your company logo and name. Compatible with all software and can be saved in any format. Useful tool for students, business analysts, sales people, sales managers and professionals of any industry. Precise and easy to comprehend information on PPT sample. Useful for marketing and business related presentations.
-
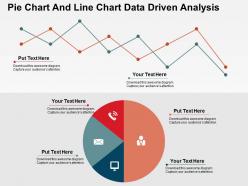 Pie chart and line chart data driven analysis powerpoint slides
PowerPoint Template for professionals for pie chart and line chart data driven analysis. Highly beneficial for professionals from diverse companies. Editable charts, colors and text. Adequate space available in each PowerPoint slide to insert text as desired. Manual option available to alter color or PowerPoint image. Simply click to add company logo, trademark or name.
-
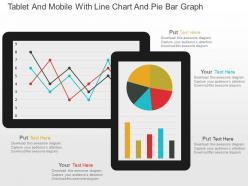 Tablet and mobile with line chart and pie bar graph powerpoint slides
Editable PPT Slide for viewing quarterly track record line chart. Compatible with numerous format options like JPEG, JPG or PDF. Access to inclusion and exclusion of contents as per specific needs of any business. Provides a professional outlook to your PowerPoint presentation. Beneficial for business professionals, students, teachers, business analysts and strategists. Customization of each PowerPoint graphic and text according to your desire and want.
-
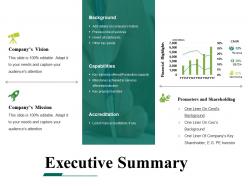 Executive summary powerpoint templates microsoft
Presenting executive summary powerpoint templates microsoft. This is a executive summary powerpoint templates microsoft. This is a four stage process. The stages in this process are accreditation, capabilities, background, promoters and shareholding.
-
 Our channel sales numbers powerpoint themes
Presenting our channel sales numbers powerpoint themes. This is a our channel sales numbers powerpoint themes. This is a four stage process. The stages in this process are growth, dashboard, measuring, management.
-
 Book value per share sample of ppt
Presenting book value per share sample of ppt. This is a book value per share sample of ppt. This is a one stage process. The stages in this process are gain, lost, total equity, total outstanding shares, book value per share.
-
 Market cap powerpoint slide themes
Presenting market cap powerpoint slide themes. This is a market cap powerpoint slide themes. This is a one stage process. The stages in this process are business, marketing, strategy, line chart, success.
-
 Financial highlights powerpoint slide presentation tips
Presenting financial highlights powerpoint slide presentation tips. This is a financial highlights powerpoint slide presentation tips. This is a four stage process. The stages in this process are sales, operating expenses, operating income, net income, profitability.
-
 Shareholders funds and market cap ppt sample download
Presenting shareholders funds and market cap ppt sample download. This is a shareholders funds and market cap ppt sample download. This is a five stage process. The stages in this process are shareholders funds, market capitalization, market capitalization as a percentage of cse market capitalization.
-
 Working capital overview ppt slides download
Presenting working capital overview ppt slides download. This is a working capital overview ppt slides download. This is a two stage process. The stages in this process are business, strategy, line chart, success, management.
-
 Financial statement powerpoint slide templates download
Presenting financial statement powerpoint slide templates download. This is a financial statement powerpoint slide templates download. This is a five stage process. The stages in this process are top 5 industries contribution, trends of sales cycle times, revenue trends, revenue growth, deal drop off by stage.
-
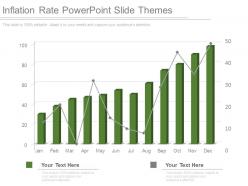 Inflation rate powerpoint slide themes
Presenting inflation rate powerpoint slide themes. This is a inflation rate powerpoint slide themes. This is a twelve stage process. The stages in this process are business, growth, strategy, management, success.
-
 Organic search traffic ppt background designs
Presenting organic search traffic ppt background designs. This is a organic search traffic ppt background designs. This is a one stage process. The stages in this process are google, yahoo, bing, ask com, aol.
-
 Web traffic insights ppt samples download
SlideTeam presents to you this beautifully designed web traffic insights PPT sample download. You can make a number of changes to the given prepared slides, as they are totally customizable. All you have to do is follow instructions given in the sample PPT. The slideshow can be viewed in standard size display ratio of 4:3 or widescreen display ratio of 16:9. The presentation is also compatible with Google Slides. The business template can be conveniently saved in format of PDF or JPG.
-
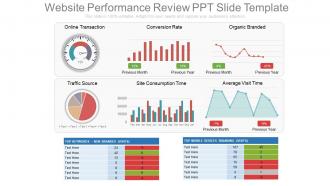 Website performance review ppt slide template
These are exclusively codified PPT design schemes which are quite suitable for online business managers, process experts etc. These PPT graphics can be acclimating with divergent software’s and Google slides. These are wonderfully conceived pictorial Presentation templates which can be customizable in to other file formats like PDF or JPG. They have an alterable designs, forms, colors, contents etc. These Website performance PPT design can also provide a space to add the title or subtitle as per your need.
-
 Money raised so far powerpoint shapes
Presenting money raised so far powerpoint shapes. This is a money raised so far powerpoint shapes. This is a nine stage process. The stages in this process are business, marketing, growth, rising, management.
-
 Money raised so far powerpoint slide deck
Presenting money raised so far powerpoint slide deck. This is a money raised so far powerpoint slide deck. This is a nine stage process. The stages in this process are business, marketing, growth, rising, management.
-
Unique design & color.
-
Best way of representation of the topic.
-
Awesome use of colors and designs in product templates.
-
Graphics are very appealing to eyes.
-
Attractive design and informative presentation.
-
Unique and attractive product design.
-
Awesome use of colors and designs in product templates.
-
Great quality product.
-
Great quality slides in rapid time.
-
Easy to edit slides with easy to understand instructions.


