0414 thermometer column chart design powerpoint graph
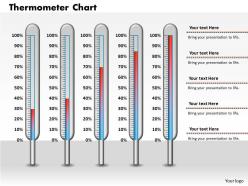
SlideTeam presents " 0414 Thermometer Column Chart Design Powerpoint Graph”, PowerPoint slides for your company’s growth representation related presentations, created with the theme of five thermometers standing tall and adjacent to each other and are having different temperature readings on them, as seen from left to right the red bar seems to go high. This PPT slide could be your unique way to represent growth chart of any business process. The motive of this PowerPoint slide is to lay down your agenda and expand your productivity and services by confronting you the current scenario of your company's health. Our design section stands unique here, having the thermometer as the bars displaying the growth and change is created keeping in mind that the visuals of the presentation must complement this subject. Just one step away is our “Thermometer Column Chart Design Powerpoint Graph" at your service for your company's growth representation of a business process, click the download button right away.Our 0414 Thermometer Column Chart Design Powerpoint Graph are extremely facilitating. They help you get on with your business.
You must be logged in to download this presentation.
 Impress your
 audience
Editable
of Time
PowerPoint presentation slides
Educate your team with the knowledge you have gained. Professionals can use this slide for health and column chart graph representation. All the colors used in the PPT slide is editable. Use this template in full screen for the best experience, get rid of the watermark and use it with google slides, just click download and follow the steps.
People who downloaded this PowerPoint presentation also viewed the following :
0414 thermometer column chart design powerpoint graph with all 3 slides:
Display continued determination with our 0414 Thermometer Column Chart Design Powerpoint Graph. You will never appear half hearted.
-
Easily Editable.
-
Helpful product design for delivering presentation.


