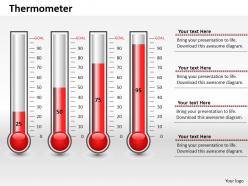
0414 business growth thermometer chart powerpoint graph
What else can be a better way of expressing the growth of business over a period of time than 0414 business growth thermometer chart PowerPoint graph? The provided thermometer growth meter PPT PowerPoint template can be used to decipher some insight on the statistical figures which might be in percentages. Use the given thermometer chart to talk about the progress of the strategies which are directed towards the goals and targets set beforehand. In fact it is a very impressive tool to track the performance whether it is going up or down or remaining constant. With so much of precision and clarity in the measuring tool, it is very easy to take relative corrective measures if any required. The growth of a business is guided by multiple parameters. You may use one thermometer PPT image for one of the individual parameters, so that you get a clear understanding of where is the shortfall happening. Our 0414 Business Growth Thermometer Chart Powerpoint Graph help avoid future errors. They dig out half truths early.
You must be logged in to download this presentation.
 Impress your
 audience
Editable
of Time
PowerPoint presentation slides
Thoroughly editable predesigned slides. Ease of inclusion and exclusion of content as per the need. Compatibility with number of online and offline software options. Compatibility with numerous format options. Impressive image quality. The visuals do not deter in quality when projected on wide screen. Freedom to personalize the content with company name and logo. Used by marketers, professionals of various departments, students and educators.
People who downloaded this PowerPoint presentation also viewed the following :
0414 business growth thermometer chart powerpoint graph with all 3 slides:
Nothing can come between you and success. Our 0414 Business Growth Thermometer Chart Powerpoint Graph will make sure of that.
-
Excellent work done on template design and graphics.
-
Best way of representation of the topic.


