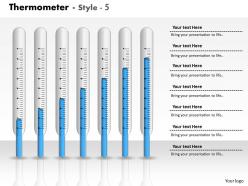
0414 thermometer graph column chart powerpoint graph
An ideal platform or vehicle to drive your growth figures or put across your ideas in a presentable and professional manner 0414 Thermometer Graph Column Chart PowerPoint Graph is the best one. The PPT graphic helps to penetrate the ideas in a graphical manner, illustrate the hotness and coldness of place or offer figures of sales or marketing in a visual manner. To work on the skills or enhance the knowledge of your team members so that they don’t give up easily and stay motivated, this type of PPT layout is a must which is not only handy to use but also supports to have proper organization, development, management and analysis of any project which is in progress or is supposed to be taken up. The PPT icon supports the use of extensive drawing tools to bring in minor and major editions. The presentation graphic helps increase the efficiency of your business by visually illustrating the flow of material, growth and information labeling prospects.Generate great chemistry with our 0414 Thermometer Graph Column Chart Powerpoint Graph. They act as an excellent catalyst.
You must be logged in to download this presentation.
 Impress your
 audience
Editable
of Time
PowerPoint presentation slides
Can be viewed in 4: 3 standard screen size or 16:9 wide screen size. PPT design has many supporting actions like write, erase, correct, clean and select. Internet based click facilities like image search, oxford dictionary and others can be added with. ease and gives professional look to the PPT slide. Enables real time edition or collaboration with auto saving options.
People who downloaded this PowerPoint presentation also viewed the following :
0414 thermometer graph column chart powerpoint graph with all 3 slides:
Our 0414 Thermometer Graph Column Chart Powerpoint Graph are designed to be client centric. They are programmed to meet every need.
-
Qualitative and comprehensive slides.
-
Great product with highly impressive and engaging designs.


