Powerpoint Templates and Google slides for Average Time
Save Your Time and attract your audience with our fully editable PPT Templates and Slides.
-
 Average Handling Time Powerpoint Ppt Template Bundles
Deliver a credible and compelling presentation by deploying this Average Handling Time Powerpoint Ppt Template Bundles. Intensify your message with the right graphics, images, icons, etc. presented in this complete deck. This PPT template is a great starting point to convey your messages and build a good collaboration. The twelve slides added to this PowerPoint slideshow helps you present a thorough explanation of the topic. You can use it to study and present various kinds of information in the form of stats, figures, data charts, and many more. This Average Handling Time Powerpoint Ppt Template Bundles PPT slideshow is available for use in standard and widescreen aspects ratios. So, you can use it as per your convenience. Apart from this, it can be downloaded in PNG, JPG, and PDF formats, all completely editable and modifiable. The most profound feature of this PPT design is that it is fully compatible with Google Slides making it suitable for every industry and business domain.
-
 Incident process average time database developer planning
If you require a professional template with great design, then this Incident Process Average Time Database Developer Planning is an ideal fit for you. Deploy it to enthrall your audience and increase your presentation threshold with the right graphics, images, and structure. Portray your ideas and vision using twelve slides included in this complete deck. This template is suitable for expert discussion meetings presenting your views on the topic. With a variety of slides having the same thematic representation, this template can be regarded as a complete package. It employs some of the best design practices, so everything is well-structured. Not only this, it responds to all your needs and requirements by quickly adapting itself to the changes you make. This PPT slideshow is available for immediate download in PNG, JPG, and PDF formats, further enhancing its usability. Grab it by clicking the download button.
-
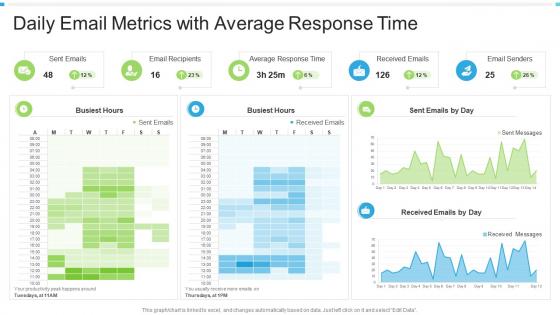 Daily email metrics with average response time
Introducing our Daily Email Metrics With Average Response Time set of slides. The topics discussed in these slides are Email Recipients, Average Response Time, Received Emails. This is an immediately available PowerPoint presentation that can be conveniently customized. Download it and convince your audience.
-
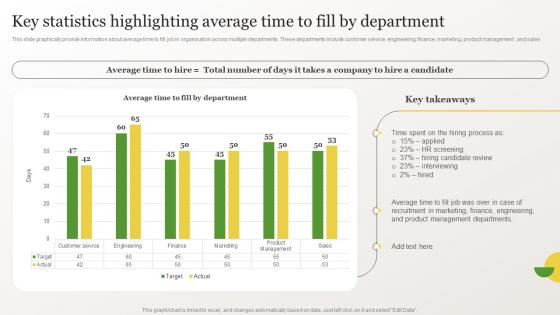 Identifying Gaps In Workplace Key Statistics Highlighting Average Time To Fill By Department
This slide graphically provide information about average time to fill job in organisation across multiple departments.These departments include customer service, engineering, finance, marketing, product management , and sales. Present the topic in a bit more detail with this Identifying Gaps In Workplace Key Statistics Highlighting Average Time To Fill By Department Use it as a tool for discussion and navigation on Hiring Candidate Review, Management Departments This template is free to edit as deemed fit for your organization. Therefore download it now.
-
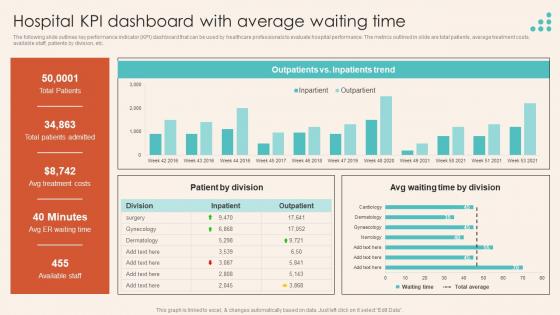 Hospital KPI Dashboard With Average Waiting Time Introduction To Healthcare Marketing Strategy SS V
The following slide outlines key performance indicator KPI dashboard that can be used by healthcare professionals to evaluate hospital performance. The metrics outlined in slide are total patients, average treatment costs, available staff, patients by division, etc. Present the topic in a bit more detail with this Hospital KPI Dashboard With Average Waiting Time Introduction To Healthcare Marketing Strategy SS V. Use it as a tool for discussion and navigation on Patient By Division. This template is free to edit as deemed fit for your organization. Therefore download it now.
-
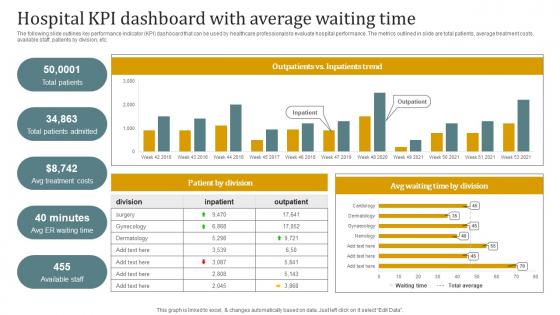 Hospital KPI Dashboard With Average Waiting Time Promotional Plan Strategy SS V
The following slide outlines key performance indicator KPI dashboard that can be used by healthcare professionals to evaluate hospital performance. The metrics outlined in slide are total patients, average treatment costs, available staff, patients by division, etc. Present the topic in a bit more detail with this Hospital KPI Dashboard With Average Waiting Time Promotional Plan Strategy SS V Use it as a tool for discussion and navigation on Outpatients, Inpatients Trend, Patient By Division This template is free to edit as deemed fit for your organization. Therefore download it now.
-
 Healthcare Marketing Hospital Kpi Dashboard With Average Waiting Time Strategy SS V
The following slide outlines key performance indicator KPI dashboard that can be used by healthcare professionals to evaluate hospital performance. The metrics outlined in slide are total patients, average treatment costs, available staff, patients by division, etc. Deliver an outstanding presentation on the topic using this Healthcare Marketing Hospital Kpi Dashboard With Average Waiting Time Strategy SS V Dispense information and present a thorough explanation of Patient By Division, Waiting Time By Division, Inpatients Trend using the slides given. This template can be altered and personalized to fit your needs. It is also available for immediate download. So grab it now.
-
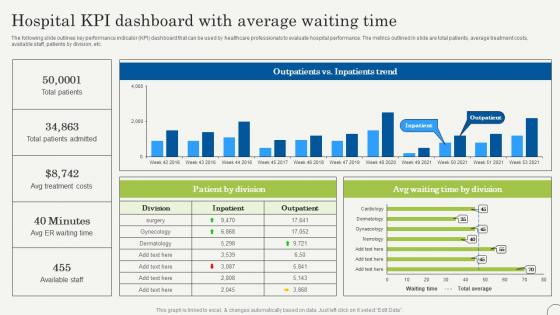 Hospital KPI Dashboard With Average Waiting Time Strategic Plan To Promote Strategy SS V
The following slide outlines key performance indicator KPI dashboard that can be used by healthcare professionals to evaluate hospital performance. The metrics outlined in slide are total patients, average treatment costs, available staff, patients by division, etc. Deliver an outstanding presentation on the topic using this Hospital KPI Dashboard With Average Waiting Time Strategic Plan To Promote Strategy SS V. Dispense information and present a thorough explanation of Treatment, Waiting, Available using the slides given. This template can be altered and personalized to fit your needs. It is also available for immediate download. So grab it now.
-
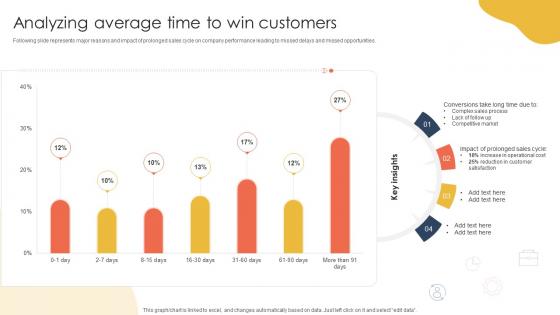 Analyzing Average Time How To Keep Leads Flowing Sales Funnel Management SA SS
Following slide represents major reasons and impact of prolonged sales cycle on company performance leading to missed delays and missed opportunities. Deliver an outstanding presentation on the topic using this Analyzing Average Time How To Keep Leads Flowing Sales Funnel Management SA SS. Dispense information and present a thorough explanation of Competitive Market, Customer Satisfaction, Prolonged Sales using the slides given. This template can be altered and personalized to fit your needs. It is also available for immediate download. So grab it now.
-
 Identifying Gaps In Workplace Impact Of High Average Time To Fill
This slide exhibits the impact of a high average time to hire due to the lengthy recruitment procedure.These include increase in cost per hire, unsatisfactory candidate experience, employee productivity decreases, and loss of top candidates. Introducing Identifying Gaps In Workplace Impact Of High Average Time To Fill to increase your presentation threshold. Encompassed with Four stages, this template is a great option to educate and entice your audience. Dispence information onIncrease In Cost Per Hire, Unsatisfactory Candidate Experience, using this template. Grab it now to reap its full benefits.
-
 Average Abandoned Time In Powerpoint And Google Slides Cpb
Presenting Average Abandoned Time In Powerpoint And Google Slides Cpb slide which is completely adaptable. The graphics in this PowerPoint slide showcase three stages that will help you succinctly convey the information. In addition, you can alternate the color, font size, font type, and shapes of this PPT layout according to your content. This PPT presentation can be accessed with Google Slides and is available in both standard screen and widescreen aspect ratios. It is also a useful set to elucidate topics like Average Abandoned Time. This well structured design can be downloaded in different formats like PDF, JPG, and PNG. So, without any delay, click on the download button now.
-
 Over Time Average Rate Return Stocks In Powerpoint And Google Slides Cpb
Presenting our Over Time Average Rate Return Stocks In Powerpoint And Google Slides Cpb PowerPoint template design. This PowerPoint slide showcases four stages. It is useful to share insightful information on Over Time Average Rate Return Stocks. This PPT slide can be easily accessed in standard screen and widescreen aspect ratios. It is also available in various formats like PDF, PNG, and JPG. Not only this, the PowerPoint slideshow is completely editable and you can effortlessly modify the font size, font type, and shapes according to your wish. Our PPT layout is compatible with Google Slides as well, so download and edit it as per your knowledge.
-
 Average Time Tax Refund In Powerpoint And Google Slides Cpb
Presenting our Average Time Tax Refund In Powerpoint And Google Slides Cpb PowerPoint template design. This PowerPoint slide showcases four stages. It is useful to share insightful information on Average Time Tax Refund This PPT slide can be easily accessed in standard screen and widescreen aspect ratios. It is also available in various formats like PDF, PNG, and JPG. Not only this, the PowerPoint slideshow is completely editable and you can effortlessly modify the font size, font type, and shapes according to your wish. Our PPT layout is compatible with Google Slides as well, so download and edit it as per your knowledge.
-
 Average Student Loan Repayment Time In Powerpoint And Google Slides Cpb
Presenting our Average Student Loan Repayment Time In Powerpoint And Google Slides Cpb PowerPoint template design. This PowerPoint slide showcases three stages. It is useful to share insightful information on Average Student Loan Repayment Time. This PPT slide can be easily accessed in standard screen and widescreen aspect ratios. It is also available in various formats like PDF, PNG, and JPG. Not only this, the PowerPoint slideshow is completely editable and you can effortlessly modify the font size, font type, and shapes according to your wish. Our PPT layout is compatible with Google Slides as well, so download and edit it as per your knowledge.
-
 Miles Average Time In Powerpoint And Google Slides Cpb
Presenting our Miles Average Time In Powerpoint And Google Slides Cpb PowerPoint template design. This PowerPoint slide showcases four stages. It is useful to share insightful information on Miles Average Time. This PPT slide can be easily accessed in standard screen and widescreen aspect ratios. It is also available in various formats like PDF, PNG, and JPG. Not only this, the PowerPoint slideshow is completely editable and you can effortlessly modify the font size, font type, and shapes according to your wish. Our PPT layout is compatible with Google Slides as well, so download and edit it as per your knowledge.
-
 Average Human Height Over Time In Powerpoint And Google Slides Cpb
Presenting our Average Human Height Over Time In Powerpoint And Google Slides Cpb PowerPoint template design. This PowerPoint slide showcases three stages. It is useful to share insightful information on Average Human Height Over Time This PPT slide can be easily accessed in standard screen and widescreen aspect ratios. It is also available in various formats like PDF, PNG, and JPG. Not only this, the PowerPoint slideshow is completely editable and you can effortlessly modify the font size, font type, and shapes according to your wish. Our PPT layout is compatible with Google Slides as well, so download and edit it as per your knowledge.
-
 Average Run Time Age In Powerpoint And Google Slides Cpb
Presenting our Average Run Time Age In Powerpoint And Google Slides Cpb PowerPoint template design. This PowerPoint slide showcases three stages. It is useful to share insightful information on Average Run Time Age This PPT slide can be easily accessed in standard screen and widescreen aspect ratios. It is also available in various formats like PDF, PNG, and JPG. Not only this, the PowerPoint slideshow is completely editable and you can effortlessly modify the font size, font type, and shapes according to your wish. Our PPT layout is compatible with Google Slides as well, so download and edit it as per your knowledge.
-
 Average Time Recessions In Powerpoint And Google Slides Cpb
Presenting our Average Time Recessions In Powerpoint And Google Slides Cpb PowerPoint template design. This PowerPoint slide showcases six stages. It is useful to share insightful information on Average Time Recessions This PPT slide can be easily accessed in standard screen and widescreen aspect ratios. It is also available in various formats like PDF, PNG, and JPG. Not only this, the PowerPoint slideshow is completely editable and you can effortlessly modify the font size, font type, and shapes according to your wish. Our PPT layout is compatible with Google Slides as well, so download and edit it as per your knowledge.
-
 Average Development Time For Music Streaming App
This slide highlights average development time consumed by music streaming app. It includes various elements such as authentication, music streaming, search, sharing music, playlists and offline mode.Presenting our set of slides with Average Development Time For Music Streaming App. This exhibits information on six stages of the process. This is an easy to edit and innovatively designed PowerPoint template. So download immediately and highlight information on Authentification, Structured Assessable, Customized Playlists.
-
 Average Mortgage Rates Over Time In Powerpoint And Google Slides Cpb
Presenting our Average Mortgage Rates Over Time In Powerpoint And Google Slides Cpb PowerPoint template design. This PowerPoint slide showcases four stages. It is useful to share insightful information on Average Mortgage Rates Over Time This PPT slide can be easily accessed in standard screen and widescreen aspect ratios. It is also available in various formats like PDF, PNG, and JPG. Not only this, the PowerPoint slideshow is completely editable and you can effortlessly modify the font size, font type, and shapes according to your wish. Our PPT layout is compatible with Google Slides as well, so download and edit it as per your knowledge.
-
 Average Mile Time Age In Powerpoint And Google Slides Cpb
Presenting our Average Mile Time Age In Powerpoint And Google Slides Cpb PowerPoint template design. This PowerPoint slide showcases two stages. It is useful to share insightful information on Average Mile Time Age This PPT slide can be easily accessed in standard screen and widescreen aspect ratios. It is also available in various formats like PDF, PNG, and JPG. Not only this, the PowerPoint slideshow is completely editable and you can effortlessly modify the font size, font type, and shapes according to your wish. Our PPT layout is compatible with Google Slides as well, so download and edit it as per your knowledge.
-
 Industrial Average Real Time In Powerpoint And Google Slides Cpb
Presenting Industrial Average Real Time In Powerpoint And Google Slides Cpb slide which is completely adaptable. The graphics in this PowerPoint slide showcase three stages that will help you succinctly convey the information. In addition, you can alternate the color, font size, font type, and shapes of this PPT layout according to your content. This PPT presentation can be accessed with Google Slides and is available in both standard screen and widescreen aspect ratios. It is also a useful set to elucidate topics like Industrial Average Real Time. This well structured design can be downloaded in different formats like PDF, JPG, and PNG. So, without any delay, click on the download button now.
-
 Average Marathon Time Age In Powerpoint And Google Slides Cpb
Presenting our Average Marathon Time Age In Powerpoint And Google Slides Cpb PowerPoint template design. This PowerPoint slide showcases six stages. It is useful to share insightful information on Average Marathon Time Age This PPT slide can be easily accessed in standard screen and widescreen aspect ratios. It is also available in various formats like PDF, PNG, and JPG. Not only this, the PowerPoint slideshow is completely editable and you can effortlessly modify the font size, font type, and shapes according to your wish. Our PPT layout is compatible with Google Slides as well, so download and edit it as per your knowledge.
-
 Average Reaction Time In Powerpoint And Google Slides Cpp
Presenting Average Reaction Time In Powerpoint And Google Slides Cpp slide which is completely adaptable. The graphics in this PowerPoint slide showcase four stages that will help you succinctly convey the information. In addition, you can alternate the color, font size, font type, and shapes of this PPT layout according to your content. This PPT presentation can be accessed with Google Slides and is available in both standard screen and widescreen aspect ratios. It is also a useful set to elucidate topics like Average Reaction Time. This well-structured design can be downloaded in different formats like PDF, JPG, and PNG. So, without any delay, click on the download button now.
-
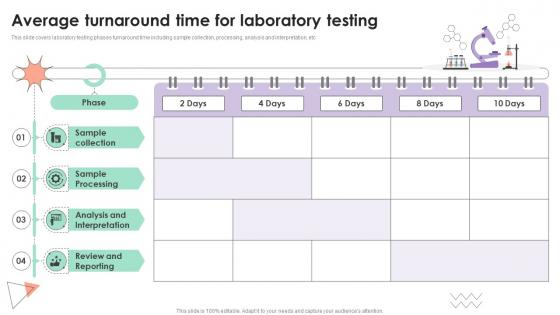 Average Turnaround Time For Laboratory Testing
This slide covers laboratory testing phases turnaround time including sample collection, processing, analysis and interpretation, etc Introducing our Average Turnaround Time For Laboratory Testing set of slides. The topics discussed in these slides are Sample Collection, Sample Processing, Analysis And Interpretation. This is an immediately available PowerPoint presentation that can be conveniently customized. Download it and convince your audience.
-
 Follow Up Patients Average Turnaround Time
This slide showcases follow-up patients in hospital including patient number, reporting time, exit time, and turnaround time. Presenting our well structured Follow Up Patients Average Turnaround Time. The topics discussed in this slide are Turnaround Time, Dissatisfaction, Attentiveness. This is an instantly available PowerPoint presentation that can be edited conveniently. Download it right away and captivate your audience.
-
 Sales Forecasting Models And Methods Moving Average Model For Time Series Forecasting SA SS
Purpose of this slide is to implement moving average forecasting model that helps to determine sales trends and patterns for effective predictions. Introducing Sales Forecasting Models And Methods Moving Average Model For Time Series Forecasting SA SS to increase your presentation threshold. Encompassed with three stages, this template is a great option to educate and entice your audience. Dispence information on Time Series Forecasting, Effective Predictions, Sales Trends And Patterns, using this template. Grab it now to reap its full benefits.
-
 Average Response Time Results After Training Types Of Customer Service Training Programs
This slide carries a comparison between average response time per source in pre and post-training periods. Various sources included are phone, email, portal, Facebook and other sources Introducing Average Response Time Results After Training Types Of Customer Service Training Programs to increase your presentation threshold. Encompassed with one stages, this template is a great option to educate and entice your audience. Dispence information on Comparison, Sources, Training Period, using this template. Grab it now to reap its full benefits.
-
 Average Hiring Time To Fill The Position Overview Of Recruitment Training Strategies And Methods
This slide provides the graph of average hiring time that shows decline in hiring timings after implementing the recruitment training program Deliver an outstanding presentation on the topic using this Average Hiring Time To Fill The Position Overview Of Recruitment Training Strategies And Methods Dispense information and present a thorough explanation of Average Hiring Time To Fill The Position using the slides given. This template can be altered and personalized to fit your needs. It is also available for immediate download. So grab it now.
-
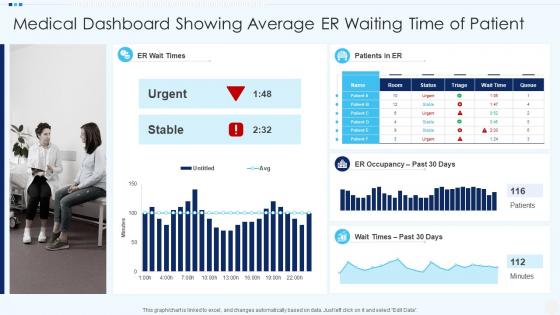 Medical Dashboard Showing Average ER Waiting Time Of Patient
Introducing our Medical Dashboard Showing Average ER Waiting Time Of Patient set of slides. The topics discussed in these slides are Medical Dashboard Showing Average ER Waiting Time Of Patient. This is an immediately available PowerPoint presentation that can be conveniently customized. Download it and convince your audience.
-
 Average Hiring Time To Fill The Position Recruitment Training Plan For Employee And Managers
This slide provides the graph of average hiring time that shows decline in hiring timings after implementing the recruitment training program Deliver an outstanding presentation on the topic using this Average Hiring Time To Fill The Position Recruitment Training Plan For Employee And Managers Dispense information and present a thorough explanation of Implementing The Recruitment, Average Hiring Time, Implementing The Program using the slides given. This template can be altered and personalized to fit your needs. It is also available for immediate download. So grab it now.
-
 Qa enabled business transformation average product delivery time in absence
This slide shows details about the increasing Final Product Delivery Time in the past 5 years. The average delivery time is constantly increasing due to absence of advanced software testing techniques leading to increased bug rate in the product. Hence, leading to increased time in delivering the final product.Present the topic in a bit more detail with this QA Enabled Business Transformation Average Product Delivery Time In Absence. Use it as a tool for discussion and navigation on Leading To Increased, Testing Techniques Leading, Advanced Software. This template is free to edit as deemed fit for your organization. Therefore download it now.
-
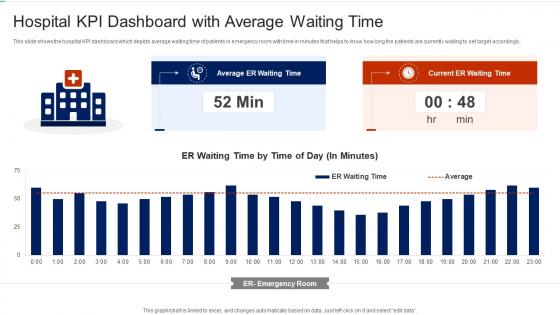 Hospital KPI Dashboard With Average Waiting Time
This slide shows the hospital KPI dashboard which depicts average waiting time of patients in emergency room with time in minutes that helps to know how long the patients are currently waiting to set target accordingly. Presenting our well structured Hospital KPI Dashboard With Average Waiting Time. The topics discussed in this slide are Average ER Waiting Time, Current ER Waiting Time, ER Emergency Room. This is an instantly available PowerPoint presentation that can be edited conveniently. Download it right away and captivate your audience.
-
 Recruitment training to improve selection process average hiring time to fill the position
This slide provides the graph of average hiring time that shows decline in hiring timings after implementing the recruitment training program Present the topic in a bit more detail with this Recruitment Training To Improve Selection Process Average Hiring Time To Fill The Position. Use it as a tool for discussion and navigation on Average Hiring Time To Fill The Position. This template is free to edit as deemed fit for your organization. Therefore download it now.
-
 Average Hiring Time To Fill The Position Hiring Training To Enhance Skills And Working Capability
This slide provides the graph of average hiring cost that shows decline in hiring costs after implementing the recruitment training program Present the topic in a bit more detail with this Average Hiring Time To Fill The Position Hiring Training To Enhance Skills And Working Capability. Use it as a tool for discussion and navigation on Implementing, Recruitment, Position. This template is free to edit as deemed fit for your organization. Therefore download it now.
-
 Analysis Of Average Wait Time At Retail Store Retail Store Operations Performance Assessment
The slide visually provides information regarding the average time customer spent at the checkout counter of retail store. It also provides details regarding waiting timings of competitors. Present the topic in a bit more detail with this Analysis Of Average Wait Time At Retail Store Retail Store Operations Performance Assessment. Use it as a tool for discussion and navigation on Analysis, Information, Competitors. This template is free to edit as deemed fit for your organization. Therefore download it now.
-
 Customer Service Dashboard Average Time To Solve Issue
Introducing our Customer Service Dashboard Average Time To Solve Issue set of slides. The topics discussed in these slides are Customer Satisfaction, Cost Per Support, Revenue. This is an immediately available PowerPoint presentation that can be conveniently customized. Download it and convince your audience.
-
 Customer Service Dashboard With Average Talk Time Distribution
Introducing our Customer Service Dashboard With Average Talk Time Distribution set of slides. The topics discussed in these slides are Occupancy, External Incoming Call, Break Time. This is an immediately available PowerPoint presentation that can be conveniently customized. Download it and convince your audience.
-
 Hiring Process Monitoring Dashboard With Average Recruitment Time
This slide showcases dashboard for hiring process monthly monitoring that can assist human resource team to analyze and report key metrics of recruitment procedure. It covers key elements that are rejection reason and offer decline reason Presenting our well structured Hiring Process Monitoring Dashboard With Average Recruitment Time. The topics discussed in this slide are Process, Monitoring, Dashboard. This is an instantly available PowerPoint presentation that can be edited conveniently. Download it right away and captivate your audience.
-
 Time To Market Project Dashboard With Average Delay
The following slide highlights the time to market dashboard with average delay illustrating projects completed on time, projects delayed, projects cancelled, completion rate vs Time and project types by new product, major feature release, medium feature release and minor feature release. Introducing our Time To Market Project Dashboard With Average Delay set of slides. The topics discussed in these slides are New Product, Medium Feature Release, Project Benchmark. This is an immediately available PowerPoint presentation that can be conveniently customized. Download it and convince your audience.
-
 Smart Action Plan For Call Center Action Plan Dashboard Highlighting Average Answer Time
This slide showcases call center action plan dashboard which highlights first call resolution, unresolved calls, customers call report, response time by weekday and average answer time. Deliver an outstanding presentation on the topic using this Smart Action Plan For Call Center Action Plan Dashboard Highlighting Average Answer Time. Dispense information and present a thorough explanation of Customers Call Report, Average Answer Time, Response Time using the slides given. This template can be altered and personalized to fit your needs. It is also available for immediate download. So grab it now.
-
 Analysis Of Average Wait Time At Retail Store Checkout Counters Analysis Of Retail Store Operations
The slide visually provides information regarding the average time customer spent at the checkout counter of retail store. It also provides details regarding waiting timings of competitors. Present the topic in a bit more detail with this Analysis Of Average Wait Time At Retail Store Checkout Counters Analysis Of Retail Store Operations. Use it as a tool for discussion and navigation on Analysis Of Average Wait, Time At Retail Store, Checkout Counters. This template is free to edit as deemed fit for your organization. Therefore download it now.
-
 Customer Service KPI Dashboard With Average Resolve Time
This slide showcases dashboard for customer service KPI that can help to identify the issue escalations and prioritize them to solve them before expiry. Its key elements are total cases, resolutions, escalations, SLA complaint, avg resolve time and avg CSAT. Introducing our Customer Service KPI Dashboard With Average Resolve Time set of slides. The topics discussed in these slides are Customer Service, KPI Dashboard, Average Resolve Time. This is an immediately available PowerPoint presentation that can be conveniently customized. Download it and convince your audience.
-
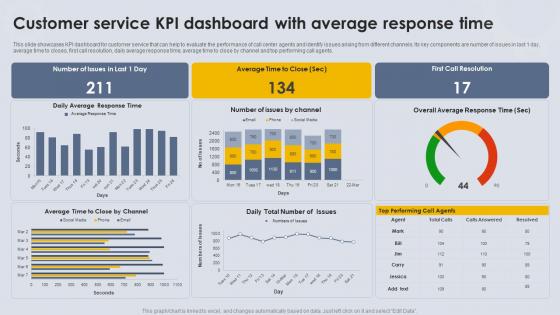 Customer Service KPI Dashboard With Average Response Time
This slide showcases KPI dashboard for customer service that can help to evaluate the performance of call center agents and identify issues arising from different channels. Its key components are number of issues in last 1 day, average time to closes, first call resolution, daily average response time, average time to close by channel and top performing call agents. Presenting our well-structured Customer Service KPI Dashboard With Average Response Time. The topics discussed in this slide are Customer Service, KPI Dashboard, Average Response Time. This is an instantly available PowerPoint presentation that can be edited conveniently. Download it right away and captivate your audience.
-
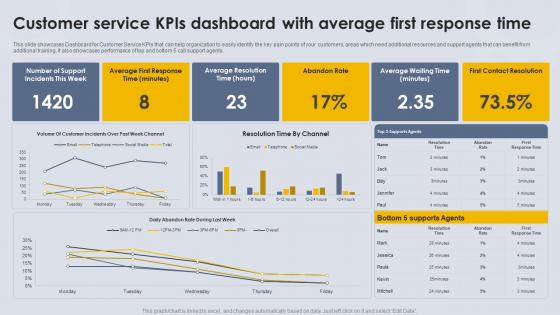 Customer Service KPIs Dashboard With Average First Response Time
This slide showcases Dashboard for Customer Service KPIs that can help organization to easily identify the key pain points of your customers, areas which need additional resources and support agents that can benefit from additional training. It also showcases performance of top and bottom 5 call support agents. Presenting our well-structured Customer Service KPIs Dashboard With Average First Response Time. The topics discussed in this slide are Customer Service, KPIS Dashboard, Average, First Response Time. This is an instantly available PowerPoint presentation that can be edited conveniently. Download it right away and captivate your audience.
-
 Retail Store Performance Analysis Of Average Wait Time At Retail Store Checkout
The slide visually provides information regarding the average time customer spent at the checkout counter of retail store. It also provides details regarding waiting timings of competitors. Deliver an outstanding presentation on the topic using this Retail Store Performance Analysis Of Average Wait Time At Retail Store Checkout. Dispense information and present a thorough explanation of Checkout Counter, Reflecting Slow Service, Customer Spend using the slides given. This template can be altered and personalized to fit your needs. It is also available for immediate download. So grab it now.
-
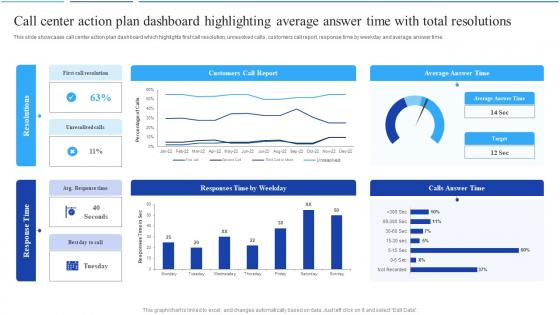 Call Center Agent Performance Call Center Action Plan Dashboard Highlighting Average Answer Time
This slide showcases call center action plan dashboard which highlights first call resolution, unresolved calls, customers call report, response time by weekday and average answer time. Deliver an outstanding presentation on the topic using this Call Center Agent Performance Call Center Action Plan Dashboard Highlighting Average Answer Time. Dispense information and present a thorough explanation of Customers Call Report, Average Answer Time, Calls Answer Time using the slides given. This template can be altered and personalized to fit your needs. It is also available for immediate download. So grab it now.
-
 Call Center Action Plan Dashboard Highlighting Average Answer Time Call Center Smart Action Plan
This slide showcases call center action plan dashboard which highlights first call resolution, unresolved calls, customers call report, response time by weekday and average answer time. Deliver an outstanding presentation on the topic using this Call Center Action Plan Dashboard Highlighting Average Answer Time Call Center Smart Action Plan. Dispense information and present a thorough explanation of Call Center, Action Plan, Dashboard, Resolutions using the slides given. This template can be altered and personalized to fit your needs. It is also available for immediate download. So grab it now.
-
 Shipping Analysis Dashboard With Average Delivery Time
This slide showcases shipping dashboard that can help business to be at ease with their capacity to monitor the status of their packages and identify the delay in delivery time. Its key components are courier delivery daily average, time delivery rate and orders delivered. Introducing our Shipping Analysis Dashboard With Average Delivery Time set of slides. The topics discussed in these slides are Orders Delivered, Courier Delivery, Average Delivery Time. This is an immediately available PowerPoint presentation that can be conveniently customized. Download it and convince your audience.
-
 Call Center KPI Dashboard With Average Queue Time
Mentioned slide outlines call center KPI dashboard which gives insights into customer agent performance. The KPI covered in the slide are total voicemail, average talk time, queue time, average quality rate, agent performance, etc. Introducing our Call Center KPI Dashboard With Average Queue Time set of slides. The topics discussed in these slides are Efficiency, Unsuccessful Inbound Calls, Activity. This is an immediately available PowerPoint presentation that can be conveniently customized. Download it and convince your audience.
-
 Call Center KPI Dashboard With Average Response Time
Mentioned slide outlines KPI dashboard which can be used by call center to measure the performance of their agents. The key metrics highlighted in the dashboard are first call resolution, daily abandonment rate, total number of calls by topic, top performing call agents etc. Presenting our well structured Call Center KPI Dashboard With Average Response Time. The topics discussed in this slide are First Call Resolution, Overall Average Response Time. This is an instantly available PowerPoint presentation that can be edited conveniently. Download it right away and captivate your audience.
-
 Average Time Required To Nurture Potential Leads Overview And Importance Of Sales Automation
This slide represents the average time required by customer to make purchase decision that help company to understand their preferences and nurture potential leads accordingly Present the topic in a bit more detail with this Average Time Required To Nurture Potential Leads Overview And Importance Of Sales Automation. Use it as a tool for discussion and navigation on Communication, Process, Potential. This template is free to edit as deemed fit for your organization. Therefore download it now.
-
 Performance Improvement Plan For Efficient Customer Service Impact 1 Decline In Average Response Time
This slide showcases the impact of good support service on the company. The metrics covered are average response time and first call resolution. Deliver an outstanding presentation on the topic using this Performance Improvement Plan For Efficient Customer Service Impact 1 Decline In Average Response Time. Dispense information and present a thorough explanation of Service, Software, Expectations using the slides given. This template can be altered and personalized to fit your needs. It is also available for immediate download. So grab it now.
-
 Performance Improvement Plan For Efficient Customer Service Issue 1 Increasing Average Response Time
This slide provides an overview of major KPIs of customer service team. The metrics covered are average response time and first call resolution. Present the topic in a bit more detail with this Performance Improvement Plan For Efficient Customer Service Issue 1 Increasing Average Response Time. Use it as a tool for discussion and navigation on Communication, Response, Dissatisfied Customers. This template is free to edit as deemed fit for your organization. Therefore download it now.
-
 SAAS Customer Support Metrics Dashboard With Average Handle Time
Following slide showcases customer service metrics dashboard of the SaaS company. Average handling time, customer satisfaction, customer service associate, average speed of answer are the core metrics which are mentioned in the dashboard. Presenting our well structured SAAS Customer Support Metrics Dashboard With Average Handle Time. The topics discussed in this slide are Kyle Anderson, Customer, Average. This is an instantly available PowerPoint presentation that can be edited conveniently. Download it right away and captivate your audience.
-
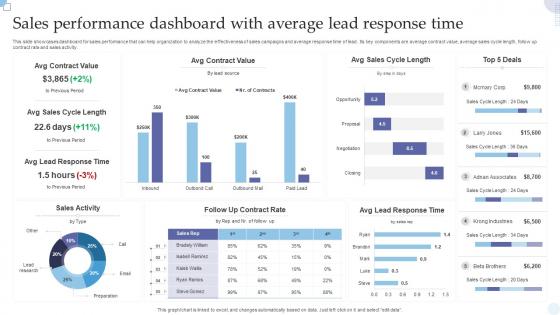 Sales Performance Dashboard With Average Lead Response Time
This slide showcases dashboard for sales performance that can help organization to analyze the effectiveness of sales campaigns and average response time of lead. Its key components are average contract value, average sales cycle length, follow up contract rate and sales activity. Presenting our well structured Sales Performance Dashboard With Average Lead Response Time. The topics discussed in this slide are Sales Activity, Avg Lead Response Time. This is an instantly available PowerPoint presentation that can be edited conveniently. Download it right away and captivate your audience.
-
 Bounce Rate Tracking Dashboard With Average Pages And Time
The following slide showcases dashboard that helps to identify the average time spent on page by visitors and the bounce rate. It also includes page load time, bounce rate by browser and details on internet explorer. Presenting our well structured Bounce Rate Tracking Dashboard With Average Pages And Time. The topics discussed in this slide are Bounces, Internet Explore, Browser. This is an instantly available PowerPoint presentation that can be edited conveniently. Download it right away and captivate your audience.
-
 Staffing Planning Resourcing Dashboard With Average Selection Time
This slide shows analysis of average time company takes to hire a candidate and number of applicants that pass through at each step of hiring process to speed up the whole function. It further includes details about departments, sources, locations, job roles, rejection and decline reason, etc. Introducing our Staffing Planning Resourcing Dashboard With Average Selection Time set of slides. The topics discussed in these slides are Rejection Reason, Offer Decline Reason, By Department. This is an immediately available PowerPoint presentation that can be conveniently customized. Download it and convince your audience.
-
 Techniques To Enhance Support Impact 1 Decline In Average Response Time
This slide showcases the impact of good support service on the company. The metrics covered are average response time and first call resolution. Present the topic in a bit more detail with this Techniques To Enhance Support Impact 1 Decline In Average Response Time. Use it as a tool for discussion and navigation on Average Response, Average Response Time. This template is free to edit as deemed fit for your organization. Therefore download it now.
-
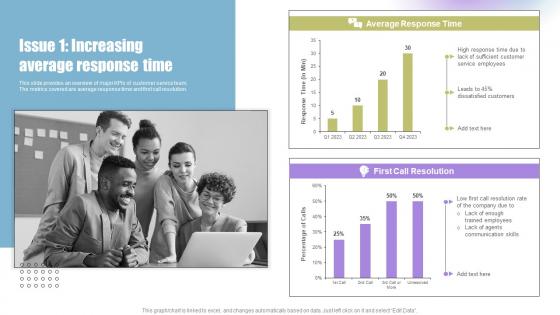 Techniques To Enhance Support Issue 1 Increasing Average Response Time
This slide provides an overview of major KPIs of customer service team. The metrics covered are average response time and first call resolution. Deliver an outstanding presentation on the topic using this Techniques To Enhance Support Issue 1 Increasing Average Response Time. Dispense information and present a thorough explanation of Average Response Time, First Call Resolution using the slides given. This template can be altered and personalized to fit your needs. It is also available for immediate download. So grab it now.


