- Sub Categories
-
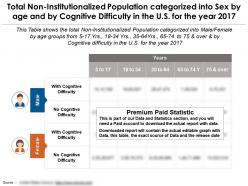 Non institutionalized population classified into sex by age and cognitive difficulty in the us for 2017
Presenting this set of slides with name - Non Institutionalized Population Classified Into Sex By Age And Cognitive Difficulty In The US For 2017. Total Non Institutionalized Population categorized into Sex by age and by Cognitive Difficulty in the U.S. for the year 2017. This is part of our Data and Statistics products selection, and you will need a Paid account to download the actual report with accurate data. Downloaded report will contain the actual editable graph with the actual data, an excel table with the actual data, the exact source of the data and the release date. This Table shows the total Non Institutionalized Population categorized into Male Female by age groups from 5-17 Yrs, 18-34 Yrs, 35-64Yrs, 65-74 to 75 and over and By Cognitive difficulty in the U.S. for the year 2017. It covers topic Cognitive Difficulty for Non Institutionalized Population by Sex for region USA and is for date range 2017. Download it immediately and use it for your business.
-
 Total non institutionalized population categorized into sex by disability status and age in the us for 2017
Presenting this set of slides with name - Total Non Institutionalized Population Categorized Into Sex By Disability Status And Age In The US For 2017. Total Non Institutionalized Population categorized into Sex by age and by Disability Status in the U.S. for the year 2017. This is part of our Data and Statistics products selection, and you will need a Paid account to download the actual report with accurate data. Downloaded report will contain the actual editable graph with the actual data, an excel table with the actual data, the exact source of the data and the release date. This table shows the total Non Institutionalized Population categorized into Male Female by age groups from less than 5 to 75 and over and By disability status in the U.S. for the year 2017. It covers topic Disability Status for Non Institutionalized Population by Sex for region USA and is for date range 2017. Download it immediately and use it for your business.
-
 4 ps marketing mix 360 feedback process adaptable cpb
Presenting this set of slides with name - 4 Ps Marketing Mix 360 Feedback Process Adaptable Cpb. This is an editable four stages graphic that deals with topics like 4 Ps Marketing Mix, 360 Feedback Process, Adaptable to help convey your message better graphically. This product is a premium product available for immediate download, and is 100 percent editable in Powerpoint. Download this now and use it in your presentations to impress your audience.
-
 Budgeting management base pyramid online reputation business assessments cpb
Presenting this set of slides with name - Budgeting Management Base Pyramid Online Reputation Business Assessments Cpb. This is an editable four stages graphic that deals with topics like Budgeting Management, Base Pyramid, Online Reputation, Business Assessments to help convey your message better graphically. This product is a premium product available for immediate download, and is 100 percent editable in Powerpoint. Download this now and use it in your presentations to impress your audience.
-
 Business plan strategy campaigning strategies expense reduction management cpb
Presenting this set of slides with name - Business Plan Strategy Campaigning Strategies Expense Reduction Management Cpb. This is an editable five stages graphic that deals with topics like Business Plan Strategy, Campaigning Strategies, Expense Reduction Management to help convey your message better graphically. This product is a premium product available for immediate download, and is 100 percent editable in Powerpoint. Download this now and use it in your presentations to impress your audience.
-
 Business system acquisition strategy risk business case study template cpb
Presenting this set of slides with name - Business System Acquisition Strategy Risk Business Case Study Template Cpb. This is an editable five stages graphic that deals with topics like Business System, Acquisition Strategy Risk, Business Case Study Template to help convey your message better graphically. This product is a premium product available for immediate download, and is 100 percent editable in Powerpoint. Download this now and use it in your presentations to impress your audience.
-
 Change process leadership management porters five forces program management cpb
Presenting this set of slides with name - Change Process Leadership Management Porters Five Forces Program Management Cpb. This is an editable four stages graphic that deals with topics like Change Process, Leadership Management, Porters Five Forces, Program Management to help convey your message better graphically. This product is a premium product available for immediate download, and is 100 percent editable in Powerpoint. Download this now and use it in your presentations to impress your audience.
-
 Creative thinking problem solving financial scorecard planning leadership cpb
Presenting this set of slides with name - Creative Thinking Problem Solving Financial Scorecard Planning Leadership Cpb. This is an editable two stages graphic that deals with topics like Creative Thinking Problem Solving, Financial Scorecard, Planning Leadership to help convey your message better graphically. This product is a premium product available for immediate download, and is 100 percent editable in Powerpoint. Download this now and use it in your presentations to impress your audience.
-
 Customer satisfaction david ulrich model employee transition plan cpb
Presenting this set of slides with name - Customer Satisfaction David Ulrich Model Employee Transition Plan Cpb. This is an editable two stages graphic that deals with topics like Customer Satisfaction, David Ulrich Model, Employee Transition Plan to help convey your message better graphically. This product is a premium product available for immediate download, and is 100 percent editable in Powerpoint. Download this now and use it in your presentations to impress your audience.
-
 Hr strategy map collaboration model going green perception management cpb
Presenting this set of slides with name - Hr Strategy Map Collaboration Model Going Green Perception Management Cpb. This is an editable two stages graphic that deals with topics like Hr Strategy Map, Collaboration Model, Going Green, Perception Management to help convey your message better graphically. This product is a premium product available for immediate download, and is 100 percent editable in Powerpoint. Download this now and use it in your presentations to impress your audience.
-
 Interactive advertising 80 20 pareto budget process control strategies cpb
Presenting this set of slides with name - Interactive Advertising 80 20 Pareto Budget Process Control Strategies Cpb. This is an editable four stages graphic that deals with topics like Interactive Advertising, 80 20 Pareto, Budget Process, Control Strategies to help convey your message better graphically. This product is a premium product available for immediate download, and is 100 percent editable in Powerpoint. Download this now and use it in your presentations to impress your audience.
-
 Total non institutionalized population of african american alone by disability and age group in us from 2013-2017
Presenting this set of slides with name - Total Non Institutionalized Population Of African American Alone By Disability And Age Group In Us From 2013-2017. Total Non Institutionalized Population categorized into Age and Disability Status Black or African American Alone in the U.S. for the year 2017. This is part of our Data and Statistics products selection, and you will need a Paid account to download the actual report with accurate data. Downloaded report will contain the actual editable graph with the actual data, an excel table with the actual data, the exact source of the data and the release date. This graph shows the Total Non Institutionalized Population Black or African American Alone categorized into Age Groups and Disability Status from Under 18 Yrs to 65 and Over in the U.S. for the year 2017. It covers topic Black or African Amreican Alone Disability Status for region USA and is for date range 2017. Download it immediately and use it for your business.
-
 Total non institutionalized population of native hawaiian by disability and age group in us from 2013-2017
Presenting this set of slides with name - Total Non Institutionalized Population Of Native Hawaiian By Disability And Age Group In Us From 2013-2017. Total Non Institutionalized Population by Disability Status categorized into Age Groups Native Hawaiian and Other Pacific Alone in the U.S. from 2013 to 2017. This is part of our Data and Statistics products selection, and you will need a Paid account to download the actual report with accurate data. Downloaded report will contain the actual editable graph with the actual data, an excel table with the actual data, the exact source of the data and the release date. This graph shows the Total Non Institutionalized Population by Disability Status Native Hawaiian and Other Pacific Alone categorized into Age Groups of Under 18 Yrs, 18Yrs to 64 yrs and 65 and Over in the U.S. from the years 2013 to 2017. It covers topic Native Hawaiian Disability Status for Non Institutionlized Population for region USA and is for date range 2013 to 2017 . Download it immediately and use it for your business.
-
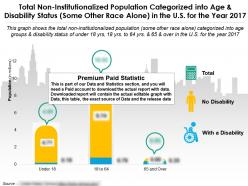 Total non institutionalized population of some other race alone by disability and age group in us for 2017
Presenting this set of slides with name - Total Non Institutionalized Population Of Some Other Race Alone By Disability And Age Group In Us For 2017. Total Non Institutionalized Population categorized into Age and Disability Status Some Other Race Alone in the U.S. for the year 2017. This is part of our Data and Statistics products selection, and you will need a Paid account to download the actual report with accurate data. Downloaded report will contain the actual editable graph with the actual data, an excel table with the actual data, the exact source of the data and the release date. This graph shows the Total Non Institutionalized Population Some Other Race Alone categorized into Age Groups and Disability Status of Under 18 Yrs, 18Yrs to 64 yrs and 65 and Over in the U.S. for the year 2017. It covers topic Disability Status for Non Institutionalized Population Some Other Race Alone by Age Groups for region USA and is for date range 2017. Download it immediately and use it for your business.
-
 Total population of households categories in past 12 months in 2017 inflation adjusted dollars from year 2013-22
Presenting this set of slides with name - Total Population Of Households Categories In Past 12 Months In 2017 Inflation Adjusted Dollars From Year 2013-22. Total Population Of Households With Categories In The Past 12 Months In 2017 Inflation Adjusted Dollars From The Year 2013 to 17 And Forecasts For 2018 to 2022. This is part of our Data and Statistics products selection, and you will need a Paid account to download the actual report with accurate data. Downloaded report will contain the actual editable graph with the actual data, an excel table with the actual data, the exact source of the data and the release date. This Graph Shows The Total Population Of Households With Categories Divided By Age In The Past 12 Months In 2017 Inflation Adjusted Dollars From The Year 2013 to 17 And Estimations For 2018 to 2022. It covers topic Households Population with Categories by Age for region USA and is for date range 2013 to 2022. Download it immediately and use it for your business.
-
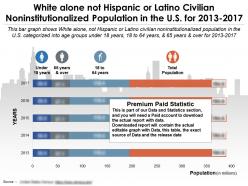 White alone not hispanic or latino civilian noninstitutionalized population in the us for 2013-2017
Presenting this set of slides with name - White Alone Not Hispanic Or Latino Civilian Noninstitutionalized Population In The Us For 2013-2017. White alone not Hispanic or Latino Civilian Noninstitutionalized Population in the U.S. for 2013 to 2017. This is part of our Data and Statistics products selection, and you will need a Paid account to download the actual report with accurate data. Downloaded report will contain the actual editable graph with the actual data, an excel table with the actual data, the exact source of the data and the release date. This bar graph shows White alone not Hispanic or Latino civilian noninstitutionalized population in the U.S. categorized into age groups under 18 years, 18 to 64 years, and 65 years and over for 2013 to 2017. It covers topic White alone, not Hispanic Population for region USA and is for date range 2013 to 2017. Download it immediately and use it for your business.
-
 Age by disability status for hispanic or latino civilian non institutionalized population in the us for 2017
Presenting this set of slides with name - Age By Disability Status For Hispanic Or Latino Civilian Non Institutionalized Population In The US For 2017. Age by Disability Status for Hispanic or Latino Civilian Non institutionalized Population in the U.S. for 2017. This is part of our Data and Statistics products selection, and you will need a Paid account to download the actual report with accurate data. Downloaded report will contain the actual editable graph with the actual data, an excel table with the actual data, the exact source of the data and the release date. This bar graph shows Hispanic or Latino civilian non institutionalized population in the U.S. with a disability and no disability categorized into age groups under 18 years, 18 to 64 years, and 65 years and over for 2017. It covers topic This bar graph shows Hispanic or Latino civilian noninstitutionalized population in the U.S. with a disability and no disability categorized into age groups under 18 years, 18 to 64 years, and 65 years and over for 2017 for region USA and is for date range 2017. Download it immediately and use it for your business.
-
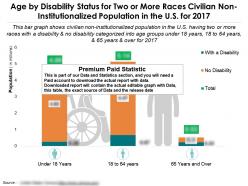 Age by disability status for two or more races civilian non institutionalized population in the us for 2017
Presenting this set of slides with name - Age By Disability Status For Two Or More Races Civilian Non Institutionalized Population In The Us For 2017. Age by Disability Status for two or more races civilian non institutionalized population in the U.S. for 2017. This is part of our Data and Statistics products selection, and you will need a Paid account to download the actual report with accurate data. Downloaded report will contain the actual editable graph with the actual data, an excel table with the actual data, the exact source of the data and the release date. This bar graph shows civilian non institutionalized population in the U.S. having two or more races with a disability and no disability categorized into age groups under 18 years, 18 to 64 years, and 65 years and over for 2017. It covers topic Two or more races Age by Disability Status for region USA and is for date range 2017. Download it immediately and use it for your business.
-
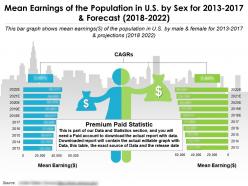 Mean earnings of the population in us by sex for 2013-2022
Presenting this set of slides with name - Mean Earnings Of The Population In Us By Sex For 2013-2022. Mean Earnings of the Population in U.S. by Sex for 2013 to 2017 and Forecast 2018 to 2022. This is part of our Data and Statistics products selection, and you will need a Paid account to download the actual report with accurate data. Downloaded report will contain the actual editable graph with the actual data, an excel table with the actual data, the exact source of the data and the release date. This bar graph shows mean earnings dollar of the population in U.S. by male and female for 2013 to 2017 and projections 2018 to 2022. It covers topic Mean Earnings by Sex for region USA and is for date range 2013 to 2022. Download it immediately and use it for your business.
-
 Per capita income in inflation adjusted dollars of the us population for 2013-2017
Presenting this set of slides with name - Per Capita Income In Inflation Adjusted Dollars Of The Us Population For 2013-2017. Per capita income in inflation adjusted dollars of the U.S. Population for 2013 to 2017. This is part of our Data and Statistics products selection, and you will need a Paid account to download the actual report with accurate data. Downloaded report will contain the actual editable graph with the actual data, an excel table with the actual data, the exact source of the data and the release date. This bar graph shows per capita income in the past 12 months in inflation adjusted dollars of the U.S. population for 2013 to 3017. It covers topic Per capita income for region USA and is for date range 2013 to 2017. Download it immediately and use it for your business.
-
 Population 18 to 64 years with a disability in the us for 2013-2022
Presenting this set of slides with name - Population 18 To 64 Years With A Disability In The Us For 2013-2022. Population 18 to 64 years with a disability in the U.S. for 2013 to 2017 and Forecast 2018 to 2022. This is part of our Data and Statistics products selection, and you will need a Paid account to download the actual report with accurate data. Downloaded report will contain the actual editable graph with the actual data, an excel table with the actual data, the exact source of the data and the release date. This bar graph shows U.S. population 18 to 64 years of age with disability for 2013 to 2017 and projections 2018 to 2022. It covers topic 18 to 64 years Population Disability Status for region USA and is for date range 2013 to 2022. Download it immediately and use it for your business.
-
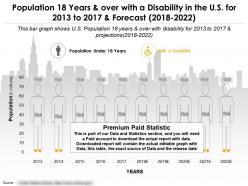 Population 18 years over with a disability in the us for 2013-2022
Presenting this set of slides with name - Population 18 Years Over With A Disability In The Us For 2013-2022. Population 18 years and over with a disability in the U.S. for 2013 to 2017 and Forecast 2018 to 2022. This is part of our Data and Statistics products selection, and you will need a Paid account to download the actual report with accurate data. Downloaded report will contain the actual editable graph with the actual data, an excel table with the actual data, the exact source of the data and the release date. This bar graph shows U.S. population 18 years and over with disability for 2013 to 2017 and projections 2018 to 2022. It covers topic 18 and Above Population Disability Status for region USA and is for date range 2013 to 2022. Download it immediately and use it for your business.
-
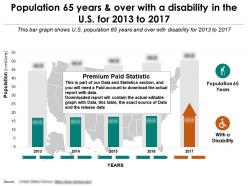 Population 65 years over with a disability in the us for 2013-2017
Presenting this set of slides with name - Population 65 Years Over With A Disability In The Us For 2013-2017. Population 65 years and over with a disability in the U.S. for 2013 to 2017. This is part of our Data and Statistics products selection, and you will need a Paid account to download the actual report with accurate data. Downloaded report will contain the actual editable graph with the actual data, an excel table with the actual data, the exact source of the data and the release date. This bar graph shows U.S. population 65 years and over with disability for 2013 to 2017. It covers topic 65 and above Population Disability Status for region USA and is for date range 2013 to 2017. Download it immediately and use it for your business.
-
 Total civilian employed population 16 years and over by male and female with occupations in us for 2017
Presenting this set of slides with name - Total Civilian Employed Population 16 Years And Over By Male And Female With Occupations In Us For 2017. Total Civilian Employed Population 16 years and over by Male and Female with Occupations in the U.S. for 2017. This is part of our Data and Statistics products selection, and you will need a Paid account to download the actual report with accurate data. Downloaded report will contain the actual editable graph with the actual data, an excel table with the actual data, the exact source of the data and the release date. This graph shows Total Civilian Employed Population by sex with Occupation types in US for 2017 broken into details of construction, wholesale trade, Transportation, Information, Arts and Public Administration. It covers topic Occupation Types for Civilian Employed Population for region USA and is for date range 2017. Download it immediately and use it for your business.
-
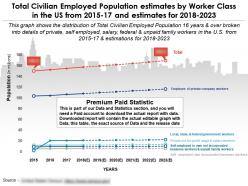 Total civilian employed population estimates by worker class in the us from 2015-2023
Presenting this set of slides with name - Total Civilian Employed Population Estimates By Worker Class In The Us From 2015-2023. Total Civilian Employed Population estimates by Worker Class in the US from 2015 to 17 and estimates for 2018 to 2023. This is part of our Data and Statistics products selection, and you will need a Paid account to download the actual report with accurate data. Downloaded report will contain the actual editable graph with the actual data, an excel table with the actual data, the exact source of the data and the release date. This graph shows the distribution of Total Civilian Employed Population 16 years and over broken into details of private, self employed, salary, federal and unpaid family workers in the U.S. from 2015 to 17 and estimations for 2018 to 2023 . It covers topic Civilian Employed Population by Worker Class for region USA and is for date range 2015 to 17. Download it immediately and use it for your business.
-
 Total non institutionalized population categorized into age by number of disabilities in us for year 2017
Presenting this set of slides with name - Total Non Institutionalized Population Categorized Into Age By Number Of Disabilities In Us For Year 2017. Total Non Institutionalized Population categorized into Age by Number of Disabilities in the U.S. for the year 2017. This is part of our Data and Statistics products selection, and you will need a Paid account to download the actual report with accurate data. Downloaded report will contain the actual editable graph with the actual data, an excel table with the actual data, the exact source of the data and the release date. This Table shows the total Non Institutionalized Population categorized into age groups from less than 5 Yrs, 5-17 Yrs, 18-34 Yrs, 35-64Yrs, 65-74 to 75 and over and by Number of Disabilities in the U.S. for the year 2017. It covers topic Number of Disabilities for Non Institutionalized Population by Age Groups for region USA and is for date range 2017. Download it immediately and use it for your business.
-
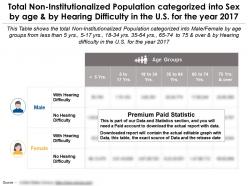 Total non institutionalized population categorized into sex by age by hearing difficulty in us for year 2017
Presenting this set of slides with name - Total Non Institutionalized Population Categorized Into Sex By Age By Hearing Difficulty In Us For Year 2017. Total Non Institutionalized Population categorized into Sex by age and by Hearing Difficulty in the U.S. for the year 2017. This is part of our Data and Statistics products selection, and you will need a Paid account to download the actual report with accurate data. Downloaded report will contain the actual editable graph with the actual data, an excel table with the actual data, the exact source of the data and the release date. This table shows the total Non Institutionalized Population categorized into Male Female by age groups from less than 5 Yrs, 5-17 Yrs, 18-34 Yrs, 35-64Yrs, 65-74 to 75 and over and By Hearing difficulty in the U.S. for the year 2017. It covers topic Hearing Difficulty for Non Institutionalized Population by Age Groups for region USA and is for date range 2017. Download it immediately and use it for your business.
-
 Total population in households showing poverty status in the past 12 months
Presenting this set of slides with name - Total Population In Households Showing Poverty Status In The Past 12 Months. Total Population in Households showing Poverty Status in the past 12 months for above and below poverty levels from 2013 to 17. This is part of our Data and Statistics products selection, and you will need a Paid account to download the actual report with accurate data. Downloaded report will contain the actual editable graph with the actual data, an excel table with the actual data, the exact source of the data and the release date. This graph shows the total population in households based on poverty status in the past 12 months for above and below poverty levels from 2013 to 17. It covers topic Households Population with Poverty Status by Poverty Levels for region USA and is for date range 2013 to 2017. Download it immediately and use it for your business.
-
 Bar chart finance marketing management investment analysis
Presenting this set of slides with name - Bar Chart Finance Marketing Management Investment Analysis. This is a two stage process. The stages in this process are Finance, Marketing, Management, Investment, Analysis.
-
 100 percent stacked bar finance marketing management investment analysis
Presenting this set of slides with name - 100 Percent Stacked Bar Finance Marketing Management Investment Analysis. This is a three stage process. The stages in this process are Finance, Marketing, Management, Investment, Analysis.
-
 Stacked bar finance marketing management investment analysis
Presenting this set of slides with name - Stacked Bar Finance Marketing Management Investment Analysis. This is a three stage process. The stages in this process are Finance, Marketing, Management, Investment, Analysis.
-
 Hiring plan positions by quarter marketing strategy business
Presenting this set of slides with name - Hiring Plan Positions By Quarter Marketing Strategy Business. This is a five stage process. The stages in this process are Finance, Marketing, Management, Investment, Analysis.
-
 Metrics insight ppt powerpoint presentation portfolio model cpb
Presenting this set of slides with name - Metrics Insight Ppt Powerpoint Presentation Portfolio Model Cpb. This is an editable four stages graphic that deals with topics like Metrics Insight to help convey your message better graphically. This product is a premium product available for immediate download, and is 100 percent editable in Powerpoint. Download this now and use it in your presentations to impress your audience.
-
 System project planning ppt powerpoint presentation portfolio layout cpb
Presenting this set of slides with name - System Project Planning Ppt Powerpoint Presentation Portfolio Layout Cpb. This is an editable three stages graphic that deals with topics like System Project Planning to help convey your message better graphically. This product is a premium product available for immediate download, and is 100 percent editable in Powerpoint. Download this now and use it in your presentations to impress your audience.
-
 Technology branding pros ppt powerpoint presentation portfolio graphics cpb
Presenting this set of slides with name - Technology Branding PROS Ppt Powerpoint Presentation Portfolio Graphics Cpb. This is an editable three stages graphic that deals with topics like Technology Branding, PROS to help convey your message better graphically. This product is a premium product available for immediate download, and is 100 percent editable in Powerpoint. Download this now and use it in your presentations to impress your audience.
-
 Corporate meeting agenda template ppt powerpoint presentation file visuals cpb
Presenting this set of slides with name - Corporate Meeting Agenda Template Ppt Powerpoint Presentation File Visuals Cpb. This is an editable two stages graphic that deals with topics like Corporate Meeting Agenda Template to help convey your message better graphically. This product is a premium product available for immediate download,and is 100 percent editable in Powerpoint. Download this now and use it in your presentations to impress your audience.
-
 Strategies negotiation ppt powerpoint presentation gallery files cpb
Presenting this set of slides with name - Strategies Negotiation Ppt Powerpoint Presentation Gallery Files Cpb. This is an editable two stages graphic that deals with topics like Strategies Negotiation to help convey your message better graphically. This product is a premium product available for immediate download,and is 100 percent editable in Powerpoint. Download this now and use it in your presentations to impress your audience.
-
 Classification of the us population having one race for 2013-2017
Presenting this set of slides with name - Classification Of The US Population Having One Race For 2013-2017. Classification of the U.S. Population having one Race for 2013 to 2017. This is part of our Data and Statistics products selection, and you will need a Paid account to download the actual report with accurate data. Downloaded report will contain the actual editable graph with the actual data, an excel table with the actual data, the exact source of the data and the release date. This bar graph shows the distribution of U.S. population having one race for 2013 to 2017 into White, Black or African American, American Indian and Alaska Native, Asian, Native Hawaiian and Other Pacific Islander and Some other race. It covers topic U.S Population by One Race for region USA and is for date range 2013 to 17. Download it immediately and use it for your business.
-
 Classification of the us population having one race for 2013-2022
Presenting this set of slides with name - Classification Of The US Population Having One Race For 2013-2022. Classification of the U.S. Population having One Race for 2013 to 2017 and Forecast 2018 to 2022. This is part of our Data and Statistics products selection, and you will need a Paid account to download the actual report with accurate data. Downloaded report will contain the actual editable graph with the actual data, an excel table with the actual data, the exact source of the data and the release date. This bar graph shows the distribution of U.S. population having one race for 2013 to 2017 and projections 2018 to 2022 into White, Black or African American, American Indian and Alaska Native, Asian, Native Hawaiian and Other Pacific Islander, and Some other race. It covers topic U.S Population for One Race for region USA and is for date range 2013 to 22. Download it immediately and use it for your business.
-
 Language spoken at home by us population 5 years and over for 2013-2022
Presenting this set of slides with name - Language Spoken At Home By US Population 5 Years And Over For 2013-2022. Language Spoken at Home by U.S. population 5 years and over for 2013 to 2017 and Forecast 2018 to 2022. This is part of our Data and Statistics products selection, and you will need a Paid account to download the actual report with accurate data. Downloaded report will contain the actual editable graph with the actual data, an excel table with the actual data, the exact source of the data and the release date. This bar graph shows distribution of U.S. population 5 years and over by language spoken at home for 2013 to 2017 and projections 2018 to 2022 categorized into English only and Language other than English. It covers topic Language Spoken by 5 years and over at Home for region USA and is for date range 2013 to 17. Download it immediately and use it for your business.
-
 Marital status of the 15 years and over us population for 2013-2022
Presenting this set of slides with name - Marital Status Of The 15 Years And Over US Population For 2013-2022. Marital Status of the 15 Years and over U.S. Population for 2013 to 2017 and Forecast 2018 to 2022. This is part of our Data and Statistics products selection, and you will need a Paid account to download the actual report with accurate data. Downloaded report will contain the actual editable graph with the actual data, an excel table with the actual data, the exact source of the data and the release date. This bar graph shows distribution of U.S. population 15 years and over by marital status for 2013 to 2017 and projections 2018 to 2022. It covers topic Marital Status of 15 Years and Over for region USA and is for date range 2013 to 22. Download it immediately and use it for your business.
-
 Racial distribution of the us population for 2013-2017
Presenting this set of slides with name - Racial Distribution Of The US Population For 2013-2017. Racial Distribution of the U.S. Population for 2013 to 2017. This is part of our Data and Statistics products selection, and you will need a Paid account to download the actual report with accurate data. Downloaded report will contain the actual editable graph with the actual data, an excel table with the actual data, the exact source of the data and the release date. This bar graph shows classification of population in the U.S. by one and two or more races for 2013 to 2017. It covers topic Racial Distribution in the U.S by Two or more races for region USA and is for date range 2013 to 17. Download it immediately and use it for your business.
-
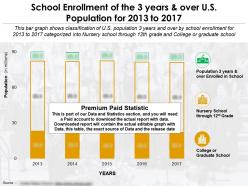 School enrollment of the 3 years and over us population for 2013-2017
Presenting this set of slides with name - School Enrollment Of The 3 Years And Over US Population For 2013-2017. School Enrollment of the 3 years and over U.S. Population for 2013 to 2017. This is part of our Data and Statistics products selection, and you will need a Paid account to download the actual report with accurate data. Downloaded report will contain the actual editable graph with the actual data, an excel table with the actual data, the exact source of the data and the release date. This bar graph shows classification of U.S. population 3 years and over by school enrollment for 2013 to 2017 categorized into Nursery school through 12th grade and College or graduate school. It covers topic School Enrollment for 3 years and over in U.S for region USA and is for date range 2013 to 17. Download it immediately and use it for your business.
-
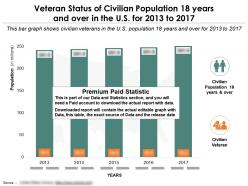 Veteran status of civilian population 18 years
Presenting this set of slides with name - Veteran Status Of Civilian Population 18 Years. Veteran Status of Civilian Population 18 years and over in the U.S. for 2013 to 2017. This is part of our Data and Statistics products selection, and you will need a Paid account to download the actual report with accurate data. Downloaded report will contain the actual editable graph with the actual data, an excel table with the actual data, the exact source of the data and the release date. This bar graph shows civilian veterans in the U.S. population 18 years and over for 2013 to 2017. It covers topic Veteran Status of 18 Years and Over in U.S for region USA and is for date range 2013 to 17. Download it immediately and use it for your business.
-
 Burn rate ppt powerpoint presentation file background images cpb
Presenting this set of slides with name - Burn Rate Ppt Powerpoint Presentation File Background Images Cpb. This is an editable three stages graphic that deals with topics like Burn Rate to help convey your message better graphically. This product is a premium product available for immediate download,and is 100 percent editable in Powerpoint. Download this now and use it in your presentations to impress your audience.
-
 Classification of population in the us by age group for 2013-2017
Presenting this set of slides with name - Classification Of Population In The US By Age Group For 2013-2017. Classification of population in the U.S. by Age Group for 2013 to 2017. This is part of our Data and Statistics products selection, and you will need a Paid account to download the actual report with accurate data. Downloaded report will contain the actual editable graph with the actual data, an excel table with the actual data, the exact source of the data and the release date. This bar graph shows distribution of U.S. population into different age groups for 2013 to 2017 categorized into Under 15 years, 15 to 17 years, 18 to 24 years, 25 to 34 years, 35 to 44 years, 45 to 54 years, 55 to 64 years, 65 to 74 years, 75 to 84 years, 85 years and over. It covers topic Population in U.S by Age Group for region USA and is for date range 2013 to 17. Download it immediately and use it for your business.
-
 Independent difficulty status for non institutionalized population 18 years and over in the us by sex for 2017
Presenting this set of slides with name - Independent Difficulty Status For Non Institutionalized Population 18 Years And Over In The US By Sex For 2017. Independent Living Difficulty Status for Civilian Noninstitutionalized Population 18 Years and over in the U.S. by Age and Sex for 2017. This is part of our Data and Statistics products selection, and you will need a Paid account to download the actual report with accurate data. Downloaded report will contain the actual editable graph with the actual data, an excel table with the actual data, the exact source of the data and the release date. This table shows classification of Civilian Noninstitutionalized Population 18 Years and over in the U.S. with and without Independent Living difficulty by male and female categorized into age groups 18 to 34 years, 35 to 64 years, 65 to 74 years, and 75 years and over for 2017. It covers topic Civilian Noninstitutionalized Independent Living Difficulty Status for region USA and is for date range 2017. Download it immediately and use it for your business.
-
 Median earnings for civilian employed population 16 years and over by sex in the us from 2015-17
Presenting this set of slides with name - Median Earnings For Civilian Employed Population 16 Years And Over By Sex In The US From 2015-17. Median Earnings in 2017 inflation adjusted dollars for Civilian Employed Population 16 Years and over by Sex in the U.S. from 2015 to 2017. This is part of our Data and Statistics products selection, and you will need a Paid account to download the actual report with accurate data. Downloaded report will contain the actual editable graph with the actual data, an excel table with the actual data, the exact source of the data and the release date. This bar graph shows median earnings for 16 years and over civilian employed U.S. population by male and female from 2015 to 2017. It covers topic Distribution of Population with Occupations by Sex for region USA and is for date range 2015 to 17. Download it immediately and use it for your business.
-
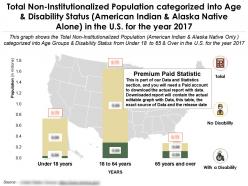 Non institutionalized population categorized by age american indian and alaska native alone in us for year 2017
Presenting this set of slides with name - Non Institutionalized Population Categorized By Age American Indian And Alaska Native Alone In US For Year 2017. Total Non Institutionalized Population categorized into Age and Disability Status American Indian And Alaska Native Alone in the U.S. for the year 2017. This is part of our Data and Statistics products selection, and you will need a Paid account to download the actual report with accurate data. Downloaded report will contain the actual editable graph with the actual data, an excel table with the actual data, the exact source of the data and the release date. This graph shows the Total Non Institutionalized Population American Indian and Alaska Native Only categorized into Age Groups and Disability Status from Under 18 Yrs to 65 And Over in the U.S. for the year 2017. It covers topic American Indian and Alaska Native Alone Disability Status for region USA and is for date range 2017. Download it immediately and use it for your business.
-
 Non institutionalized population categorized into age and disability status white alone in the us for year 2017
Presenting this set of slides with name - Non Institutionalized Population Categorized Into Age And Disability Status White Alone In The US For Year 2017. Total Non Institutionalized Population categorized into Age and Disability Status White Alone in the U.S. for the year 2017. This is part of our Data and Statistics products selection, and you will need a Paid account to download the actual report with accurate data. Downloaded report will contain the actual editable graph with the actual data, an excel table with the actual data, the exact source of the data and the release date. This graph shows the Total Non Institutionalized Population White Alone categorized into Age Groups and Disability Status from Under 18 Yrs to 65 And Over in the U.S. for the year 2017. It covers topic Under 18 to 65 and Over Disability status for Non Institutionalized Population White Alone for region USA and is for date range 2017. Download it immediately and use it for your business.
-
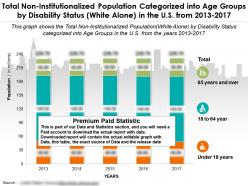 Non institutionalized population categorized into age by disability status white alone in the us from 2013-17
Presenting this set of slides with name - Non Institutionalized Population Categorized Into Age By Disability Status White Alone In The US From 2013-17. Total Non Institutionalized Population categorized into Age and Disability Status White Alone in the U.S. for the year 2017. This is part of our Data and Statistics products selection, and you will need a Paid account to download the actual report with accurate data. Downloaded report will contain the actual editable graph with the actual data, an excel table with the actual data, the exact source of the data and the release date. This graph shows the Total Non Institutionalized Population White Alone categorized into Age Groups and Disability Status from Under 18 Yrs to 65 and Over in the U.S. for the year 2017. It covers topic Under 18 to 65 and Over Disability status for Non Institutionalized Population White Alone for region USA and is for date range 2017. Download it immediately and use it for your business.
-
 Non institutionalized population of american indian by disability status categorized into age in us from 2013-17
Presenting this set of slides with name - Non Institutionalized Population Of American Indian By Disability Status Categorized Into Age In US From 2013-17. Total Non Institutionalized Population by Disability Status categorized into Age Groups American Indian and Alaska Native Alone in the U.S. from 2013 to 2017 . This is part of our Data and Statistics products selection, and you will need a Paid account to download the actual report with accurate data. Downloaded report will contain the actual editable graph with the actual data, an excel table with the actual data, the exact source of the data and the release date. This graph shows the Total Non Institutionalized Population by Disability Status American Indian and Alaska Native Alone categorized into Age Groups in the U.S. from the years 2013 to 2017 . It covers topic American Indian and Alaska Native Alone into Age Groups for region USA and is for date range 2013 to 17. Download it immediately and use it for your business.
-
 Occupation types and median earnings for civilian employed population 16 years and over by sex in the us for 2017
Presenting this set of slides with name - Occupation Types And Median Earnings For Civilian Employed Population 16 Years And Over By Sex In The US For 2017. Occupation Types and Median Earnings in 2017 inflation adjusted dollars for Civilian Employed Population 16 years and over by Sex in the U.S. for 2017. This is part of our Data and Statistics products selection, and you will need a Paid account to download the actual report with accurate data. Downloaded report will contain the actual editable graph with the actual data, an excel table with the actual data, the exact source of the data and the release date. This bar graph shows median earnings in different occupation types for 16 years and over civilian employed U.S. Population by male and female for 2017. It covers topic Occupation Types and Median Earnings by Sex for region USA and is for date range 2017. Download it immediately and use it for your business.
-
 Occupations and median earnings for civilian employed population 16 years and over by sex in the us for 2017
Presenting this set of slides with name - Occupations And Median Earnings For Civilian Employed Population 16 Years And Over By Sex In The US For 2017. Major Occupations and Median Earnings in 2017 inflation adjusted dollars for Civilian Employed Population 16 years and over by Sex in the U.S. for 2017. This is part of our Data and Statistics products selection, and you will need a Paid account to download the actual report with accurate data. Downloaded report will contain the actual editable graph with the actual data, an excel table with the actual data, the exact source of the data and the release date. This bar graph shows median earnings in different occupations for the 16 years and over civilian employed U.S. population by male and female for 2017. It covers topic Occupations and Median Earnings in U.S by Sex for region USA and is for date range 2017. Download it immediately and use it for your business.
-
 Population in households showing poverty status past 12 months above and below poverty levels sub categories 2017
Presenting this set of slides with name - Population In Households Showing Poverty Status Past 12 Months Above And Below Poverty Levels Sub Categories 2017. Total Population in Households showing Poverty Status in the past 12 months for above and below poverty levels with thier sub categories for 2017. This is part of our Data and Statistics products selection, and you will need a Paid account to download the actual report with accurate data. Downloaded report will contain the actual editable graph with the actual data, an excel table with the actual data, the exact source of the data and the release date. This graph shows total population in households with Poverty Status in the past 12 months for above and below poverty levels broken into family and non family households for the year 2017. It covers topic Households Population with Poverty Status by Poverty Levels and Households for region USA and is for date range 2017. Download it immediately and use it for your business.
-
 Business maturity model ppt powerpoint presentation outline gallery cpb
Presenting this set of slides with name - Business Maturity Model Ppt Powerpoint Presentation Outline Gallery Cpb. This is an editable three stages graphic that deals with topics like Business Maturity Model to help convey your message better graphically. This product is a premium product available for immediate download, and is 100 percent editable in Powerpoint. Download this now and use it in your presentations to impress your audience.
-
 Change mgmt ppt powerpoint presentation outline layouts cpb
Presenting this set of slides with name - Change Mgmt Ppt Powerpoint Presentation Outline Layouts Cpb. This is an editable three stages graphic that deals with topics like Change Mgmt to help convey your message better graphically. This product is a premium product available for immediate download, and is 100 percent editable in Powerpoint. Download this now and use it in your presentations to impress your audience.
-
 Cost business analysis ppt powerpoint presentation outline background cpb
Presenting this set of slides with name - Cost Business Analysis Ppt Powerpoint Presentation Outline Background Cpb. This is an editable three stages graphic that deals with topics like Cost Business Analysis to help convey your message better graphically. This product is a premium product available for immediate download, and is 100 percent editable in Powerpoint. Download this now and use it in your presentations to impress your audience.
-
 Delegate tasks ppt powerpoint presentation outline guide cpb
Presenting this set of slides with name - Delegate Tasks Ppt Powerpoint Presentation Outline Guide Cpb. This is an editable three stages graphic that deals with topics like Delegate Tasks to help convey your message better graphically. This product is a premium product available for immediate download, and is 100 percent editable in Powerpoint. Download this now and use it in your presentations to impress your audience.
-
 Event agenda ppt powerpoint presentation outline rules cpb
Presenting this set of slides with name - Event Agenda Ppt Powerpoint Presentation Outline Rules Cpb. This is an editable three stages graphic that deals with topics like Event Agenda to help convey your message better graphically. This product is a premium product available for immediate download, and is 100 percent editable in Powerpoint. Download this now and use it in your presentations to impress your audience.
No Reviews


