- Sub Categories
-
 Data driven 3d bar chart as research tool powerpoint slides
We are proud to present our data driven 3d bar chart as research tool powerpoint slides. Bar charts compare distinct items or show single items at distinct intervals.This PPT diagram is one of the easiest ways to compare numbers. Make your presenations more interesting than just talk or print
-
 Data driven 3d bar chart for analyzing survey data powerpoint slides
We are proud to present our data driven 3d bar chart for analyzing survey data powerpoint slides. This PowerPoint chart can be used to illustrate many types of data. It should be used to make facts clearer and more understandable. Quick way for the audience to visualize what you are saying numbers trends up or down .
-
 Data driven 3d bar chart for business information powerpoint slides
We are proud to present our data driven 3d bar chart for business information powerpoint slides. The above template shows data driven bar chart.This ppt diagram is simple and practical techniques that have helped the leading people in business, sport and public service reach the pinnacles of their careers.
-
 Data driven 3d bar chart for business statistics powerpoint slides
We are proud to present our data driven 3d bar chart for business statistics powerpoint slides. This Professionally designed PowerPoint template shows bar chart for business statistics. Using visual representations to present data and evaluation of activities makes audience easier to understand.
-
 Data driven 3d bar chart for business trends powerpoint slides
We are proud to present our data driven 3d bar chart for business trends powerpoint slides. This PowerPoint chart can be used to illustrate many types of data. It should be used to make facts clearer and more understandable. Quick way for the audience to visualize what you are saying numbers trends up or down .
-
 Data driven 3d bar chart for comparison of time series data powerpoint slides
We are proud to present our data driven 3d bar chart for comparison of time series data powerpoint slides. This PowerPoint chart can be used to illustrate many types of data. It should be used to make facts clearer and more understandable. it can be very helpful in training employees to perform the process according to standardized procedures
-
 Data driven 3d bar chart for data interpretation powerpoint slides
We are proud to present our data driven 3d bar chart for data interpretation powerpoint slides. This PowerPoint diagram condense large amounts of information into easy-to-understand formats that clearly and effectively communicate important points. It should be used to make facts clearer and more understandable.
-
 Data driven 3d bar chart for data modification powerpoint slides
We are proud to present our data driven 3d bar chart for data modification powerpoint slides. This slide is an excellent backdrop for you to enlighten your audience on the process you have gone through and the vision you have for the future. It helps to focus the thoughts of your listeners.
-
 Data driven 3d bar chart for financial data solutions powerpoint slides
We are proud to present our data driven 3d bar chart for financial data solutions powerpoint slides. Develop competitive advantage with our above template which enables users to create and present topics. This is an easy and effective way to present process. Use this chart to bring facts to life.
-
 Data driven 3d bar chart for market surveys powerpoint slides
We are proud to present our data driven 3d bar chart for market surveys powerpoint slides. This PowerPoint Layout can explain the relevance of the different stages in getting down to your core competence, ability and desired result. It educates your team with your thoughts and logic.
-
 Data driven 3d bar chart for research in statistics powerpoint slides
Presenting data driven 3d bar chart for research in statistics presentation slides. Effortlessly alterable template slide as stats in excel sheet styles are customizable. This presentation slide is entirely flexible with Google Slides. Easy to download this template and save into JPEG and PDF format. Application of the best graphics, color, and icons. Quick to insert organization image, name, signature, copyright and picture for personalization of slide. Graphics quality does not get harm when displayed on widescreen. Instructional slides are available for guidance.
-
 Data driven 3d bar chart to compare categories powerpoint slides
We are proud to present our data driven 3d bar chart to compare categories powerpoint slides. You can present your opinions using this impressive template. It helps your team to align their arrows to consistently be accurate. Use this slide to highlight your thought process.
-
 Data driven 3d bar chart to dispaly data powerpoint slides
We are proud to present our data driven 3d bar chart to dispaly data powerpoint slides. This PowerPoint diagram helps you to determine the number of activities to be studied and the number of people involved in the process.Transmit your thoughts via this slide and prods your team to action.
-
 Data driven 3d bar chart to put information powerpoint slides
We present to you this data driven 3D bar chart to put information PowerPoint slides. As the PPT presentation is fully editable you can change the font size, font style and the font color used in the pre-designed slides. You can save the presentation in JPG or PDF format. The slides can also be viewed in standard size display ratio of 4:3 or widescreen display ratio of 16:9. The template is compatible with Google slides, which makes it even easier to use.
-
 Data driven 3d chart to represent quantitative differences powerpoint slides
We are proud to present our data driven 3d chart to represent quantitative differences powerpoint slides. Our Data Driven 3D Chart To Represent Quantitative Differences Powerpoint Slides Power Point Templates Will Generate And Maintain The Level Of Interest You Desire. They Will Create The Impression You Want To Imprint On Your Audience. Our Data Driven 3D Chart To Represent Quantitative Differences Powerpoint Slides Power Point Templates Are Effectively Color Coded To Priorities Your Plans. They Automatically Highlight The Sequence Of Events You Desire.
-
 Data driven 3d classification of data chart powerpoint slides
We are proud to present our data driven 3d classification of data chart powerpoint slides. Our Data Driven 3D Classification Of Data Chart Powerpoint Slides Power Point Templates Will Provide Weight To Your Words. They Will Bring Out The Depth Of Your Thought Process. Words Like Arrows Fly Straight And True. Use Our Data Driven 3D Classification Of Data Chart Powerpoint Slides Power Point Templates To Make Them Hit Bulls eye Every time.
-
 Data driven area chart with plotted line in center powerpoint slides
We are proud to present our data driven area chart with plotted line in center powerpoint slides. Seamlessly Flow From Idea To Idea. Our Data Driven Area Chart With Plotted Line In Center Powerpoint Slides Power Point Templates Give You The Threads To Weave. Ride The Surf With Our Data Driven Area Chart With Plotted Line In Center Powerpoint Slides Power Point Templates. They Will Keep You Upright Till You Hit The Shore.
-
 Data driven bar chart for collection of data powerpoint slides
We are proud to present our data driven bar chart for collection of data powerpoint slides. Open The Mental Windows Of Your Audience With Our Data Driven Bar Chart For Collection Of Data Powerpoint Slides Power Point Templates. Let The Fresh Breeze Of Your Thoughts Flow Through. High Five Your Audience With Our Data Driven Bar Chart For Collection Of Data Powerpoint Slides Power Point Templates. See Them Extend Their Hands With Joy.
-
 Data driven bar chart for data analysis powerpoint slides
We are proud to present our data driven bar chart for data analysis powerpoint slides. It Takes Two To Tango They Always Say. Partner Our Data Driven Bar Chart For Data Analysis Powerpoint Slides Power Point Templates And Burn The Floor. Your Ideas Will Blossom With Our Data Driven Bar Chart For Data Analysis Powerpoint Slides Power Point Templates. The Fruits Of Your Effort Will Be Sweet Indeed.
-
 Data driven bar chart for different categories powerpoint slides
We are proud to present our data driven bar chart for different categories powerpoint slides. Great Ideas Deserve A Powerful Launch. Our Data Driven Bar Chart For Different Categories Powerpoint Slides Power Point Templates Will Give Them The Thrust They Need. Bake Your Thoughts In The Oven Of Our Data Driven Bar Chart For Different Categories Powerpoint Slides Power Point Templates. Sense The Aromas Of Your Ideas Waft Across The Room.
-
 Data driven bar chart to compare quantities powerpoint slides
We are proud to present our data driven bar chart to compare quantities powerpoint slides. Use Our Data Driven Bar Chart To Compare Quantities Powerpoint Slides Power Point Templates In Concert. Create A Masterful Melody With Your Ideas. Light A Fire With Our Data Driven Bar Chart To Compare Quantities Powerpoint Slides Power Point Templates. Spread The Warmth Of Your Ideas.
-
 Data driven bar chart to handle data powerpoint slides
We are proud to present our data driven bar chart to handle data powerpoint slides. Ay Out The Red Carpet With Our Data Driven Bar Chart To Handle Data Powerpoint Slides Power Point Templates. Take Your Audience On The Grand Walk Of Fame. Swish The Air With Our Magical Data Driven Bar Chart To Handle Data Powerpoint Slides Power Point Templates. Pull A Rabbit Out Of The Hat With Your Ideas.
-
 Data driven bar graph powerpoint slides
We are proud to present our data driven bar graph powerpoint slides. Honors Your Audience With A Grand Parade Of Your Thoughts. Shower On Them The Confetti Of Our Data Driven Bar Graph Powerpoint Slides Power Point Templates. Set New Benchmarks With Our Data Driven Bar Graph Powerpoint Slides Power Point Templates. They Will Keep Your Prospects Well Above Par.
-
 Data driven bar graph to compare data powerpoint slides
We are proud to present our data driven bar graph to compare data powerpoint slides. Our Data Driven Bar Graph To Compare Data Powerpoint Slides Power Point Templates Are Truly Out Of This World. Even The MIB Duo Has Been Keeping Tabs On Our Team. Our Data Driven Bar Graph To Compare Data Powerpoint Slides Power Point Templates Team Portray An Attitude Of Elegance. Personify This Quality By Using Them Regularly.
-
 Data driven data base bar chart design powerpoint slides
We are proud to present our data driven data base bar chart design powerpoint slides. Our Data Driven Data Base Bar Chart Design Powerpoint Slides Power Point Templates Are A Sure Bet. Guaranteed To Win Against All Odds. Whip Up A Frenzy With Our Data Driven Data Base Bar Chart Design Powerpoint Slides Power Point Templates. They Will Fuel The Excitement Of Your Team.
-
 Data driven 3d bar chart for financial markets powerpoint slides
We are proud to present our data driven 3d bar chart for financial markets powerpoint slides. Our Data Driven 3D Bar Chart For Financial Markets Powerpoint slides Power Point Templates Are Aesthetically Designed To Attract Attention. We Guarantee That They Will Grab All The Eyeballs You Need. Our Data Driven 3D Bar Chart For Financial Markets Powerpoint slides Power Point Templates Are Specially Created By A Professional Team With Vast Experience. They Diligently Strive To Come Up With The Right Vehicle For Your Brilliant Ideas.
-
 Data driven 3d bar chart for foreign trade powerpoint slides
We are proud to present our data driven 3d bar chart for foreign trade powerpoint slides. Deadlines Are An Element Of Todays Workplace. Our Data Driven 3D Bar Chart For Foreign Trade Powerpoint slides Power Point Templates Help You Meet The Demand. Just Browse And Pick The Slides That Appeal To Your Intuitive Senses. Our Data Driven 3D Bar Chart For Foreign Trade Powerpoint slides Power Point Templates Will Help You Be Quick Off The Draw. Just Enter Your Specific Text And See Your Points Hit Home.
-
 Data driven 3d bar chart to communicate information powerpoint slides
We are proud to present our data driven 3d bar chart to communicate information powerpoint slides. Our Data Driven 3D Bar Chart To Communicate Information Powerpoint slides Power Point Templates Will Generate And Maintain The Level Of Interest You Desire. They Will Create The Impression You Want To Imprint On Your Audience. Our Data Driven 3D Bar Chart To Communicate Information Powerpoint slides Power Point Templates Are Effectively Color Coded To Priorities Your Plans. They Automatically Highlight The Sequence Of Events You Desire.
-
 Data driven 3d currency trading bar chart powerpoint slides
We are proud to present our data driven 3d currency trading bar chart powerpoint slides. Our Data Driven 3D Currency Trading Bar Chart Powerpoint slides Power Point Templates Are The Chords Of Your Song. String Them Along And Provide The Lilt To Your Views. Our Data Driven 3D Currency Trading Bar Chart Powerpoint slides Power Point Templates Help You Pinpoint Your Timelines. Highlight The Reasons For Your Deadlines With Their Use.
-
 Data driven 3d forex market bar chart powerpoint slides
We are proud to present our data driven 3d forex market bar chart powerpoint slides. Our Data Driven 3D Forex Market Bar Chart Powerpoint slides Power Point Templates Give You The Basic Framework Of Your Talk. Give It The Shape You Desire With Your Wonderful Views. Our Data Driven 3D Forex Market Bar Chart Powerpoint slides Power Point Templates Are The Lungs Of Your Talk. Fill Them With The Oxygen Of Your In-depth Thought Process.
-
 Data driven 3d time based bar chart powerpoint slides
We are proud to present our data driven 3d time based bar chart powerpoint slides. Whatever The Nuance You Want To Project. We Have A 3D Data Driven Time Based Bar Chart Powerpoint slides Power Point Templates That Will Get It Across. Create A Connection With Your Audience Using Our 3D Data Driven Time Based Bar Chart Powerpoint slides Power Point Templates. Transfer Your Depth Of Knowledge Clearly Across To Them.
-
 0414 apple bar chart business layout powerpoint graph
Icons do not pixelate when opened on a wide display. Trouble-free insertion of your company’s name. Replace the content with your own business data. Follow the instructions to edit and change the slide icons. Allow instant downloading and saving in variety of formats. Fit to be edited using Google slides. Beneficial for the marketing people, Business managers and the Human resource.
-
 0414 bar chart for business report powerpoint graph
Edit and modify it the way you want to. Replace the icons images and enter the content in the provided text spaces. Download and save instantly. Use your brand’s name at the place of watermark and make it your own slide template. No effect on picture quality when opened on a big screen. Beneficial for the Business presenters and marketing professionals.
-
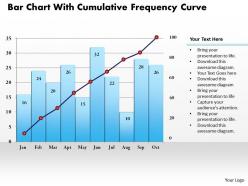 0414 bar chart with cumulative frequency curve powerpoint graph
Editing and upgrading of compiled data is simple in presentation visual. Presentation slide is helpful in business marketing, management and recourse disbursement. Principal work which can be altered with respect to font, color and layout. Appealing and impressive color contrast gives a professional look to PPT layout. Conversion into PDF or JPG formats is painless and user friendly. PPT graphic renders quality font size which can be read from a distance.
-
 0414 best business idea bar chart powerpoint graph
Easily presentable PowerPoint design. Presentation template slide download easily. Text, font, colors and orientation can be changed as per the commerce need. Unaffected High resolution presentation design even after customization. Presentable with business details name and logo of your company. Well harmonious with all the software’s and Google slides. Translatable into PDF or JPEG formats. Suitable for sharing information on progress, development, targets, goals, success, achievements etc.
-
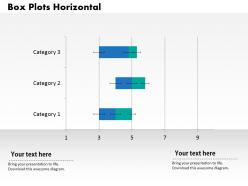 0414 box plots horizontal bar chart powerpoint graph
We are proud to present our 0414 box plots horizontal bar chart powerpoint graph. Deadlines are an element of todays workplace. Our 0414 Box Plots Horizontal Bar Chart Powerpoint Graph Powerpoint Templates help you meet the demand. Just browse and pick the slides that appeal to your intuitive senses. Our 0414 Box Plots Horizontal Bar Chart Powerpoint Graph Powerpoint Templates will help you be quick off the draw. Just enter your specific text and see your points hit home.
-
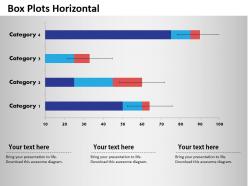 0414 box plots horizontal business bar chart powerpoint graph
Download is brisk and can be simply inserted in the presentation. Presentation template comes in standard and widescreen view. PowerPoint slide created with high quality resolution design. Entirely adaptable design as color, text and font can be edited with ease. Downloadable with different nodes and stages. Easy to transform the PPT slide into JPEG and PDF document. Useful for social media, mobile technology, business communication information.
-
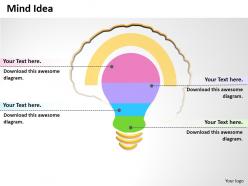 0414 brainwriting idea bar chart powerpoint graph
Fully editable PowerPoint design. Professional use of colors and shapes. Great in picture and pixel quality. PPT template can be shown in standard and widescreen view. Presentation slide is fully editable to allow customization for font, text, colors, etc. Simple to download and convert into PDF format. Compatible with software options such as JPEG and PDF. Valuable for technology administrators, professionals, software engineering team, IT executives etc.
-
 0414 brilliant idea bar chart illustration powerpoint graph
Skillful use of colors and shapes. Presentation design can be presented in standard and widescreen view. Great in picture and pixel quality. PPT slide friendly with Google slides. PowerPoint template design is editable to allow customization with size and text. Convenient download and easy to adjust into PDF format. Friendly with software options such as JPEG and PDF. Useful for business growth, success, vision, achievement etc.
-
 0414 bulb coming out of box bar chart powerpoint graph
We are proud to present our 0414 bulb coming out of box bar chart powerpoint graph. Hit the right notes with our 0414 Bulb Coming Out Of Box Bar Chart Powerpoint Graph Powerpoint Templates. Watch your audience start singing to your tune. Walk your team through your plans using our 0414 Bulb Coming Out Of Box Bar Chart Powerpoint Graph Powerpoint Templates. See their energy levels rise as you show them the way.
-
 0414 business bag illustration bar chart powerpoint graph
We are proud to present our 0414 business bag illustration bar chart powerpoint graph. Our 0414 Business Bag Illustration Bar Chart Powerpoint Graph Powerpoint Templates are created with admirable insight. Use them and give your group a sense of your logical mind. Use our 0414 Business Bag Illustration Bar Chart Powerpoint Graph Powerpoint Templates to bullet point your ideas. See them fall into place one by one.
-
 0414 business bar chart home illustration powerpoint graph
We are proud to present our 0414 business bar chart home illustration powerpoint graph. Use our 0414 Business Bar Chart Home Illustration Powerpoint Graph Powerpoint Templates to weave a web of your great ideas. They are guaranteed to attract even the most critical of your colleagues. Our 0414 Business Bar Chart Home Illustration Powerpoint Graph Powerpoint Templates are designed to help you succeed. They have all the ingredients you need.
-
 0414 business team bar chart graphics powerpoint graph
PPT template can be watched in Standard and Widescreen view. Presentation slides are compatible with Google slides. Immediate download and sharing. PowerPoint design can be easily modified such as colors, visuals, text, etc. Adaptable template slide as can be converted into JPEG and PDF document. Perfect for marketing managers, sales executives, directors, teachers, etc.
-
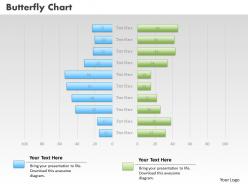 0414 butterfly bar chart business illustartion powerpoint graph
You can use slide fluently on all software. Rapid transformation to JPG and PDF formats. Highly compatible with Google slides for easy and shared information access. Widescreen viewing without PPT graphics pixelation. Add company logo, name and trademark for specificity. Editable layout with the option to alter features like font, text, color and design. High resolution PPT graphics for better clarity. Usable in businesses, small and large, startups, project management, strategic firms, quality assurance departments, government offices and educational institutes.
-
 0414 column chart business data illustration powerpoint graph
Slide runs quite fluently with all software. Fast download of PPT templates. Include your company logo, name or trademark with no issues. PPT graphics pixelation does not occur once slide viewed on widescreen. Compatibility with google slides for quick processing and information sharing. Coherently display titles and subtitles with no space constraints. Extremely customizable layout including font, text, color and design. High resolution PPT slides for clarity.
-
 0414 column chart human body illustration powerpoint graph
PowerPoint images are fully compatible with Google slides. Simple data entry of company logo, trademark or name. Quick downloading speed and formats can be altered to JPEG and PDF. Make changes in presentation slide font, text, color and design as per your way. Share information with entrepreneurs, corporate users and marketing professionals. High resolution based theme, does not vary in size even when projected on large screen.
-
 0414 column chart in thermometer style powerpoint graph
PowerPoint infographic fully adaptable with Google slides. Adaptable to wide screen view without the problem of pixilation. Modifiable color, text and font as per the trade requirement. Easy to download and can be turned into JPG and PDF format. Accessibility of addition of logo and trademarks for personalization. Awesome use of colors and innovatively designed. Corresponding designs accessible with different nodes and stages.
-
 0414 doubtful man bar chart illustration powerpoint graph
Completely editable PPT slide including fonts, visuals, text, colors, etc. Compatible with number of software options. Excellence in picture quality. Slides can be easily inserted in an ongoing presentation. Beneficial for investors, shareholders, financiers, professors, students, marketers, sales people, etc. Presentation design can be displayed in standard and widescreen view. Personalize the presentation with individual company name and logo.
-
 0414 home graphics business bar chart powerpoint graph
Fast and easy to download in quick steps. Add text as per context. Presentation icons with fully modifiable color and contrast as per your need. Change orientation and sizes of PPT infographics according to need. No change in resolution on editing and no pixelation on wide screen projection. Ideal for real estate developers, infrastructure firms, portfolio managers etc.
-
 0414 human brain bar chart illustration powerpoint graph
Instantaneous download at your fingertips. Totally modifiable orientation and sizes of PPT images to your liking. Change color scheme and contrast as per need. No pixelation of PPT infographics on wide screen projection. Works seamlessly with any software. Add text to suit the context of your presentation. Easily convertible to JPG or PDF and runs smoothly with Google slides.
-
 0414 human brain with an idea bar chart powerpoint graph
Simple and straightforward download without any hassles. Totally modifiable color scheme and contrast of high resolution PPT icons. Add text of any word length as per need. Change orientation and sizes of PPT images to your liking. Insert your brand name, trademark, company name, tagline, logo etc. Works seamlessly with Google slides and runs with other software too.
-
 0414 human face dollar bar chart powerpoint graph
We are proud to present our 0414 human face dollar bar chart powerpoint graph. Illuminate the road ahead withour Human Face Dollar Bar Chart Powerpoint Graph Powerpoint Templates. Pinpoint the important landmarks along the way. Blaze a trail with our innovative Human Face Dollar Bar Chart Powerpoint Graph Powerpoint Templates. Clearly mark the path for others to follow.
-
 0414 human head ratio bar chart powerpoint graph
Supreme quality PPT presentation layouts. Equipped with high-resolution images and patterns to impress the viewers. Maintains the speed and consistency of the system. Well matched framework with Google. Runs smoothly with all software’s. Downloads easily without any hurdles. Provides error free performance and wraps the presentation session on the scheduled time frame.
-
 0414 illustration of suitcase bar chart powerpoint graph
We are proud to present our 0414 illustration of suitcase bar chart powerpoint graph. Our Illustration Of Suitcase Bar Chart Powerpoint Graph Powerpoint Templates are the essential beat of your lilting melody. Adorn them with your tuneful thoughts and top the charts. Our Illustration Of Suitcase Bar Chart Powerpoint Graph Powerpoint Templates give you a court to play on. Dribble your way along and score a goal.
-
 0414 innovative brain idea bar chart powerpoint graph
We are proud to present our 0414 innovative brain idea bar chart powerpoint graph. Whatever the nuance you want to project. We have a Innovative Brain Idea Bar Chart Powerpoint Graph Powerpoint Templates that will get it across. Create a connection with your audience using our Innovative Brain Idea Bar Chart Powerpoint Graph Powerpoint Templates. Transfer your depth of knowledge clearly across to them.
-
 0414 interactive data driven bar chart powerpoint graph
We are proud to present our 0414 interactive data driven bar chart powerpoint graph. Our Interactive Data Driven Bar Chart Powerpoint Graph Powerpoint Templates provide the links in your chain of thought. Once intertwined they enhance the strength of your words. Our Interactive Data Driven Bar Chart Powerpoint Graph Powerpoint Templates are like ingredients in your recipe of sucess. Stir them together and get people licking their lips.
-
 0414 lock icon business bar chart powerpoint graph
We are proud to present our 0414 lock icon business bar chart powerpoint graph. You have all the ingredients to create the taste of sucess. Garnish your recipe with our Lock Icon Business Bar Chart Powerpoint Graph Powerpoint Templates and enhance its flavour. Our Lock Icon Business Bar Chart Powerpoint Graph Powerpoint Templates are created by innovative young minds. Gauranteed to fit presentations of all kinds.
-
 0414 messeage icon with bar chart powerpoint graph
These are the astounding PowerPoint graphics which also have an immensely delineated PPT design visual narratives. All the contents, symbols, formats of this PowerPoint Image are fully alterable. These PPT designs are descriptive with an elasticity to restore the statistics and very advantageous for the professionals from trade sector. They have a smooth and simple downloading procedure. They are well compatible with all Google slides and other Operating systems.
-
 0414 mobile bar graph column chart powerpoint graph
Cogently abstracted Presentation graphics makes it easy to interpret the related notion , Refine able matrix charts, designs, style, pattern, size of the PowerPoint images, An exclusive tool perfect for business managers, specialist, experts ,researchers and scholars etc. , PowerPoint slides can be easily exportable to various configurations like PDF or JPG. Easy to insert company logo or trademark, Option to add subsequent caption or subheadings also, well versed with Google slides and other programs.
-
 0414 percentage profit growth column chart powerpoint graph
All images are 100% editable in the presentation design. Changing the color, size and orientation of any icon to your liking is manageable in presentation slide. PPT design supports the best graphic features; icon list can be re arranged according to the requirement. Smooth animations, transitions and movement of objects across the slide. Beneficial by businessmen in marketing, service and sales departments and students.
-
Excellent work done on template design and graphics.
-
Illustrative design with editable content. Exceptional value for money. Highly pleased with the product.
-
Colors used are bright and distinctive.
-
Awesome use of colors and designs in product templates.
-
It saves your time and decrease your efforts in half.
-
Easily Understandable slides.
-
Very unique, user-friendly presentation interface.
-
Unique research projects to present in meeting.
-
Topic best represented with attractive design.
-
Awesome presentation, really professional and easy to edit.


