- Sub Categories
-
 Project management tickets by project dashboard
Presenting this set of slides with name - Project Management Tickets By Project Dashboard. This is a six stage process. The stages in this process are Project Proposal, Project Plan, Project Management.
-
 Project management timeline task report dashboard snapshot
Introducing project management timeline task report dashboard snapshot PPT template. An easy access to make the desired changes or edit it anyways. Wide screen view of the slides. Easy conversion into Jpeg or Pdf format. The PPT images offer compatibility with Google Slides. High resolution icons for clear message delivery. Unique and informational content. Valuable for business professionals, sales representatives, marketing professionals, students and selling investigators. High quality charts and visuals used in the designing process. They enhance the performance of the presentation.
-
 Project name status schedule and management dashboard
Presenting project name status schedule and management dashboard PowerPoint template. Presentation slides are compatible with Google slides. Download is quick and can be easily shared. Conveys a sense of change over time. Suitable for corporate leaders and business associates. Flexible PPT slide as can be used whenever required. PowerPoint design can be shared in Standard and Widescreen view. High quality graphics and visuals used in the PPT. Option to include business content i.e. name, logo and text. Effortless conversion into PDF/ JPG format.
-
 Project activities resource portfolio dashboards
Pre-designed project activities resource portfolio dashboards PPT template. Beneficial for managers, professors, marketers, etc. Flexible option for conversion in PDF or JPG formats. Available in Widescreen format also. Useful for making business plan and strategies. Can also be used with Google slides. Replace the images, text and the content in the slide design. Change the size, style and orientation of the slides. Use your company’s name or brand name to make it your own presentation template.
-
 Project name cost baseline portfolio dashboards
Presenting project name cost baseline portfolio dashboards PPT template. Download is quick and can be easily shared. Conveys a sense of change over time. Suitable for corporate leaders and business associates. Flexible PPT slide as can be used whenever required. PowerPoint design can be shared in Standard and Widescreen view. High quality graphics and visuals used in the PPT. Option to include business content i.e. name, logo and text. Effortless conversion into PDF/ JPG format. Can be easily merged with your ongoing presentation slides.
-
 Project portfolio status budget dashboards
Presenting, project portfolio status budget dashboards. This PPT slide believes in delivering a pleasant and great experience to the customers and can be picked by professionals for a great experience. The color of the pie chart sections and text areas can easily be edited according to your need. This PPT slide is also agreeable with google slides and accessible in Fullscreen version. Offhand conversion into PDF/ JPG format. Simple insertion of company trade name/logo.
-
 Project portfolio status cost and performance dashboards snapshot
Presenting, project portfolio status cost and performance dashboards snapshot. This is an appealing design for project portfolio status cost and performance focused PowerPoint presentation. This PPT template can be used by experts from various backgrounds to present their ideas in a contemporary way. This slide is cooperative with google slides and after downloading you can use it in full version and insert your company's logo for your best practice. Unique thinking to mesmerize your audience. Fully editable PowerPoint colors, orientation, text, and graphics.
-
 Insurance average cost per claim and claims ratio dashboard
Presenting this set of slides with name - Insurance Average Cost Per Claim And Claims Ratio Dashboard. This is a five stage process. The stages in this process are Assurance, Surety, Insurance.
-
 Insurance claim by problem type net income ratio dashboard
Presenting this set of slides with name - Insurance Claim By Problem Type Net Income Ratio Dashboard. This is a five stage process. The stages in this process are Assurance, Surety, Insurance.
-
 Insurance claims by date and status dashboard
Presenting this set of slides with name - Insurance Claims By Date And Status Dashboard. This is a three stage process. The stages in this process are Assurance, Surety, Insurance.
-
 Insurance claims details dashboard
Presenting this set of slides with name - Insurance Claims Details Dashboard. This is a three stage process. The stages in this process are Assurance, Surety, Insurance.
-
 Insurance claims per month and customer satisfaction dashboard
Presenting this set of slides with name - Insurance Claims Per Month And Customer Satisfaction Dashboard. This is a five stage process. The stages in this process are Assurance, Surety, Insurance.
-
 Insurance key metric and claim channel dashboard
• Easy to customize. • Easy to replace any words, picture or number provided in the template with your own content and use it for presentation. • Freedom to incorporate your own company’s name and logo in the presentation for personalization. • The PPT visuals used are of high resolution. • No issue of image pixilation if projected on wide screen. • Compatibility with numerous format and software options. • Widely used by marketers, businessmen, insurance managers and educators.
-
 Insurance pay out vs revenue and claims by date dashboard
• Thoroughly editable predesigned slides. • Ease of inclusion and exclusion of slide content as per the need. • Compatibility with numerous online and offline software options. • Compatibility with multiple format options. • Impressive slide image quality. • The visuals do not infer in quality when projected on wide screen. • Freedom to personalize the content with company name, trademark and logo. • Used by marketers, entrepreneurs of various industry, students and educators.
-
 Insurance total active agents dashboard snapshot
• Multi colored beautifully designed visuals • Easy to download • Easy to customize and personalize • Ease of inclusion and exclusion of slide content as per company specific data • Thoroughly editable slides • High resolution visuals • Compatible with Google slides • Compatible with numerous forms format options available in market • Harmonious with multiple software options • Used by business analysts, insurance companies, insurance employees, and other such professionals.
-
 Insurance total claims per year and month dashboard
• Bright colors and clarity in graphics • Thoroughly editable slides • Ease of editing the slides with the help of instructions provided. • Easy to download • Comfortably customizable • Of much help to financial analysts, insurance company employees, students and teachers. • High resolution of slide visuals do not let the image pixelate when projected on wide screen • Compatible with latest software options and multiple format types.
-
 Total civilian employed population by worker class in us for 2017
Total Civilian Employed Population By Worker Class In Us For 2017. This is part of our Data and Statistics products selection, and you will need a Paid account to download the actual report with accurate data. Downloaded report will contain the actual editable graph with the actual data, an excel table with the actual data, the exact source of the data and the release date. This graph shows the distribution of US population by Male and Female 16 years and over employed from 2015 to 2017 and Forecast for 2018-2022. It covers topic Civilian Employed Population by Worker Class for region USA and is for date range 2017. Download it immediately and use it for your business.
-
 Classification of civilian employed workers 16 years and over by sex in the us for 2017
Classification Of Civilian Employed Workers 16 Years And Over By Sex In The Us For 2017. This is part of our Data and Statistics products selection, and you will need a Paid account to download the actual report with accurate data. Downloaded report will contain the actual editable graph with the actual data, an excel table with the actual data, the exact source of the data and the release date.The pie chart shows distribution of the US population by male and female 16 years and over employed for 2017 into Private for profit wage and salary workers, Private not for profit wage and salary workers, Local government workers State government workers Federal government workers Self employed in own not incorporated business workers and unpaid family workers. It covers topic Civilian Employed Workers by Sex for region USA and is for date range 2017. Download it immediately and use it for your business.
-
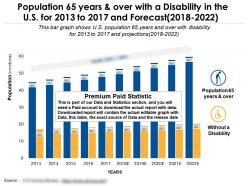 Population 65 years and over with a disability in the us for 2013 to 2017 and forecast 2018-2022
Population 65 Years And Over With A Disability In The Us For 2013 To 2017 And Forecast 2018 to 2022. This is part of our Data and Statistics products selection, and you will need a Paid account to download the actual report with accurate data. Downloaded report will contain the actual editable graph with the actual data, an excel table with the actual data the exact source of the data and the release date.This bar graph shows US population 65 years and over with disability for 2013 to 2017 and projections 2018 to 2022. It covers topic 65 and Above Population Disability Status for region USA and is for date range 2013 to 2022. Download it immediately and use it for your business.
-
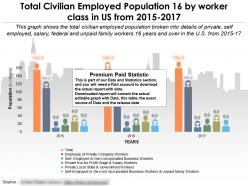 Total civilian employed population 16 by worker class in us from 2015-2017
Presenting this set of slides with name - Total Civilian Employed Population 16 By Worker Class In US From 2015-2017. Total Civilian Employed Population 16 By Worker Class In Us From 2015 to 2017. This is part of our Data and Statistics products selection, and you will need a Paid account to download the actual report with accurate data. Downloaded report will contain the actual editable graph with the actual data, an excel table with the actual data the exact source of the data and the release date. This graph shows the total civilian employed population broken into details of private self employed salary federal and unpaid family workers 16 years and over in the US from 2015 to 17. It covers topic Civilian Employed Population by Worker Class for region USA and is for date range 2015 to 17. Download it immediately and use it for your business.
-
 Total civilian employed population by sex in the us from 2015-2022 and forecasts for 2018-2022
Presenting this set of slides with name - Total Civilian Employed Population By Sex In The US From 2015-2022 And Forecasts For 2018-2022. Total Civilian Employed Population By Sex In The Us From 2015 to 2022 And Forecasts For 2018 to 2022. This is part of our Data and Statistics products selection, and you will need a Paid account to download the actual report with accurate data. Downloaded report will contain the actual editable graph with the actual data, an excel table with the actual data, the exact source of the data and the release date. This graph shows the distribution of Total Civilian Employed Population 16 years and over by Male and Female in the US from 2015 to 17 and estimations for 2018 to 2022 . It covers topic Civilian Employed Population by Sex for region USA and is for date range 2015 to 2022. Download it immediately and use it for your business.
-
 Total estimates for different population categories in the us for the year 2014-2023
Total Estimates for Different Population Categories in the U.S. for the Year 2014 to 2017 and Estimates for 2019 to 2023. This is part of our Data and Statistics products selection, and you will need a Paid account to download the actual report with accurate data. Downloaded report will contain the actual editable graph with the actual data, an excel table with the actual data, the exact source of the data and the release date. This table shows the total estimates for different population categories in the U.S. for the year 2014 to 2017 and forecasts for 2018 to 2023. It covers topic Estimates for population categories for region USA and is for date range 2014 to 23. Download it immediately and use it for your business.
-
 Total civilian employed population 16 years and over in the us from 2015-2023
Total Civilian Employed Population 16 Years And Over In The Us From 2015 to 2017 And Forecasts For 2018 to 2023. This is part of our Data and Statistics products selection, and you will need a Paid account to download the actual report with accurate data. Downloaded report will contain the actual editable graph with the actual data an excel table with the actual data the exact source of the data and the release date. This graph shows the total distribution of Civilian Employed population 16 years and over in the US from 2015 to 2017 and estimation for 2018 to 2023 . It covers topic Civilian Employed Population by Sex for region USA and is for date range 2015 to 2023. Download it immediately and use it for your business.
-
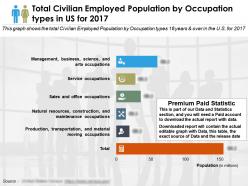 Total civilian employed population by occupation types in us for 2017
Total Civilian Employed Population By Occupation Types In Us For 2017. This is part of our Data and Statistics products selection, and you will need a Paid account to download the actual report with accurate data. Downloaded report will contain the actual editable graph with the actual data, an excel table with the actual data, the exact source of the data and the release date. This graph shows the total Civilian Employed Population by Occupation types 16 years and over in the US for 2017 . It covers topic Occupation Types for Civilian Employed Population by Age Group 16yrs And Over for region USA and is for date range 2017. Download it immediately and use it for your business.
-
 Resistance to change ppt powerpoint presentation file layouts
This is a nine stages process. The stages in this process are Finance, Marketing, Management, Investment, Analysis.
-
 Resistance to change ppt powerpoint presentation file model
This is a nine stages process. The stages in this process are Finance, Marketing, Management, Investment, Analysis.
-
 Scatter bubble chart finance ppt powerpoint presentation file graphics
This is a three stages process. The stages in this process are Finance, Marketing, Management, Investment, Analysis.
-
 Combo chart finance ppt powerpoint presentation file infographics
This is a three stages process. The stages in this process are Finance, Marketing, Management, Investment, Analysis.
-
 Resistance to change lack of existing commitmen ppt powerpoint presentation file background
This is a nine stages process. The stages in this process are Finance, Marketing, Management, Investment, Analysis.
-
 Resistance to change ppt powerpoint presentation file visual aids
This is a nine stages process. The stages in this process are Finance, Marketing, Management, Investment, Analysis.
-
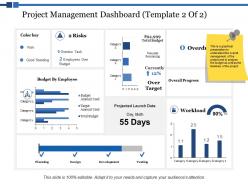 Project management dashboard risks ppt powerpoint presentation styles outfit
This is a threee stages process. The stages in this process are Finance, Marketing, Management, Investment, Analysis.
-
 Column chart finance ppt powerpoint presentation file professional
This is a two stages process. The stages in this process are Finance, Marketing, Management, Investment, Analysis.
-
 Results ppt powerpoint presentation file designs
This is a seven stages process. The stages in this process are Finance, Marketing, Management, Investment, Analysis.
-
 Clustered bar finance ppt powerpoint presentation diagram templates
This is a three stages process. The Stages in this process are Finance, Marketing, Management, Investment, Analysis.
-
 Stacked area clustered column ppt powerpoint presentation file infographics
This is a three stages process. The Stages in this process are Finance, Marketing, Management, Investment, Analysis.
-
 Combo chart finance ppt powerpoint presentation file example file
This is a three stages process. The stages in this process are Finance, Marketing, Management, Investment, Analy.
-
 Results ppt powerpoint presentation file pictures
This is a seven stages process. The stages in this process are Finance, Marketing, Management, Investment, Analysis.
-
 Volume open high low close chart ppt powerpoint presentation file portfolio
This is a two stages process. The stages in this process are Finance, Marketing, Management, Investment, Analysis.
-
 Stacked column chart finance ppt powerpoint presentation file design ideas
This is a three stages process. The stages in this process are Finance, Marketing, Management, Investment, Analysis.
-
 Stacked bar finance ppt powerpoint presentation gallery model
This is a three stages process. The stages in this process are Finance, Marketing, Management, Investment, Analysis.
-
 Clustered column line ppt visual aids professional
This is a three stage process. The stages in this process are Clustered Column Line, Finance, Marketing, Strategy, Business.
-
 Stacked bar financial analysis ppt visual aids infographic template
This is a three stage process. The stages in this process are Stacked Bar, Finance, Marketing, Strategy, Business.
-
 Combo chart financial growth ppt file graphics template
This is a two stage process. The stages in this process are Combo Chart, Finance, Marketing, Strategy, Analysis.
-
 Comparison male female ppt pictures design templates
This is a two stage process. The stages in this process are Finance, Analysis, Business, Investment, Marketing.
-
 Stacked bar finance ppt infographics example introduction
This is a three stage process. The stages in this process are Finance, Analysis, Business, Investment, Marketing.
-
 Column chart ppt infographic template backgrounds
This is a three stage process. The stage in this process are Business, Management, Marketing, Sales, Strategy.
-
 Clustered column - line ppt summary example topics
This is a three stage process. The stage in this process are Business, Management, Marketing, Sales, Financial.
-
 Combo chart ppt pictures example topics
This is a three stage process. The stage in this process are Business, Management, Strategy, Sales, Marketing.
-
 Bar chart ppt show design templates
This is a two stage process. The stage in this process are Business, Management, Strategy, Sales, Marketing.
-
 Combo chart ppt show infographic template
This is a three stage process. The stage in this process are Business, Management, Strategy, Sales, Marketing.
-
 Competitor positioning ppt professional structure
This is a two stage process. The stage in this process are Business, Management, Strategy, Sales, Marketing.
-
 Volume high low close chart ppt professional design templates
This is a five stage process. The stage in this process are Business, Management, Strategy, Analysis, Marketing.
-
 Bar chart ppt visual aids infographic template
This is a three stage process. The stages in this process are Product, Percentage, Business, Management, Marketing.
-
 Stock chart ppt styles designs download
This is a two stage process. The stages in this process are Product, Percentage, Business, Management, Marketing.
-
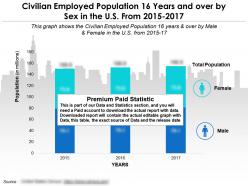 Civilian employed population 16 years and over by sex in the us from 2015-2017
Total Civilian Employed Population 16 years and over by sex male female in the US from 2015 to 2017. This is part of our Data and Statistics products selection, and you will need a Paid account to download the actual report with accurate data. Downloaded report will contain the actual editable graph with the actual data, an excel table with the actual data, the exact source of the data and the release date.This graph shows the Civilian Employed Population 16 years and over by Male and Female in the U.S. from 2015 to 17. It covers topic Civilian Employed Population categorized by sex and occupation for region USA and is for date range 2015 to 2017. Download it immediately and use it for your business.
-
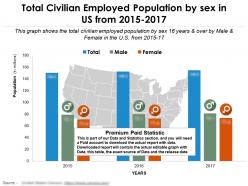 Total civilian employed population by sex in us from 2015-2017
Total Civilian Employed Population by sex in US from 2015 to 2017. This is part of our Data and Statistics products selection, and you will need a Paid account to download the actual report with accurate data. Downloaded report will contain the actual editable graph with the actual data, an excel table with the actual data, the exact source of the data and the release date.This table shows the total civilian employed population by sex 16 Years And Over by Male and Female in the U.S. from 2015 to 17. It covers topic Civilian Employed Population by Sex for region USA and is for date range 2015 to 2017. Download it immediately and use it for your business.
-
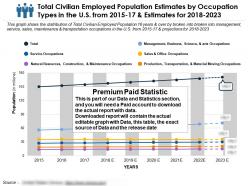 Total civilian employed population estimates by occupation types in the us from 2015-2023
Total Civilian Employed Population estimates by occupation types in the US from 2015 to 17 and estimates for 2018 to 2023. This is part of our Data and Statistics products selection, and you will need a Paid account to download the actual report with accurate data. Downloaded report will contain the actual editable graph with the actual data, an excel table with the actual data, the exact source of the data and the release date. This graph shows the distribution of Total Civilian Employed Population 16 years and over by broken into broken into management, service, sales, maintenance and transportation occupations in the U.S. from 2015 to 17 and projections for 2018 to 2023. It covers topic Occupation Types for Civilian Employed Population for region USA and is for date range 2015 to 2023. Download it immediately and use it for your business.
-
 Total civilian employed population estimates in us from 2015-2017 and forecasts for 2018-2023
Total Civilian Employed Population estimates in US from 2015 to 2017 and forecasts for 2018 to 2023. This is part of our Data and Statistics products selection, and you will need a Paid account to download the actual report with accurate data. Downloaded report will contain the actual editable graph with the actual data, an excel table with the actual data, the exact source of the data and the release date. This graph shows the total distribution of Civilian Employed Population 16 years and over in the U.S. from 2015 to 17 and estimations for 2018 to 2023. It covers topic Civilian Employed Population by Age for region USA and is for date range 2015 to 23. Download it immediately and use it for your business.
-
 Total civilian employed population years and over in the us 16 from 2015-2017 and forecasts for 2018-2023
Total Civilian employed population 16 years and over in the US from 2015 to 2017 and Forecasts for 2018 to 2023. This is part of our Data and Statistics products selection, and you will need a Paid account to download the actual report with accurate data. Downloaded report will contain the actual editable graph with the actual data, an excel table with the actual data, the exact source of the data and the release date. This graph shows the total distribution of Civilian Employed population 16 years and over by male and female in the U.S. from 2015 to 2017 and estimation for 2018 to 2023. It covers topic Civilian Employed population by Sex for region USA and is for date range 2015 to 23. Download it immediately and use it for your business.
-
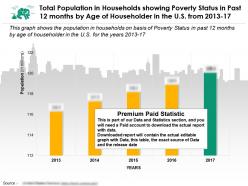 Total population in households showing poverty status in past 12 months by age of householder in us from 2013-17
otal Population in Households showing Poverty Status in Past 12 months by Age of Householder in the US from 2013 to 17. This is part of our Data and Statistics products selection, and you will need a Paid account to download the actual report with accurate data. Downloaded report will contain the actual editable graph with the actual data, an excel table with the actual data, the exact source of the data and the release date. This graph shows the population in households on basis of Poverty Status in past 12 months by age of householder in the U.S. for the years 2013 to 17. It covers topic Households Population with Poverty Status by Age Groups for region USA and is for date range 2013 to 2017. Download it immediately and use it for your business.
No Reviews


