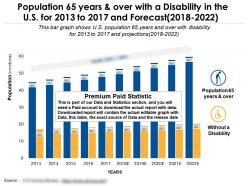
Population 65 years and over with a disability in the us for 2013 to 2017 and forecast 2018-2022
Stylish, modern designs for every presentation are on hand. Choose the one needed to make your project bulletproof.
You must be logged in to download this presentation.
 Impress your
 audience
Editable
of Time
PowerPoint presentation slides
Population 65 Years And Over With A Disability In The Us For 2013 To 2017 And Forecast 2018 to 2022. This is part of our Data and Statistics products selection, and you will need a Paid account to download the actual report with accurate data. Downloaded report will contain the actual editable graph with the actual data, an excel table with the actual data the exact source of the data and the release date.This bar graph shows US population 65 years and over with disability for 2013 to 2017 and projections 2018 to 2022. It covers topic 65 and Above Population Disability Status for region USA and is for date range 2013 to 2022. Download it immediately and use it for your business.
People who downloaded this PowerPoint presentation also viewed the following :
Population 65 years and over with a disability in the us for 2013 to 2017 and forecast 2018-2022 with all 3 slides:
Convert the intolerant with our Population 65 Years And Over With A Disability In The Us For 2013 To 2017 And Forecast 2018-2022. Encourage them to embrace humanity.
No Reviews


