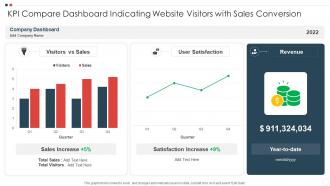
Website Analytics KPI Dashboard, Metrics PPT Templates
-
 Analytics kpi for average group members groups joined user comments powerpoint slide
Presenting analytics kpi for average group members groups joined user comments powerpoint slide. This presentation slide shows three Key Performance Indicators or KPIs in a Dashboard style design. The first KPI that can be shown is Average Number of Group Members. The second KPI is Average Number of Groups That Member Joined and the third is Average Comments User. These KPI Powerpoint graphics are all data driven, and the shape automatically adjusts according to your data. Just right click on the KPI graphic, enter the right value and the shape will adjust automatically. Make a visual impact with our KPI slides.
-
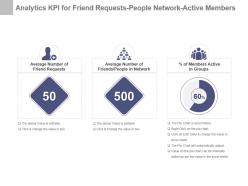 Analytics kpi for friend requests people network active members ppt slide
Presenting analytics kpi for friend requests people network active members ppt slide. This presentation slide shows three Key Performance Indicators or KPIs in a Dashboard style design. The first KPI that can be shown is Average Number of Friend Requests. The second KPI is Average Number of Friends People in Network and the third is percentage of Members Active in Groups. These KPI Powerpoint graphics are all data driven, and the shape automatically adjusts according to your data. Just right click on the KPI graphic, enter the right value and the shape will adjust automatically. Make a visual impact with our KPI slides.
-
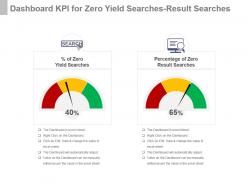 Dashboard Snapshot kpi for zero yield searches result searches presentation slide
Presenting dashboard snapshot kpi for zero yield searches result searches presentation slide. This presentation slide shows two Key Performance Indicators or KPIs in a Dashboard style design. The first KPI that can be shown is Percentage of Zero Yield Searches. The second KPI is Percentage of Zero Result Searches. These KPI Powerpoint graphics are all data driven, and the shape automatically adjusts according to your data. Just right click on the KPI graphic, enter the right value and the shape will adjust automatically. Make a visual impact with our KPI slides.
-
 E metrics kpi for average user website time conversion rate powerpoint slide
Presenting e metrics kpi for average user website time conversion rate powerpoint slide. This presentation slide shows two Key Performance Indicators or KPIs in a Dashboard style design. The first KPI that can be shown is Average Time on Website. The second KPI is Conversion Rate. These KPI Powerpoint graphics are all data driven, and the shape automatically adjusts according to your data. Just right click on the KPI graphic, enter the right value and the shape will adjust automatically. Make a visual impact with our KPI slides.
-
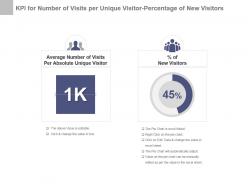 Kpi for number of visits per unique visitor percentage of new visitors ppt slide
Presenting kpi for number of visits per unique visitor percentage of new visitors ppt slide. This presentation slide shows two Key Performance Indicators or KPIs in a Dashboard style design. The first KPI that can be shown is Average Number of Visits Per Absolute Unique Visitor. The second KPI is Percentage of New Visitors. These KPI Powerpoint graphics are all data driven, and the shape automatically adjusts according to your data. Just right click on the KPI graphic, enter the right value and the shape will adjust automatically. Make a visual impact with our KPI slides.
-
 Kpi for revenue from organic search online ads website visitors presentation slide
Presenting kpi for revenue from organic search online ads website visitors presentation slide. This presentation slide shows three Key Performance Indicators or KPIs in a Dashboard style design. The first KPI that can be shown is Revenue From Organic Search Engine Traffic. The second KPI is Revenue From Online Ads and the third is Revenue Per Visit. These KPI Powerpoint graphics are all data driven, and the shape automatically adjusts according to your data. Just right click on the KPI graphic, enter the right value and the shape will adjust automatically. Make a visual impact with our KPI slides.
-
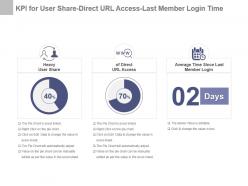 Kpi for user share direct url access last member login time powerpoint slide
Presenting kpi for user share direct url access last member login time powerpoint slide. This presentation slide shows three Key Performance Indicators or KPIs in a Dashboard style design. The first KPI that can be shown is Heavy User Share. The second KPI is of Direct URL Access and the third is Average Time Since Last Member Login. These KPI Powerpoint graphics are all data driven, and the shape automatically adjusts according to your data. Just right click on the KPI graphic, enter the right value and the shape will adjust automatically. Make a visual impact with our KPI slides.
-
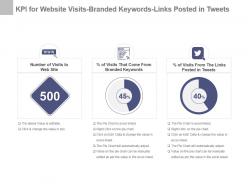 Kpi for website visits branded keywords links posted in tweets ppt slide
Presenting kpi for website visits branded keywords links posted in tweets ppt slide. This presentation slide shows three Key Performance Indicators or KPIs in a Dashboard style design. The first KPI that can be shown is Number of Visits to Web Site. The second KPI is Percentage of Visits That Come From Branded Keywords and the third is Percentage of Visits From The Links Posted in Tweets. These KPI Powerpoint graphics are all data driven, and the shape automatically adjusts according to your data. Just right click on the KPI graphic, enter the right value and the shape will adjust automatically. Make a visual impact with our KPI slides.
-
 Number of back links website success rate page reviews kpi presentation slide
Presenting number of back links website success rate page reviews kpi presentation slide. This presentation slide shows three Key Performance Indicators or KPIs in a Dashboard style design. The first KPI that can be shown is Total Number of Incoming Back Links. The second KPI is Website Success Rate and the third is Number of Page Views. These KPI Powerpoint graphics are all data driven, and the shape automatically adjusts according to your data. Just right click on the KPI graphic, enter the right value and the shape will adjust automatically. Make a visual impact with our KPI slides.
-
 Percentage dashboard snapshot kpi for canceled checkouts bounce rate powerpoint slide
Presenting percentage dashboard snapshot kpi for canceled checkouts bounce rate powerpoint slide. This presentation slide shows two Key Performance Indicators or KPIs in a Dashboard style design. The first KPI that can be shown is Percentage of Canceled Checkouts. The second KPI is Bounce Rate. These KPI Powerpoint graphics are all data driven, and the shape automatically adjusts according to your data. Just right click on the KPI graphic, enter the right value and the shape will adjust automatically. Make a visual impact with our KPI slides.
-
 Site analysis kpi for referral rss subscribers members website spent time ppt slide
Presenting site analysis kpi for referral rss subscribers members website spent time ppt slide. This presentation slide shows three Key Performance Indicators or KPIs in a Dashboard style design. The first KPI that can be shown is Referral Percentage. The second KPI is Number of RSS Subscribers and the third is Total Time Spent on Web Site By Members. These KPI Powerpoint graphics are all data driven, and the shape automatically adjusts according to your data. Just right click on the KPI graphic, enter the right value and the shape will adjust automatically. Make a visual impact with our KPI slides.
-
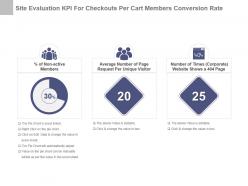 Site evaluation kpi for checkouts per cart members conversion rate presentation slide
Presenting site evaluation kpi for checkouts per cart members conversion rate presentation slide. This presentation slide shows three Key Performance Indicators or KPIs in a Dashboard style design. The first KPI that can be shown is Percentage of Non active Members. The second KPI is Average Number of Page Request Per Unique Visitor and the third is Number of Times Corporate Website Shows a 404 Page. These KPI Powerpoint graphics are all data driven, and the shape automatically adjusts according to your data. Just right click on the KPI graphic, enter the right value and the shape will adjust automatically. Make a visual impact with our KPI slides.
-
 Site review kpi for non active members page request 404 page time powerpoint slide
Presenting site review kpi for non active members page request 404 page time powerpoint slide. This presentation slide shows two Key Performance Indicators or KPIs in a Dashboard style design. The first KPI that can be shown is Checkouts Per Cart. The second KPI is Anonymous Visitors to Members Conversion Rate. These KPI Powerpoint graphics are all data driven, and the shape automatically adjusts according to your data. Just right click on the KPI graphic, enter the right value and the shape will adjust automatically. Make a visual impact with our KPI slides.
-
 Web analytics kpi for number percentage of returning visitors ppt slide
Presenting web analytics kpi for number percentage of returning visitors ppt slide. This presentation slide shows two Key Performance Indicators or KPIs in a Dashboard style design. The first KPI that can be shown is Number of Returning Visitors. The second KPI is Percentage of Returning Visitors. These KPI Powerpoint graphics are all data driven, and the shape automatically adjusts according to your data. Just right click on the KPI graphic, enter the right value and the shape will adjust automatically. Make a visual impact with our KPI slides.
-
 Web analytics kpi for page views page request single access pages presentation slide
Presenting web analytics kpi for page views page request single access pages presentation slide. This presentation slide shows three Key Performance Indicators or KPIs in a Dashboard style design. The first KPI that can be shown is Average Number of Page Views Per Visitor Session. The second KPI is Average Number of Page Request Per Visitor and the third is Number of Single Access Pages. These KPI Powerpoint graphics are all data driven, and the shape automatically adjusts according to your data. Just right click on the KPI graphic, enter the right value and the shape will adjust automatically. Make a visual impact with our KPI slides.
-
 Web management kpi for onsite search sessions number of searches powerpoint slide
Presenting web management kpi for onsite search sessions number of searches powerpoint slide. This presentation slide shows two Key Performance Indicators or KPIs in a Dashboard style design. The first KPI that can be shown is On Site Search Sessions Percentage. The second KPI is Number of Searches. These KPI Powerpoint graphics are all data driven, and the shape automatically adjusts according to your data. Just right click on the KPI graphic, enter the right value and the shape will adjust automatically. Make a visual impact with our KPI slides.
-
 Website visitors key performance indicators report ppt slide
Presenting website visitors key performance indicators report ppt slide. This presentation slide shows three Key Performance Indicators or KPIs in a Dashboard style design. The first KPI that can be shown is Number of Visitors of Web Site. The second KPI is Number of Unique Visitors of Web Site and the third is Average Time Spent on Website For Member. These KPI Powerpoint graphics are all data driven, and the shape automatically adjusts according to your data. Just right click on the KPI graphic, enter the right value and the shape will adjust automatically. Make a visual impact with our KPI slides.
-
 One website proposal template ppt slides
Presenting one website proposal template ppt slides. This is a website proposal template ppt slides. This is a eight stage process. The stages in this process are target audiences, mission statement, implementation imperatives, user experience strategy, feature and functionality, success metrics, barriers and challenges, business objectives.
-
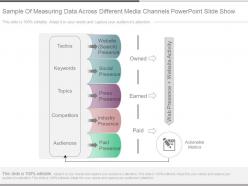 Sample of measuring data across different media channels powerpoint slide show
Presenting sample of measuring data across different media channels powerpoint slide show. This is a sample of measuring data across different media channels powerpoint slide show. This is a five stage process. The stages in this process are tactics, keywords, topics, competitors, audiences, website search presence, social presence, press presence, industry presence, paid presence, owned, earned, paid, web presence, website activity, actionable metrics.
-
 Kpi for number of feedback entries received on brand website presentation slide
Presenting kpi for number of feedback entries received on brand website presentation slide. This presentation slide shows one Key Performance Indicators or KPIs in a Dashboard style design. The first KPI that can be shown is Number of Feedback Entries on Brand Website. These KPI Powerpoint graphics are all data driven, and the shape automatically adjusts according to your data. Just right click on the KPI graphic, enter the right value and the shape will adjust automatically. Make a visual impact with our KPI slides.
-
 Social media marketing kpi for product ideas people feedback powerpoint slide
Presenting social media marketing kpi for product ideas people feedback powerpoint slide. This presentation slide shows three Key Performance Indicators or KPIs in a Dashboard style design. The first KPI that can be shown is Number of Product Ideas Submitted to Brand in an Open Online Forum. The second KPI is Number of People That Submitted Product Ideas Brand in an Open Online Forum and the third is Number of People That Provided Feedback on Brand Website. These KPI Powerpoint graphics are all data driven, and the shape automatically adjusts according to your data. Just right click on the KPI graphic, enter the right value and the shape will adjust automatically. Make a visual impact with our KPI slides.
-
 Website metrics icon ppt diagrams
Introducing website metrics PPT diagram. This PowerPoint configuration is versatile with all programming's activities and Google Slides. This Presentation slide can likewise be essentially exportable into PDF or JPG document plans. This PPT image can be shown in a bigger screen proportion with an unaffected high goals. All the PPT design highlights or features of this Presentation graphic like text, image, font size, intensity etc. is completely changeable.
-
 Key website metrics yearly comparison user session and bounce rate
Presenting this set of slides with name - Key Website Metrics Yearly Comparison User Session And Bounce Rate. This is a four stage process. The stages in this process are Differentiation, Comparison, Compare.
-
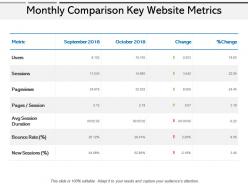 Monthly comparison key website metrics
Presenting this set of slides with name - Monthly Comparison Key Website Metrics. This is a three stages process. The stages in this process are Monthly Comparison, Monthly Compare, 30 Days Comparison.
-
 Key Revenue Pipeline Metrics For Measuring Website Contribution
Presenting this set of slides with name Key Revenue Pipeline Metrics For Measuring Website ContributionKey Revenue Pipeline Metrics For Measuring Website Contribution. This is a five stage process. The stages in this process are Key Revenue, Pipeline Metrics, Measuring Website, Contribution. This is a completely editable PowerPoint presentation and is available for immediate download. Download now and impress your audience.
-
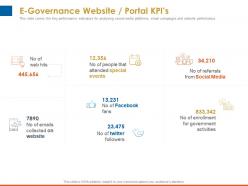 E governance website portal kpis enrollment ppt powerpoint presentation information
This slide covers the Key performance indicators for analysing social media platforms, email campaigns and website performance. Presenting this set of slides with name E Governance Website Portal Kpis Enrollment Ppt Powerpoint Presentation Information. The topics discussed in these slides are E Governance, Website Portal, Kpis Enrollment. This is a completely editable PowerPoint presentation and is available for immediate download. Download now and impress your audience.
-
 Digital government website portal kpis fans ppt powerpoint presentation professional guidelines
This slide covers the Key performance indicators for analysing social media platforms, email campaigns and website performance. Presenting this set of slides with name Digital Government Website Portal Kpis Fans Ppt Powerpoint Presentation Professional Guidelines. The topics discussed in these slides are Digital Government Website Portal KPIs. This is a completely editable PowerPoint presentation and is available for immediate download. Download now and impress your audience.
-
 Marketing strategy template 1 website ppt powerpoint presentation show inspiration
Presenting this set of slides with name Marketing Strategy Template 1 Website Ppt Powerpoint Presentation Show Inspiration. The topics discussed in these slides are Resources, Strategy, Budget, Metrics To Measure, Desired Outcome. This is a completely editable PowerPoint presentation and is available for immediate download. Download now and impress your audience.
-
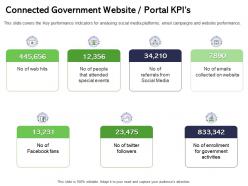 Connected government website portal kpis attended ppt powerpoint presentation icon graphic tips
This slide covers the Key performance indicators for analysing social media platforms, email campaigns and website performance. Presenting this set of slides with name Connected Government Website Portal KPIS Attended Ppt Powerpoint Presentation Icon Graphic Tips. The topics discussed in these slides are Connected Government Website Portal KPIs. This is a completely editable PowerPoint presentation and is available for immediate download. Download now and impress your audience.
-
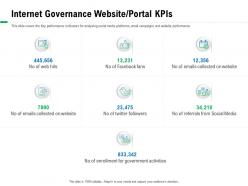 Internet governance website portal kpis web hits ppt powerpoint presentation outline pictures
This slide covers the Key performance indicators for analysing social media platforms, email campaigns and website performance. Presenting this set of slides with name Internet Governance Website Portal KPIS Web Hits Ppt Powerpoint Presentation Outline Pictures. The topics discussed in these slides are Internet Governance Website Portal KPIS. This is a completely editable PowerPoint presentation and is available for immediate download. Download now and impress your audience.
-
 E governance website portal kpis ppt powerpoint presentation portfolio deck
This slide covers the Key performance indicators for analysing social media platforms email campaigns and website performance. Presenting this set of slides with name E Governance Website Portal Kpis Ppt Powerpoint Presentation Portfolio Deck. This is a seven stage process. The stages in this process are E Governance Website Portal KPIS. This is a completely editable PowerPoint presentation and is available for immediate download. Download now and impress your audience.
-
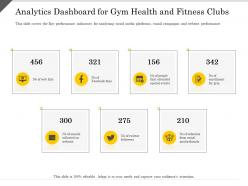 Analytics dashboard for gym health and fitness clubs performance ppt powerpoint presentation pictures
This slide covers the Key performance indicators for analysing social media platforms, email campaigns and website performance Introducing Analytics Dashboard For Gym Health And Fitness Clubs Performance Ppt Powerpoint Presentation Pictures to increase your presentation threshold. Encompassed with seven stages, this template is a great option to educate and entice your audience. Dispence information on Analytics Dashboard For Gym Health And Fitness Clubs , using this template. Grab it now to reap its full benefits.
-
 Rebranding performance metrics rebrand ppt powerpoint presentation gallery example topics
The purpose of this slide is to provide a glimpse of the rebranding performance metrics. Present the topic in a bit more detail with this Rebranding Performance Metrics Rebrand Ppt Powerpoint Presentation Gallery Example Topics. Use it as a tool for discussion and navigation on Sales, Revenue, Target, Website Visitors, Performing. This template is free to edit as deemed fit for your organization. Therefore download it now.
-
 Rebranding performance metrics rebranding approach ppt pictures
The purpose of this slide is to provide a glimpse of the rebranding performance metrics.Deliver an outstanding presentation on the topic using this Rebranding Performance Metrics Rebranding Approach Ppt Pictures. Dispense information and present a thorough explanation of Website Visitors, Target, Sales Revenue, League Table Top Performing, Production using the slides given. This template can be altered and personalized to fit your needs. It is also available for immediate download. So grab it now.
-
 Rebranding performance metrics brand upgradation ppt inspiration
The purpose of this slide is to provide a glimpse of the rebranding performance metrics.Deliver an outstanding presentation on the topic using this Rebranding Performance Metrics Brand Upgradation Ppt Inspiration. Dispense information and present a thorough explanation of League Table Top Performing, Website Visitors, Production using the slides given. This template can be altered and personalized to fit your needs. It is also available for immediate download. So grab it now.
-
 Marketing activity project plan with target and growth metrics
This slide showcase project plan for improving company website traffic and generate good amount of profit and revenue, it also includes-marketing activities, objectives, growth and financial projections Introducing our Marketing Activity Project Plan With Target And Growth Metrics set of slides. The topics discussed in these slides are Marketing Activities, Growth, Leads Generation . This is an immediately available PowerPoint presentation that can be conveniently customized. Download it and convince your audience.
-
 E governance website portal kpis electronic government processes ppt portrait
This slide covers the Key performance indicators for analysing social media platforms, email campaigns and website performance. Introducing E Governance Website Portal KPIs Electronic Government Processes Ppt Portrait to increase your presentation threshold. Encompassed with seven stages, this template is a great option to educate and entice your audience. Dispence information on Attended Special Events, Social Media, Government Activities, using this template. Grab it now to reap its full benefits.
-
 Real estate marketing dashboard marketing plan for real estate project
This template covers KPI dashboard for real estate marketing plan including website visitors, page review, top referrals, traffic sources, email campaign etc. Present the topic in a bit more detail with this Real Estate Marketing Dashboard Marketing Plan For Real Estate Project. Use it as a tool for discussion and navigation on Real Estate Marketing Dashboard. This template is free to edit as deemed fit for your organization. Therefore download it now.
-
 Explosive growth platform free hosting video website investor funding elevator
This slide caters details about explosive growth of online video hosting platform and emerging as popular video sharing platform with impressive metrics. Deliver an outstanding presentation on the topic using this Explosive Growth Platform Free Hosting Video Website Investor Funding Elevator. Dispense information and present a thorough explanation of Revenue, Lifetime, Subscriber using the slides given. This template can be altered and personalized to fit your needs. It is also available for immediate download. So grab it now.
-
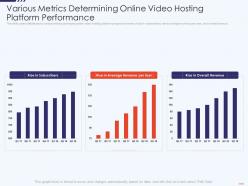 Various determining online free hosting video website investor funding elevator
This slide caters details about various metrics portraying online video hosting platform progress in terms of rise in subscribers, rise in average revenue per user, and overall revenue. Deliver an outstanding presentation on the topic using this Various Determining Online Free Hosting Video Website Investor Funding Elevator. Dispense information and present a thorough explanation of Various Metrics Determining Online Video Hosting Platform Performance using the slides given. This template can be altered and personalized to fit your needs. It is also available for immediate download. So grab it now.
-
 Real estate marketing dashboard real estate marketing plan ppt topics
This template covers KPI dashboard for real estate marketing plan including website visitors, page review, top referrals, traffic sources, email campaign etc. Deliver an outstanding presentation on the topic using this Real Estate Marketing Dashboard Real Estate Marketing Plan Ppt Topics. Dispense information and present a thorough explanation of Real Estate Marketing Dashboard using the slides given. This template can be altered and personalized to fit your needs. It is also available for immediate download. So grab it now.
-
 Real estate marketing dashboard real estate listing marketing plan ppt microsoft
This template covers KPI dashboard for real estate marketing plan including website visitors, page review, top referrals, traffic sources, email campaign etc. Deliver an outstanding presentation on the topic using this Real Estate Marketing Dashboard Real Estate Listing Marketing Plan Ppt Microsoft. Dispense information and present a thorough explanation of Real Estate Marketing Dashboard using the slides given. This template can be altered and personalized to fit your needs. It is also available for immediate download. So grab it now.
-
 Rebranding performance metrics rebranding strategies ppt structure
The purpose of this slide is to provide a glimpse of the rebranding performance metrics. Present the topic in a bit more detail with this Rebranding Performance Metrics Rebranding Strategies Ppt Structure. Use it as a tool for discussion and navigation on Website Visitors, Sales Revenue, Production, Target. This template is free to edit as deemed fit for your organization. Therefore download it now.
-
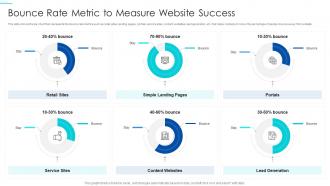 Bounce rate metric to measure website success
Presenting our well structured Bounce Rate Metric To Measure Website Success. The topics discussed in this slide are Retail Sites, Content Websites, Service Sites. This is an instantly available PowerPoint presentation that can be edited conveniently. Download it right away and captivate your audience.
-
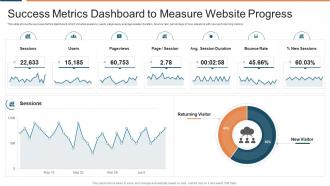 Success metrics dashboard to measure website progress
Presenting our well structured Success Metrics Dashboard To Measure Website Progress. The topics discussed in this slide are Success Metrics Dashboard To Measure Website Progress. This is an instantly available PowerPoint presentation that can be edited conveniently. Download it right away and captivate your audience.
-
 Marketing balanced scorecard online marketing balanced scorecard with website goals
Present the topic in a bit more detail with this Marketing Balanced Scorecard Online Marketing Balanced Scorecard With Website Goals. Use it as a tool for discussion and navigation on Create Awareness, Generate Leads, Highlight Events, Goal, Kpi, Target, Segments. This template is free to edit as deemed fit for your organization. Therefore download it now.
-
 Digital marketing report website metrics ppt graphics
Present the topic in a bit more detail with this Digital Marketing Report Website Metrics Ppt Graphics. Use it as a tool for discussion and navigation on Website Metrics. This template is free to edit as deemed fit for your organization. Therefore download it now.
-
 Creating marketing strategy for your organization marketing strategy website
Present the topic in a bit more detail with this Creating Marketing Strategy For Your Organization Marketing Strategy Website. Use it as a tool for discussion and navigation on Funnel, Email, Social, Metrics. This template is free to edit as deemed fit for your organization. Therefore download it now.
-
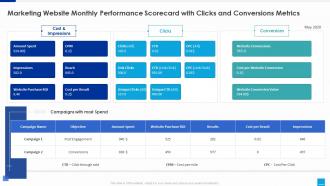 Marketing website marketing website monthly performance scorecard clicks conversions metrics
Present the topic in a bit more detail with this Marketing Website Marketing Website Monthly Performance Scorecard Clicks Conversions Metrics. Use it as a tool for discussion and navigation on Performance, Scorecard, Conversions. This template is free to edit as deemed fit for your organization. Therefore download it now.
-
 Real estate marketing dashboard ppt powerpoint presentation outline inspiration
This template covers KPI dashboard for real estate marketing plan including website visitors, page review, top referrals, traffic sources, email campaign etc. Deliver an outstanding presentation on the topic using this Real Estate Marketing Dashboard Ppt Powerpoint Presentation Outline Inspiration. Dispense information and present a thorough explanation of Real Estate Marketing Dashboard using the slides given. This template can be altered and personalized to fit your needs. It is also available for immediate download. So grab it now.
-
 Digital Marketing KPI Dashboard Snapshot With Engagement Rate
The following slide showcases a comprehensive KPI dashboard which allows the company to track the digital marketing performance. Total visits, cost per click, engagement rate, total impressions, product sales trend, revenue by various channels are some of the key metrics mentioned in the slide. Introducing our Digital Marketing KPI Dashboard Snapshot With Engagement Rate set of slides. The topics discussed in these slides are Product Sales Trend, Revenue By Channel, Top Website Referral Channels, Website Demographics, Engagement Rate, Impressions Total. This is an immediately available PowerPoint presentation that can be conveniently customized. Download it and convince your audience.
-
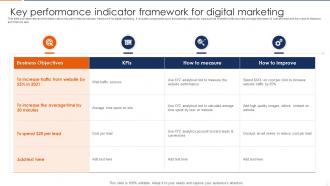 Key Performance Indicator Framework For Digital Marketing
This slide provides relevant information about key performance indicator framework for digital marketing. It includes components such as business objectives, kips such as website traffic sources, average time spent and cost per lead and the ways to measure and improve kips. Introducing our Key Performance Indicator Framework For Digital Marketing set of slides. The topics discussed in these slides are Business Objectives, Traffic Sources, Average Time. This is an immediately available PowerPoint presentation that can be conveniently customized. Download it and convince your audience.
-
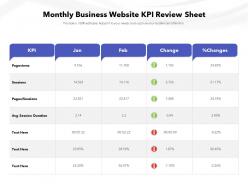
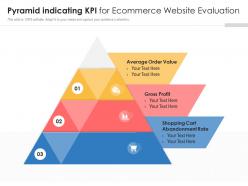
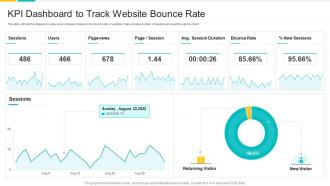
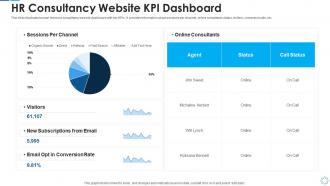
 Website Statistics Powerpoint Ppt Template Bundles
Engage buyer personas and boost brand awareness by pitching yourself using this prefabricated set. This Website Statistics Powerpoint Ppt Template Bundles is a great tool to connect with your audience as it contains high-quality content and graphics. This helps in conveying your thoughts in a well-structured manner. It also helps you attain a competitive advantage because of its unique design and aesthetics. In addition to this, you can use this PPT design to portray information and educate your audience on various topics. With sixteen slides, this is a great design to use for your upcoming presentations. Not only is it cost-effective but also easily pliable depending on your needs and requirements. As such color, font, or any other design component can be altered. It is also available for immediate download in different formats such as PNG, JPG, etc. So, without any further ado, download it now.
-
Great quality slides in rapid time.
-
Excellent work done on template design and graphics.
-
Use of icon with content is very relateable, informative and appealing.
-
Best Representation of topics, really appreciable.
-
Thanks for all your great templates they have saved me lots of time and accelerate my presentations. Great product, keep them up!
-
Unique and attractive product design.
-
Awesome presentation, really professional and easy to edit.
-
Excellent design and quick turnaround.
-
Innovative and attractive designs.
-
Easily Editable.


