Blog Performance Metrics, Dashboard PPT Templates
-
 Blogging Kpi For Flesch Reading Grade Level Blog Posts Frequency Powerpoint Slide
Presenting blogging kpi for flesch reading grade level blog posts frequency powerpoint slide. This presentation slide shows Three Key Performance Indicators or KPIs in a Dashboard style design. The first KPI that can be shown is Flesch Reading Ease. The second KPI is Flesch Kincaid Grade Level. The third is Frequency of Blog Posts. These KPI Powerpoint graphics are all data driven, and the shape automatically adjusts according to your data. Just right click on the KPI graphic, enter the right value and the shape will adjust automatically. Make a visual impact with our KPI slides.
-
 Blogging Kpi For New Blog Entries Blog Post Word Count Ppt Slide
Presenting blogging kpi for new blog entries blog post word count ppt slide. This presentation slide shows Three Key Performance Indicators or KPIs in a Dashboard style design. The first KPI that can be shown is Average Number of New Blog Entries. The second KPI is Average Comments Per Blog Post. The third is Average Word Count in Blog Post. These KPI Powerpoint graphics are all data driven, and the shape automatically adjusts according to your data. Just right click on the KPI graphic, enter the right value and the shape will adjust automatically. Make a visual impact with our KPI slides.
-
 Journal Kpi For Members Commenting Trackbacks Rss Subscribers Presentation Slide
Presenting journal kpi for members commenting trackbacks rss subscribers presentation slide. This presentation slide shows Three Key Performance Indicators or KPIs in a Dashboard style design. The first KPI that can be shown is Percentage of Unique Visitors Members Commenting. The second KPI is Average Number of Trackbacks Per Blog Post. The third is Number of RSS Subscribers. These KPI Powerpoint graphics are all data driven, and the shape automatically adjusts according to your data. Just right click on the KPI graphic, enter the right value and the shape will adjust automatically. Make a visual impact with our KPI slides.
-
 Kpi For Word Count Comments Thread Length New Commentators Powerpoint Slide
Presenting kpi for word count comments thread length new commentators powerpoint slide. This presentation slide shows Three Key Performance Indicators or KPIs in a Dashboard style design. The first KPI that can be shown is Average Word Count of Comments. The second KPI is Average Thread Length in Comments. The third is Percentage of New Commentators. These KPI Powerpoint graphics are all data driven, and the shape automatically adjusts according to your data. Just right click on the KPI graphic, enter the right value and the shape will adjust automatically. Make a visual impact with our KPI slides.
-
 New Visitors Number Of Commentators Returning Visitors Blogging Kpi Ppt Slide
Presenting new visitors number of commentators returning visitors blogging kpi ppt slide. This presentation slide shows Three Key Performance Indicators or KPIs in a Dashboard style design. The first KPI that can be shown is Average New Visitors Per Blog Post. The second KPI is Number of Commentators. The third is Average Returning Visitors Per Blog Post. These KPI Powerpoint graphics are all data driven, and the shape automatically adjusts according to your data. Just right click on the KPI graphic, enter the right value and the shape will adjust automatically. Make a visual impact with our KPI slides.
-
 Metrics To Measure Content Marketing Effectiveness
This slide represents metrics to measure content marketing effectiveness, illustrating metrics such as blog traffic, email subscription, conversion rate, social media, and SEO performance. Introducing our Metrics To Measure Content Marketing Effectiveness set of slides. The topics discussed in these slides are Conversion Rate, Social Media, SEO Performance. This is an immediately available PowerPoint presentation that can be conveniently customized. Download it and convince your audience.
-
 Monthly KPI Tracker To Measure Content Marketing Success
The following slide illustrates KPI tracking sheet to measure content marketing effectiveness. It provides information about brand awareness, engagement, page views, app downloads, blog comments, etc. Presenting our well structured Monthly KPI Tracker To Measure Content Marketing Success. The topics discussed in this slide are Social Media Handle, Metrics To Measure, Marketing Success. This is an instantly available PowerPoint presentation that can be edited conveniently. Download it right away and captivate your audience.
-
 F558 Dashboard For Tracking Digital Content Performance Customer Touchpoint Plan To Enhance Buyer Journey
This slide covers the KPI dashboard for analyzing online content. It includes metrics such as blog visitors, pageviews, newsletter conversion rate, new signups, new customers, etc. S. Present the topic in a bit more detail with this F558 Dashboard For Tracking Digital Content Performance Customer Touchpoint Plan To Enhance Buyer Journey. Use it as a tool for discussion and navigation on Performance, Dashboard, Analyzing. This template is free to edit as deemed fit for your organization. Therefore download it now.
-
 F552 Dashboard For Tracking Digital Content Performance Customer Touchpoint Guide To Improve User Experience
This slide covers the KPI dashboard for analyzing online content. It includes metrics such as blog visitors, pageviews, newsletter conversion rate, new signups, new customers, etc. Present the topic in a bit more detail with this F552 Dashboard For Tracking Digital Content Performance Customer Touchpoint Guide To Improve User Experience. Use it as a tool for discussion and navigation on Performance, Dashboard, Pageviews. This template is free to edit as deemed fit for your organization. Therefore download it now.
-
 Content Auditing Process For Website Visibility Improvement
This slide showcases website content auditing process that can help in evaluation the blogs quality and restucture them to improve the search engine visibility. Its key steps are document goals, organize and tage content, define metrics, rum action plan and analyze results. Introducing our premium set of slides with Content Auditing Process For Website Visibility Improvement. Elucidate the five stages and present information using this PPT slide. This is a completely adaptable PowerPoint template design that can be used to interpret topics like Goals, Success Metrics, Action Plan, Analyze Results. So download instantly and tailor it with your information.
-
 Dashboard For Tracking Digital Content Performance Customer Journey Touchpoint Mapping Strategy
This slide covers the KPI dashboard for analyzing online content. It includes metrics such as blog visitors, pageviews, newsletter conversion rate, new signups, new customers, etc. Present the topic in a bit more detail with this Dashboard For Tracking Digital Content Performance Customer Journey Touchpoint Mapping Strategy. Use it as a tool for discussion and navigation on Dashboard For Tracking, Digital Content Performance. This template is free to edit as deemed fit for your organization. Therefore download it now.
-
 Identifying And Optimizing Customer Touchpoints Dashboard For Tracking Digital Content Performance
This slide covers the KPI dashboard for analyzing online content. It includes metrics such as blog visitors, pageviews, newsletter conversion rate, new signups, new customers, etc. Deliver an outstanding presentation on the topic using this Identifying And Optimizing Customer Touchpoints Dashboard For Tracking Digital Content Performance. Dispense information and present a thorough explanation of Dashboard For Tracking, Digital Content Performance using the slides given. This template can be altered and personalized to fit your needs. It is also available for immediate download. So grab it now.
-
 Dashboard For Tracking Digital Content Performance Digital Consumer Touchpoint Strategy
This slide covers the KPI dashboard for analyzing online content. It includes metrics such as blog visitors, pageviews, newsletter conversion rate, new signups, new customers, etc. Deliver an outstanding presentation on the topic using this Dashboard For Tracking Digital Content Performance Digital Consumer Touchpoint Strategy. Dispense information and present a thorough explanation of Dashboard For Tracking, Digital Content Performance using the slides given. This template can be altered and personalized to fit your needs. It is also available for immediate download. So grab it now.
-
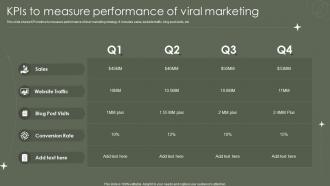
 Kpis To Measure Performance Of Viral Marketing
This slide shows KPI metrics to measure performance of viral marketing strategy. It includes sales, website traffic, blog post visits, etc. Presenting our well structured Kpis To Measure Performance Of Viral Marketing. The topics discussed in this slide are Measure, Performance, Marketing. This is an instantly available PowerPoint presentation that can be edited conveniently. Download it right away and captivate your audience.
-
 Digital Marketing Analytics Performance Report
This slide shows the digital marketing analytics performance report such as social media, blog and public relation performance with website health. Introducing our Digital Marketing Analytics Performance Report set of slides. The topics discussed in these slides are Social Media Performance, Website Health, Blog Performance. This is an immediately available PowerPoint presentation that can be conveniently customized. Download it and convince your audience.
-
 Brand Followers Kpi On Social Networks Microblogging Site Focused Groups Ppt Slide
Presenting brand followers kpi on social networks microblogging site focused groups ppt slide. This presentation slide shows three Key Performance Indicators or KPIs in a Dashboard style design. The first KPI that can be shown is Number of Followers of Brand on Social Networks. The second KPI is Number of Followers of Brand on Micro Blogging Site and the third is Number of People That Joined Groups Focused on Brand. These KPI Powerpoint graphics are all data driven, and the shape automatically adjusts according to your data. Just right click on the KPI graphic, enter the right value and the shape will adjust automatically. Make a visual impact with our KPI slides.
-
 Web Marketing Kpi For Online Videos Microblogs Post Brand Pictures Presentation Slide
Presenting web marketing kpi for online videos microblogs post brand pictures presentation slide. This presentation slide shows three Key Performance Indicators or KPIs in a Dashboard style design. The first KPI that can be shown is Number Of Videos Posted Online About Brand. The second KPI is Number Micro blogs Posted About Brand and the third is Number Pictures Posted Focused on Brand. These KPI Powerpoint graphics are all data driven, and the shape automatically adjusts according to your data. Just right click on the KPI graphic, enter the right value and the shape will adjust automatically. Make a visual impact with our KPI slides.
-
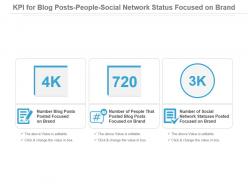
 Kpi For Blog Posts People Social Network Status Focused On Brand Powerpoint Slide
Presenting kpi for blog posts people social network status focused on brand powerpoint slide. This presentation slide shows three Key Performance Indicators or KPIs in a Dashboard style design. The first KPI that can be shown is Number Blog Posts Posted Focused on Brand. The second KPI is Number of People That Posted Blog Posts Focused on Brand and the third is Number of Social Network Statuses Posted Focused on Brand. These KPI Powerpoint graphics are all data driven, and the shape automatically adjusts according to your data. Just right click on the KPI graphic, enter the right value and the shape will adjust automatically. Make a visual impact with our KPI slides.
-
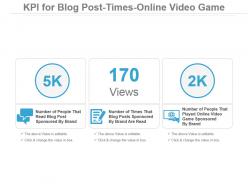
 Kpi For Blog Post Times Online Video Game Ppt Slide
Presenting kpi for blog post times online video game ppt slide. This presentation slide shows three Key Performance Indicators or KPIs in a Dashboard style design. The first KPI that can be shown is Number of People That Read Blog Post Sponsored By Brand. The second KPI is Number of Times That Blog Posts Sponsored By Brand Are Read and the third is Number of People That Played Online Video Game Sponsored By Brand. These KPI Powerpoint graphics are all data driven, and the shape automatically adjusts according to your data. Just right click on the KPI graphic, enter the right value and the shape will adjust automatically. Make a visual impact with our KPI slides.
-
 Branding Kpi For Micro Blog Post Social Network Brand Survey Presentation Slide
Presenting branding kpi for micro blog post social network brand survey presentation slide. This presentation slide shows three Key Performance Indicators or KPIs in a Dashboard style design. The first KPI that can be shown is Number of People That Posted a Micro Blog About Brand. The second KPI is Number of People That Posted Social Network Status Focused on Brand and the third is Number of People That Joined Online Panel or Survey For Brand. These KPI Powerpoint graphics are all data driven, and the shape automatically adjusts according to your data. Just right click on the KPI graphic, enter the right value and the shape will adjust automatically. Make a visual impact with our KPI slides.
-
Unique design & color.
-
Thanks for all your great templates they have saved me lots of time and accelerate my presentations. Great product, keep them up!
-
Easy to edit slides with easy to understand instructions.
-
Visually stunning presentation, love the content.
-
Topic best represented with attractive design.
-
Unique research projects to present in meeting.
-
Topic best represented with attractive design.
-
Awesomely designed templates, Easy to understand.
-
Content of slide is easy to understand and edit.
-
Awesome presentation, really professional and easy to edit.


