Warehouse KPI Dashboard, Excel, Metrics PowerPoint Templates
-
 Warehousing kpi for inbound volumes storage capacity utilization rate ppt slide
Presenting warehousing kpi for inbound volumes storage capacity utilization rate ppt slide. This presentation slide shows Two Key Performance Indicators or KPIs in a Dashboard style design. The first KPI that can be shown is Inbound Volume Received. The second KPI is Storage Capacity Utilization Rate. These KPI Powerpoint graphics are all data driven, and the shape automatically adjusts according to your data. Just right click on the KPI graphic, enter the right value and the shape will adjust automatically. Make a visual impact with our KPI slides.
-
 Warehouse kpi for picked items completed orders correct orders presentation slide
Presenting warehouse kpi for picked items completed orders correct orders presentation slide. This presentation slide shows Three Key Performance Indicators or KPIs in a Dashboard style design. The first KPI that can be shown is Number of Line Items Picked. The second KPI is Pallet Order Completeness. The third is Pallet Order Correctness. These KPI Powerpoint graphics are all data driven, and the shape automatically adjusts according to your data. Just right click on the KPI graphic, enter the right value and the shape will adjust automatically. Make a visual impact with our KPI slides.
-
 Warehouse kpi for floor space utilization stored items per employee presentation slide
Presenting warehouse kpi for floor space utilization stored items per employee presentation slide. This presentation slide shows Two Key Performance Indicators or KPIs in a Dashboard style design. The first KPI that can be shown is Floor Space Utilization. The second KPI is Stored Items Per Employee. These KPI Powerpoint graphics are all data driven, and the shape automatically adjusts according to your data. Just right click on the KPI graphic, enter the right value and the shape will adjust automatically. Make a visual impact with our KPI slides.
-
 Warehouse kpi for completed correct orders inspection time ppt slide
Presenting warehouse kpi for completed correct orders inspection time ppt slide. This presentation slide shows Three Key Performance Indicators or KPIs in a Dashboard style design. The first KPI that can be shown is Box Order Completeness. The second KPI is Box Order Correctness. The third is Average Dock to Stock Time For Inspection Testing. These KPI Powerpoint graphics are all data driven, and the shape automatically adjusts according to your data. Just right click on the KPI graphic, enter the right value and the shape will adjust automatically. Make a visual impact with our KPI slides.
-
 Kpi for undamaged goods incorrect items incorrect stock balances ppt slide
Presenting kpi for undamaged goods incorrect items incorrect stock balances ppt slide. This presentation slide shows Three Key Performance Indicators or KPIs in a Dashboard style design. The first KPI that can be shown is Percentage of Undamaged Goods After Shipping Transportation. The second KPI is Percentage of Inventory Items Incorrectly Located. The third is Percentage of Inventory Items With Incorrect Stock Balances. These KPI Powerpoint graphics are all data driven, and the shape automatically adjusts according to your data. Just right click on the KPI graphic, enter the right value and the shape will adjust automatically. Make a visual impact with our KPI slides.
-
 Kpi for cubic meters 1000 packages warehouse shrinkage percentage powerpoint slide
Presenting kpi for cubic meters 1000 packages warehouse shrinkage percentage powerpoint slide. This presentation slide shows Two Key Performance Indicators or KPIs in a Dashboard style design. The first KPI that can be shown is Cubic Meters Per 1,000 Packages. The second KPI is Percentage of Warehouse Shrinkage. These KPI Powerpoint graphics are all data driven, and the shape automatically adjusts according to your data. Just right click on the KPI graphic, enter the right value and the shape will adjust automatically. Make a visual impact with our KPI slides.
-
 Inventory location accuracy correct line items receiving time ppt slide
Presenting inventory location accuracy correct line items receiving time ppt slide. This presentation slide shows Three Key Performance Indicators or KPIs in a Dashboard style design. The first KPI that can be shown is Inventory Location Accuracy. The second KPI is Percentage of Correctly Picked Line Items. The third is Average Dock to Stock Time For Receiving. These KPI Powerpoint graphics are all data driven, and the shape automatically adjusts according to your data. Just right click on the KPI graphic, enter the right value and the shape will adjust automatically. Make a visual impact with our KPI slides.
-
 KPI Dashboard Snapshot Of Data Warehouse With Expansion By Months
Introducing our KPI Dashboard Snapshot Of Data Warehouse With Expansion By Months set of slides. The topics discussed in these slides are Salesforce Sales, Customer Lifetime Value, Expansion Rate. This is an immediately available PowerPoint presentation that can be conveniently customized. Download it and convince your audience.
-
 Reporting Of Warehouse KPI With Data And Cost Per Conversion
Presenting our well structured Reporting Of Warehouse KPI With Data And Cost Per Conversion. The topics discussed in this slide are Reporting Of Warehouse KPI With Data And Cost Per Conversion. This is an instantly available PowerPoint presentation that can be edited conveniently. Download it right away and captivate your audience.
-
 KPI Dashboard Snapshot Showing Warehouse Data And Fleet Status
Presenting our well structured KPI Dashboard Snapshot Showing Warehouse Data And Fleet Status. The topics discussed in this slide are Profit, Costs, Revenue. This is an instantly available PowerPoint presentation that can be edited conveniently. Download it right away and captivate your audience.
-
 Overview of fmcg kpi dashboard with inventory turnover
Presenting this set of slides with name Overview Of FMCG KPI Dashboard With Inventory Turnover. The topics discussed in these slides are Product, Stock, Average Time. This is a completely editable PowerPoint presentation and is available for immediate download. Download now and impress your audience.
-
 KPI Dashboard Of Data Warehouse Overview With Delivery Reliability
Presenting our well structured KPI Dashboard Of Data Warehouse Overview With Delivery Reliability. The topics discussed in this slide are KPI Dashboard Of Data Warehouse Overview With Delivery Reliability. This is an instantly available PowerPoint presentation that can be edited conveniently. Download it right away and captivate your audience.
-
 Data KPI Dashboard Of Warehouse With Orders Per Day And Inventory
Introducing our Data KPI Dashboard Of Warehouse With Orders Per Day And Inventory set of slides. The topics discussed in these slides are Data KPI Dashboard Of Warehouse With Orders Per Day And Inventory. This is an immediately available PowerPoint presentation that can be conveniently customized. Download it and convince your audience.
-
 Data Warehouse KPI Powerpoint PPT Template Bundles
If you require a professional template with great design, then this Data Warehouse KPI Powerpoint PPT Template Bundles is an ideal fit for you. Deploy it to enthrall your audience and increase your presentation threshold with the right graphics, images, and structure. Portray your ideas and vision using twelve slides included in this complete deck. This template is suitable for expert discussion meetings presenting your views on the topic. With a variety of slides having the same thematic representation, this template can be regarded as a complete package. It employs some of the best design practices, so everything is well-structured. Not only this, it responds to all your needs and requirements by quickly adapting itself to the changes you make. This PPT slideshow is available for immediate download in PNG, JPG, and PDF formats, further enhancing its usability. Grab it by clicking the download button.
-
 Key Performance Indicator Framework For Retail Business
The following slide shows the key performance indicator Framework for tracking retail business. This includes metrics like sales, stock and customer. All metrics are affected by the growth of retail sector. Introducing our premium set of slides with Key Performance Indicator Framework For Retail Business. Ellicudate the three stages and present information using this PPT slide. This is a completely adaptable PowerPoint template design that can be used to interpret topics like Total Sales, Inventory Management, Customer Metrics. So download instantly and tailor it with your information.
-
 Supply chain kpi dashboard with order and warehouse status
Introducing our Supply Chain KPI Dashboard With Order And Warehouse Status set of slides. The topics discussed in these slides are Supply Chain KPI Dashboard With Order And Warehouse Status. This is an immediately available PowerPoint presentation that can be conveniently customized. Download it and convince your audience.
-
 Supply chain inventory kpi dashboard with warehouse capacity
Introducing our Supply Chain Inventory KPI Dashboard With Warehouse Capacity set of slides. The topics discussed in these slides are Supply Chain Inventory KPI Dashboard With Warehouse Capacity. This is an immediately available PowerPoint presentation that can be conveniently customized. Download it and convince your audience.
-
 Supply chain kpi dashboard production management ppt powerpoint presentation model rules
Present the topic in a bit more detail with this Supply Chain KPI Dashboard Production Management Ppt Powerpoint Presentation Model Rules. Use it as a tool for discussion and navigation on Inventory Turnover, Cost, Units Per Transaction, Stock Items. This template is free to edit as deemed fit for your organization. Therefore download it now.
-
 Warehouse optimization dashboard of daily average ordered products powerpoint template
This slide shows the graphs related to various metrics of warehouse optimization. Data covered under this dashboard include the stats of products with highest daily average replenish rate, number of most ordered product and least ordered products. This is a Warehouse Optimization Dashboard Of Daily Average Ordered Products Powerpoint Template drafted with a diverse set of graphics, that can be reformulated and edited as per your needs and requirements. Just download it in your system and make use of it in PowerPoint or Google Slides, depending upon your presentation preferences.
-
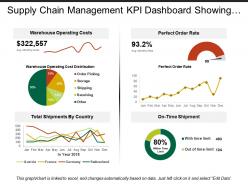 Supply chain management kpi dashboard showing warehouse operating costs
Presenting predesigned Supply Chain Management KPI Dashboard Showing Warehouse Operating Costs PPT slide. Download of the template design is simple. You can modify the layout font type, font size, colors and the background as per needs. Template slide is fully flexible with Google Slides and other online software’s. You can alter the design using the instructional slides provided with the template. You can remove the watermark with your brand name, trademark, signature or logo. You can save the template into PNG or JPEG formats. Supreme quality layouts are used to create this template which is editable in PowerPoint. Sample content can be replaced with your presentation content.
-
 Visual Analytical KPI Dashboard Snapshot For Data Warehouse
Presenting our well structured Visual Analytical KPI Dashboard Snapshot For Data Warehouse. The topics discussed in this slide are Profit, Revenue Change, Analysis. This is an instantly available PowerPoint presentation that can be edited conveniently. Download it right away and captivate your audience.
-
 Warehouse Data KPI Dashboard With Unit Sold By Month And Channel
Introducing our Warehouse Data KPI Dashboard With Unit Sold By Month And Channel set of slides. The topics discussed in these slides are Warehouse Data KPI Dashboard With Unit Sold By Month And Channel. This is an immediately available PowerPoint presentation that can be conveniently customized. Download it and convince your audience.
-
 Warehouse Data KPI With Order Performance Dashboard Snapshot
Presenting our well structured Warehouse Data KPI With Order Performance Dashboard Snapshot. The topics discussed in this slide are Perfect Order Rate, Inventory Accuracy, Back Order Rate. This is an instantly available PowerPoint presentation that can be edited conveniently. Download it right away and captivate your audience.
-
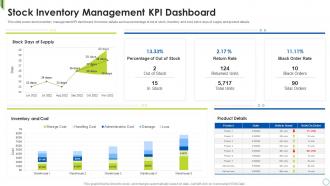 Stock Inventory Management Kpi Dashboard
This slide covers stock inventory management KPI dashboard. It involves details such as percentage of out of stock, inventory and cost, stock days of supply and product details. Introducing our Stock Inventory Management Kpi Dashboard set of slides. The topics discussed in these slides are Inventory And Cost, Product Details, Stock. This is an immediately available PowerPoint presentation that can be conveniently customized. Download it and convince your audience.
-
 KPI Dashboard Highlighting Automation Results In Supply Chain Strengthening Process Improvement
The following slide outlines a comprehensive dashboard depicting the business process automation BPA results in the supply chain. Information covered in the slide is related to average order processing days, average shipping days, etc. Present the topic in a bit more detail with this KPI Dashboard Highlighting Automation Results In Supply Chain Strengthening Process Improvement. Use it as a tool for discussion and navigation on Shipment Status, Average Order Processing Days, Average Order Fulfillment Days, Late Deliveries By Warehouse, Late Deliveries Product. This template is free to edit as deemed fit for your organization. Therefore download it now.
-
 Distribution Channel Effectiveness Measurement Dashboard Differentiation Strategy How To Outshine
The following slide helps organization in understanding the effect of their differentiation strategy. It highlight essential metrics such as retailer capacity, warehouse capacity etc. Present the topic in a bit more detail with this Distribution Channel Effectiveness Measurement Dashboard Differentiation Strategy How To Outshine. Use it as a tool for discussion and navigation on Profitability, Warehouse Capacity, Measurement Dashboard. This template is free to edit as deemed fit for your organization. Therefore download it now.
-
 Supply Planning KPI Dashboard Depicting Inventory And Costs
This slide delineates supply planning key performance indicator KPI dashboard depicting inventory and costs which can assist logistics manager in determining demand and supply of products. It includes information about transaction based on units, out of stock products, inventory turnover and month to date expenditures. Presenting our well-structured Supply Planning KPI Dashboard Depicting Inventory And Costs. The topics discussed in this slide are Supply Planning, KPI Dashboard, Depicting Inventory, Costs. This is an instantly available PowerPoint presentation that can be edited conveniently. Download it right away and captivate your audience.
-
 KPI Dashboard Highlighting Automation Results BPA Tools For Process Improvement And Cost Reduction
The following slide outlines a comprehensive dashboard depicting the business process automation BPA results in the supply chain. Information covered in the slide is related to average order processing days, average shipping days, etc. Present the topic in a bit more detail with this KPI Dashboard Highlighting Automation Results BPA Tools For Process Improvement And Cost Reduction. Use it as a tool for discussion and navigation on Shipment Status, Late Deliveries, Warehouse, Product. This template is free to edit as deemed fit for your organization. Therefore download it now.
-
 Inventory Kpis Dashboard For FMCG Company
This slide showcases the metrics for analyzing inventory turnover. It includes KPIs such as product sold within freshness date, out of stock rate, on time in full deliveries, etc. Presenting our well structured Inventory Kpis Dashboard For FMCG Company. The topics discussed in this slide are Average, Products, Stock Rate. This is an instantly available PowerPoint presentation that can be edited conveniently. Download it right away and captivate your audience.
-
 Kpis For Inventory Management In Warehouse
This slide represents the metrics for warehouse stock management. It includes KPIs such as internal, supplier and customer. Introducing our premium set of slides with Kpis For Inventory Management In Warehouse. Ellicudate the three stages and present information using this PPT slide. This is a completely adaptable PowerPoint template design that can be used to interpret topics like Supplier Kpis, Customer Kpis, Internal Kpis. So download instantly and tailor it with your information.
-
 Logistics KPI Dashboard Snapshot For Supply Chain Management
This slide displays the logistics dashboard for monitoring and reporting warehouse operations and transportation processes. It include KPIs such as revenue, shipments, avg delivery time, fleet status, delivery status, average loading time and weight, etc. Presenting our well structured Logistics KPI Dashboard Snapshot For Supply Chain Management. The topics discussed in this slide are Logistics KPI Dashboard, Supply Chain Management, Revenue. This is an instantly available PowerPoint presentation that can be edited conveniently. Download it right away and captivate your audience.
-
 Ecommerce Accounting Management Ecommerce KPI Dashboard With P And L Statement
This slide showcases ecommerce key performance indicators KPI dashboard with financial statement. It provides information about total sales, orders, net profit, net profit margin, average order value, channels, etc. Deliver an outstanding presentation on the topic using this Ecommerce Accounting Management Ecommerce KPI Dashboard With P And L Statement. Dispense information and present a thorough explanation of Sales Price, Warehouse Costs, Sales By Location using the slides given. This template can be altered and personalized to fit your needs. It is also available for immediate download. So grab it now.
-
 Logistics Service Delivery Status Dashboard
This slide shows the monitoring and reporting of important logistics KPIs concerning warehouse operations, transportation processes, and overall supply chain management. The key measuring metrics include fleet efficiency, delivery status, deliveries by destination, loading time and loading weight. Introducing our Logistics Service Delivery Status Dashboard set of slides. The topics discussed in these slides are Delivery Status, Deliveries By Destination, Loading Time. This is an immediately available PowerPoint presentation that can be conveniently customized. Download it and convince your audience.
-
 Warehouse kpis carrying cost of inventory backorder rate inventory turnover
Presenting this set of slides with name - Warehouse Kpis Carrying Cost Of Inventory Backorder Rate Inventory Turnover. This is a four stage process. The stages in this process are Warehouse Kpi, Warehouse Dashboard, Warehouse Metrics.
-
 Kpi data warehouse ppt powerpoint templates
Presenting kpi data warehouse ppt powerpoint templates. This is a kpi data warehouse ppt powerpoint templates. This is a three stage process. The stages in this process are dashboard, measure, business, strategy, success.
-
 Kpi inventory dashboard template powerpoint graphics
Presenting kpi inventory dashboard template powerpoint graphics. This is a kpi inventory dashboard template powerpoint graphics. This is a three stage process. The stages in this process are jit waste index, stock accuracy, days.
-
 Inventory kpi for rfid goods received duplicate stock ppt slide
Presenting inventory kpi for rfid goods received duplicate stock ppt slide. This presentation slide shows Three Key Performance Indicators or KPIs in a Dashboard style design. The first KPI that can be shown is Percentage of Items Tracked With Radio Frequency Identification or RFID. The second KPI is Percentage of Goods Received From 1 Batch. The third is Percentage of Duplicate Stock Numbers. These KPI Powerpoint graphics are all data driven, and the shape automatically adjusts according to your data. Just right click on the KPI graphic, enter the right value and the shape will adjust automatically. Make a visual impact with our KPI slides.
-
 Inventory kpi for sell through total stock inventory accuracy presentation slide
Presenting inventory kpi for sell through total stock inventory accuracy presentation slide. This presentation slide shows Three Key Performance Indicators or KPIs in a Dashboard style design. The first KPI that can be shown is Sell Through Percentage. The second KPI is Percentage of Total Stock That is not Displayed to Customers. The third is Inventory Accuracy. These KPI Powerpoint graphics are all data driven, and the shape automatically adjusts according to your data. Just right click on the KPI graphic, enter the right value and the shape will adjust automatically. Make a visual impact with our KPI slides.
-
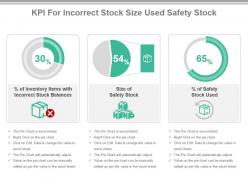 Kpi for incorrect stock size used safety stock presentation slide
Presenting kpi for incorrect stock size used safety stock presentation slide. This presentation slide shows Three Key Performance Indicators or KPIs in a Dashboard style design. The first KPI that can be shown is Percentage of Inventory Items with Incorrect Stock Balances. The second KPI is Size of Safety Stock. The third is Percentage of Safety Stock Used.These KPI Powerpoint graphics are all data driven, and the shape automatically adjusts according to your data. Just right click on the KPI graphic, enter the right value and the shape will adjust automatically. Make a visual impact with our KPI slides.
-
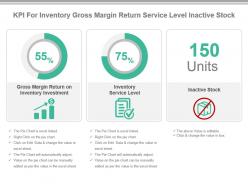 Kpi for inventory gross margin return service level inactive stock presentation slide
Presenting kpi for inventory gross margin return service level inactive stock presentation slide. This presentation slide shows Three Key Performance Indicators or KPIs in a Dashboard style design. The first KPI that can be shown is Gross Margin Return on Inventory Investment. The second KPI is Inventory Service Level. The third is Inactive Stock. These KPI Powerpoint graphics are all data driven, and the shape automatically adjusts according to your data. Just right click on the KPI graphic, enter the right value and the shape will adjust automatically. Make a visual impact with our KPI slides.
-
 Kpi for picked line items dock to stock time goods ratio powerpoint slide
Presenting kpi for picked line items dock to stock time goods ratio powerpoint slide. This presentation slide shows Three Key Performance Indicators or KPIs in a Dashboard style design. The first KPI that can be shown is Percentage of Correctly Picked Line Items. The second KPI is Average Dock to Stock Time for Receiving. The third is Inventory to Obsolete Goods Ratio. These KPI Powerpoint graphics are all data driven, and the shape automatically adjusts according to your data. Just right click on the KPI graphic, enter the right value and the shape will adjust automatically. Make a visual impact with our KPI slides.
-
 Kpi for stock available stock controlled skus ppt slide
Presenting kpi for stock available stock controlled skus ppt slide. This presentation slide shows Two Key Performance Indicators or KPIs in a Dashboard style design. The first KPI that can be shown is Percentage of Stock Available at Customers First Request. The second KPI is Percentage of Stock Controlled SKUs. These KPI Powerpoint graphics are all data driven, and the shape automatically adjusts according to your data. Just right click on the KPI graphic, enter the right value and the shape will adjust automatically. Make a visual impact with our KPI slides.
-
 Safety stock kpi for inventory management holding costs presentation slide
Presenting safety stock kpi for inventory management holding costs presentation slide. This presentation slide shows Two Key Performance Indicators or KPIs in a Dashboard style design. The first KPI that can be shown is Inventory Management Cost as Percentage of Gross Sales. The second KPI is Inventory Holding Costs or IHC as Percentage of Gross Sales. These KPI Powerpoint graphics are all data driven, and the shape automatically adjusts according to your data. Just right click on the KPI graphic, enter the right value and the shape will adjust automatically. Make a visual impact with our KPI slides.
-
 Stock time kpi for inspection testing lead time variability powerpoint slide
Presenting stock time kpi for inspection testing lead time variability powerpoint slide. This presentation slide shows Two Key Performance Indicators or KPIs in a Dashboard style design. The first KPI that can be shown is Average Dock to Stock Time for Inspection Testing. The second KPI is Percent Variability in Lead Time. These KPI Powerpoint graphics are all data driven, and the shape automatically adjusts according to your data. Just right click on the KPI graphic, enter the right value and the shape will adjust automatically. Make a visual impact with our KPI slides.
-
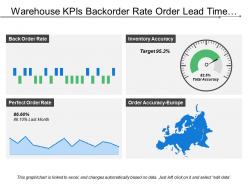 Warehouse kpis backorder rate order lead time inventory accuracy
Presenting this set of slides with name - Warehouse Kpis Backorder Rate Order Lead Time Inventory Accuracy. This is a four stage process. The stages in this process are Warehouse Kpi, Warehouse Dashboard, Warehouse Metrics.
-
 Warehouse kpis bundle order line picks pieces volume customer
Presenting this set of slides with name - Warehouse Kpis Bundle Order Line Picks Pieces Volume Customer. This is a seven stage process. The stages in this process are Warehouse Kpi, Warehouse Dashboard, Warehouse Metrics.
-
 Transportation kpi dashboard showing warehouse operating costs perfect order rate
Presenting transportation KPI dashboard showing warehouse operating costs perfect order rate PPT slide. This layout is fully compatible with Google slides and data driven. User can edit the data in linked excel sheet and graphs and charts gets customized accordingly. Easy to put in company logo, trademark or name; accommodate words to support the key points. Images do no distort out even when they are projected on large screen. Adjust colors, text and fonts as per your business requirements.
-
 Warehouse kpis date bundle orderlines pieces volume customer
Presenting this set of slides with name - Warehouse Kpis Date Bundle Orderlines Pieces Volume Customer. This is a four stage process. The stages in this process are Warehouse Kpi, Warehouse Dashboard, Warehouse Metrics.
-
 Warehouse kpis internal supplier customer operating costs shipments
Presenting this set of slides with name - Warehouse Kpis Internal Supplier Customer Operating Costs Shipments. This is a six stage process. The stages in this process are Warehouse Kpi, Warehouse Dashboard, Warehouse Metrics.
-
 Warehouse kpis operating costs order rate total shipments country
Presenting this set of slides with name - Warehouse Kpis Operating Costs Order Rate Total Shipments Country. This is a four stage process. The stages in this process are Warehouse Kpi, Warehouse Dashboard, Warehouse Metrics.
-
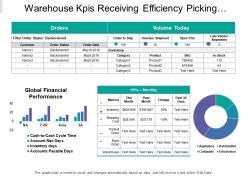 Warehouse kpis receiving efficiency picking accuracy backorder rate inventory
Presenting this set of slides with name - Warehouse Kpis Receiving Efficiency Picking Accuracy Backorder Rate Inventory. This is a four stage process. The stages in this process are Warehouse Kpi, Warehouse Dashboard, Warehouse Metrics.
-
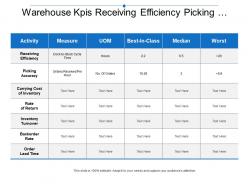 Warehouse kpis receiving efficiency picking accuracy carrying inventory
Presenting this set of slides with name - Warehouse Kpis Receiving Efficiency Picking Accuracy Carrying Inventory. This is a five stage process. The stages in this process are Warehouse Kpi, Warehouse Dashboard, Warehouse Metrics.
-
 Warehouse kpis shipping receiving storage order picking accuracy
Presenting this set of slides with name - Warehouse Kpis Shipping Receiving Storage Order Picking Accuracy. This is a four stage process. The stages in this process are Warehouse Kpi, Warehouse Dashboard, Warehouse Metrics.
-
 Warehouse kpis transaction out of stock inventory return carry cost
Presenting this set of slides with name - Warehouse Kpis Transaction Out Of Stock Inventory Return Carry Cost. This is a four stage process. The stages in this process are Warehouse Kpi, Warehouse Dashboard, Warehouse Metrics.
-
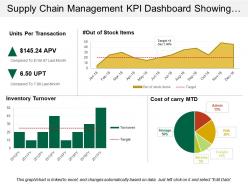 Supply chain management kpi dashboard showing units per transaction
Presenting predesigned Supply Chain Management KPI Dashboard Showing Warehouse Operating Costs PPT slide. Download of the template design is simple. You can modify the layout font type, font size, colors and the background as per needs. Template slide is fully flexible with Google Slides and other online software’s. You can alter the design using the instructional slides provided with the template. You can remove the watermark with your brand name, trademark, signature or logo. You can save the template into PNG or JPEG formats. Supreme quality layouts are used to create this template which is editable in PowerPoint. Sample content can be replaced with your presentation content.
-
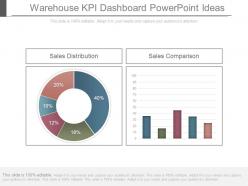 Warehouse kpi dashboard powerpoint ideas
Presenting warehouse kpi dashboard powerpoint ideas. This is a warehouse kpi dashboard powerpoint ideas. This is a two stage process. The stages in this process are sales distribution, sales comparison.
-
 Wholesale and retail kpi dashboard showing distribution centers product revenue
Presenting this set of slides with name - Wholesale And Retail Kpi Dashboard Showing Distribution Centers Product Revenue. This is a four stage process. The stages in this process are Wholesale And Retail, Extensive And Retail, Wholesale And Distribute.
-
 Warehousing kpi dashboard showing order status and active pickers
The design template is compatible with Google Slides and MS PowerPoint software. You can download this design into various formats such as JPEG or PDF format. The warehouse KPI dashboard PPT design template is 100% editable; you can modify and personalize the design according to your business requirements. Design is fully supported on standard and full screen view; no change in design quality on full screen view.
-
Informative design.
-
Design layout is very impressive.
-
Amazing product with appealing content and design.
-
Great designs, Easily Editable.
-
Great product with highly impressive and engaging designs.
-
Design layout is very impressive.
-
I discovered this website through a google search, the services matched my needs perfectly and the pricing was very reasonable. I was thrilled with the product and the customer service. I will definitely use their slides again for my presentations and recommend them to other colleagues.
-
Presentation Design is very nice, good work with the content as well.
-
Very unique and reliable designs.
-
Excellent products for quick understanding.


