- Sub Categories
-
 Hobbies ppt pictures slide download
Presenting this set of slides with name - Hobbies Ppt Pictures Slide Download. This is a five stage process. The stages in this process are Business, Management, Strategy, Analysis, Icons.
-
 Pie chart marketing ppt summary example introduction
Presenting this set of slides with name - Pie Chart Marketing Ppt Summary Example Introduction. This is a four stage process. The stages in this process are Finance, Analysis, Business, Investment, Marketing.
-
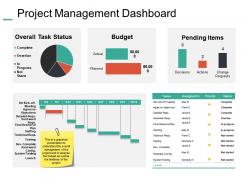
 Project management dashboard snapshot ppt summary example introduction
Presenting this set of slides with name - Project Management Dashboard Snapshot Ppt Summary Example Introduction. This is a three stage process. The stages in this process are Budget, Pending Items, Change Request, Decision, Actions.
-
 Sales by category ppt professional graphics download
Presenting this set of slides with name - Sales By Category Ppt Professional Graphics Download. This is a three stage process. The stages in this process are Finance, Analysis, Business, Investment, Marketing.
-
 Comparison finance ppt powerpoint presentation portfolio slideshow
Presenting this set of slides with name - Comparison Finance Ppt Powerpoint Presentation Portfolio Slideshow. This is a two stage process. The stages in this process are Finance, Analysis, Business, Investment, Marketing.
-
 Pie chart medium ppt powerpoint presentation professional infographics
Presenting this set of slides with name - Pie Chart Medium Ppt Powerpoint Presentation Professional Infographics. This is a three stage process. The stages in this process are Finance, Analysis, Business, Investment, Marketing.
-
 Pie chart investment ppt powerpoint presentation templates
Presenting this set of slides with name - Pie Chart Investment Ppt Powerpoint Presentation Templates. This is a three stages process. The stages in this process are Pie Chart, Finance, Marketing, Business, Analysis.
-
 Magnifying glass ppt layouts brochure
Presenting this set of slides with name - Magnifying Glass Ppt Layouts Brochure. This is a four stage process. The stages in this process are Business, Management, Strategy, Analysis, Marketing.
-
 Financial ppt show brochure
Presenting this set of slides with name - Financial Ppt Show Brochure. This is a three stage process. The stages in this process are Business, Management, Strategy, Analysis, Marketing.
-
 Pie chart ppt slides guidelines
Presenting this set of slides with name - Pie Chart Ppt Slides Guidelines. This is a three stage process. The stages in this process are Business, Management, Strategy, Analysis, Marketing.
-
 Comparison ppt summary graphics design
Presenting this set of slides with name - Comparison Ppt Summary Graphics Design. This is a two stage process. The stages in this process are Business, Management, Strategy, Analysis, Comparison.
-
 Pie chart ppt portfolio graphics example
Presenting this set of slides with name - Pie Chart Ppt Portfolio Graphics Example. This is a three stage process. The stages in this process are Business, Management, Strategy, Analysis, Marketing.
-
 Template 1 ppt inspiration background
Presenting this set of slides with name - Template 1 Ppt Inspiration Background. This is a four stage process. The stages in this process are Business, Management, Strategy, Analysis, Marketing.
-
 Automated data mapping ppt powerpoint presentation gallery designs cpb
Presenting this set of slides with name - Automated Data Mapping Ppt Powerpoint Presentation Gallery Designs Cpb. This is an editable five stages graphic that deals with topics like Automated Data Mapping to help convey your message better graphically. This product is a premium product available for immediate download, and is 100 percent editable in Powerpoint. Download this now and use it in your presentations to impress your audience.
-
 Pie chart ppt powerpoint presentation model guide
Presenting this set of slides with name - Pie Chart Ppt Powerpoint Presentation Model Guide. This is a three stage process. The stages in this process are Analysis, Financials, Business, Management, Strategy.
-
 Pie chart ppt powerpoint presentation model information
Presenting this set of slides with name - Pie Chart Ppt Powerpoint Presentation Model Information. This is a two stage process. The stages in this process are Analysis, Financials, Business, Management, Strategy.
-
 Market business management ppt powerpoint presentation inspiration portfolio
Presenting this set of slides with name - Market Business Management Ppt Powerpoint Presentation Inspiration Portfolio. This is a three stages process. The stages in this process are Bar Graph, Finance, Marketing, Business, Analysis.
-
 Employee weekly efficiency dashboard ppt powerpoint presentation gallery styles
Presenting this set of slides with name - Employee Weekly Efficiency Dashboard Ppt Powerpoint Presentation Gallery Styles. This is a four stages process. The stages in this process are Pie Chart, Finance, Marketing, Business, Analysis.
-
 Labour effectiveness dashboard ppt powerpoint presentation diagram lists
Presenting this set of slides with name - Labour Effectiveness Dashboard Ppt Powerpoint Presentation Diagram Lists. This is a four stages process. The stages in this process are Bar Graph, Finance, Marketing, Business, Analysis.
-
 Pie chart finance ppt powerpoint presentation layouts pictures
Presenting this set of slides with name - Pie Chart Finance Ppt Powerpoint Presentation Layouts Pictures. This is a three stages process. The stages in this process are Pie Chart, Finance, Marketing, Business, Analysis.
No Reviews


