- Sub Categories
-
 Data driven compare market share of brand powerpoint slides
We are proud to present our data driven compare market share of brand powerpoint slides. Be The Star Of The Show With Our Data Driven Compare Market Share Of Brand Powerpoint Slides Power Point Templates. Rock The Stage With Your Ideas. Break Through With Our Data Driven Compare Market Share Of Brand Powerpoint Slides Power Point Templates. Bring Down The Mental Barriers Of Your Audience.
-
 Data driven completion in project management powerpoint slides
We are proud to present our data driven completion in project management powerpoint slides. Add Color To Your Speech With Our Data Driven Completion In Project Management Powerpoint Slides Power Point Templates. Your Presentation Will Leave Your Audience Speechless. Experience Excellence With Our Data Driven Completion In Project Management Powerpoint Slides Power Point Templates. They Will Take Your Breath Away.
-
 Data driven categorical statistics doughnut chart powerpoint slides
We are proud to present our data driven categorical statistics doughnut chart powerpoint slides. Our Data Driven Categorical Statistics Doughnut Chart Powerpoint slides Power Point Templates Give You That Extra Zing. Add Your Views And Make Your Audience Sing. Our Pretty Data Driven Categorical Statistics Doughnut Chart Powerpoint slides Power Point Templates Are Like Snowflakes That Fall. Gather Them Together And Have A Ball. Put Your Wondrously Glowing Ideas Into Them. Bind Them Together And Create Mayhem.
-
 0414 colorful donut chart business graphics powerpoint graph
PPT slide works evenly and smoothly on all software. PPT example can be downloaded easily. More customization by including your company’s logo, trademark. No space constraints whatsoever. Graphics do not pixelate when displayed on widescreen format. Insert title and sub-title at your discretion. Slides compatible with Google slides for more viewership. Flexible layout including font, text, color and design. Change to JPG and PDF formats in moments.
-
 0414 Donut And Column Business Charts Powerpoint Graph
Entirely editable PowerPoint presentation slide. Adaptable with several software programs like JPEG and PDF. Preference to include and remove content as per the commerce need. Available in both standard as well as in widescreen slide. Gives a professional perspective to your PowerPoint slide. Personalization of PPT template is possible as per your requirement. Similar samples available with different nodes and stages.
-
 0414 donut chart business illuastration powerpoint graph
We are proud to present our 0414 donut chart business illuastration powerpoint graph. Tee off with our 0414 Donut Chart Business Illuastration Powerpoint Graph Powerpoint Templates. They will reward you with a hole in one. Launch your ideas with our 0414 Donut Chart Business Illuastration Powerpoint Graph Powerpoint Templates. Take your audience along on a magnificent flight.
-
 0414 donut chart wheels business design powerpoint graph
Adjust the PowerPoint slide design by addition of business name. Swift download and easy to alter into JPEG and PDF document. Presentation samples well-attuned with Google slides. Greater quality and visually appealing PPT clip art. Accurate and easy to grasp information. Availability to present design in standard and widescreen display view. Presentation guide can be accessed with different nodes and stages. Perfect for showing teamwork, collaboration, partnership related concepts.
-
 0414 global growth donut chart powerpoint graph
Straightforward download in quick and easy steps. Insert text to as per to the context without constraint on word length. High resolution PPT icons with fully modifiable size, color scheme and orientation. Add your company logo, trademark, tagline etc. for personalization. Project on wide screen without pixelation. Perfectly compatible with Google slides and easily convertible to PDF or JPG formats.
-
 0414 human character with pie chart powerpoint graph
Extremely useful presentation tool to enhance the performance of your presentations. Does not make the information look messed up. Summarises large data set in a visually appealing way. Well matched framework with Google Slides. Allows changing the formats into JPG and PDF. Equipped with high-resolution pie chart which can even be viewed in big screens without compromising the quality.
-
 0414 percentage values donut and column chart powerpoint graph
Easy proofing and editing is added on feature of presentation visual. Presentation slide is useful in business marketing, management and recourse disbursement. Basic theme yet it can modified with respect to font, color and layout. Attractive color scheme gives a professional look to PPT layout. Conversion into PDF or JPG formats is very easy and handy. PPT graphic offers font size which can be read from a distance.
-
 0414 pie chart data driven layout powerpoint graph
Flawless presentation of ideas. High resolution visual ensures zero pixilation at any size output. Splendid mix of color, design, format and fonts. Ease of download. Ease of saving it in any desired format. Compatible with numerous online and offline software options. Thoroughly editable slide design background. Ease of inclusion and exclusion of data. Ease of personalization with company specific name, logo and trademark. Used by marketing professionals, sales people, students and teachers.
-
 0514 5 staged unique style data driven pie chart powerpoint slides
The PowerPoint presentation ensures proofing and editing with ease. Utmost useful to management professionals, big or small organizations and business startups. Supports recasting the color, size and orientation in presentation slide show according to the requirement. High resolution in color and art shape is offered by PPT graphic. Offers high resolution without compromising on pixels quality in PPT layout when viewed on a larger screen. PowerPoint slide is well compatible with Google slides.
-
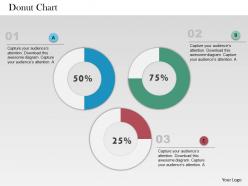 0514 data driven business donut chart powerpoint slides
We are proud to present our 0514 data driven business donut chart powerpoint slides. This Business power Point template is designed with unique donut chart. Enhance the beauty of your presentation with our unique template collection.
-
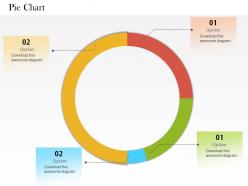 0514 data driven circular pie chart powerpoint slides
We are proud to present our 0514 data driven circular pie chart powerpoint slides. This Business Power Point template is designed with data driven circular pie chart to highlight the result in any business presentation.
-
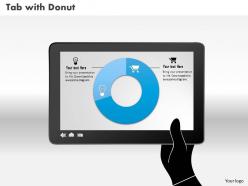 0514 data driven donut diagram powerpoint slides
We are proud to present our 0514 data driven donut diagram powerpoint slides. This Business power Point template is designed with unique donut shape diagram. Enhance the beauty of your presentation with our unique template collection.
-
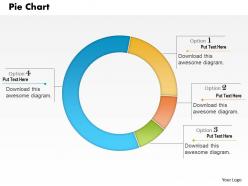 0514 display analysis with data driven pie chart powerpoint slides
We are proud to present our 0514 display analysis with data driven pie chart powerpoint slides. This Business Power Point template is designed to display analysis of data driven result in any business presentation. Create a good impact on your viewers with our unique template collection.
-
 1114 screen with circular process flow diagram powerpoint template
Alteration can be possible with color, font, shape and even text. Instant download and can be altered in JPEG and PDF format. Alternate to customize the design by adding business name, icon and mark. Adjustable presentation template with wonderful picture quality. PPT design can be shown in standard and widescreen view. Availability to get similar designs with different nodes and stages as required.
-
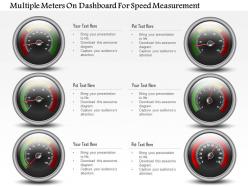 1214 Multiple Meters On Dashboard For Speed Measurement Powerpoint Slide
This template with speed meters is convenient to use. You can easily insert or remove any kind of figures or illustrations as per your requirements by simply following the instructions that have been given in the sample slides. The font size, font color and the font style that you use in the slides is 100% editable and can be changed easily as per your needs. You can get these slides in widescreen display with ratio of 16:9 by just a click. You can even upload these slides to Google Slides and they will work automatically. Also you can save the template in JPG or PDF format.
-
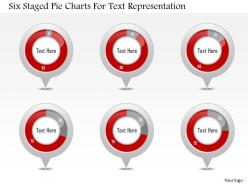 1214 six staged pie charts for text representation powerpoint slide
We are proud to present our 1214 six staged pie charts for text representation powerpoint slide. six staged pie charts are used to craft this power point template slide. This PPT slide contains the concept of process analysis. This analysis can be used for business and marketing related presentations.
-
 Bulb with process icons for data driven analysis powerpoint slides
Download in an instant in simple steps. Change orientation and sizes of PPT images to suit your need. High resolution PPT infographics that do not pixelate on wide screen projection. Modify color scheme and contrast as per need. No length constraints on fully modifiable text in titles and subtitles. Runs smoothly with Google slides and easily convertible to PDF or JPG.
-
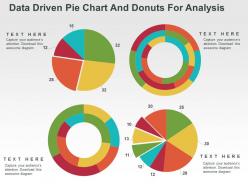 Data driven pie chart and donuts for analysis powerpoint slides
Presenting data driven pie chart and donuts for analysis PowerPoint template. High-resolution PowerPoint presentation backgrounds for better clarity of the information displayed. Offers wide variety of options and colors to alter the appearance. Allows adding of enterprise personal details such as brand name, logo and much more. Enough space available to enter text and its related points in the PPT table. This PPT Slide is available in both Standard and Widescreen slide size. Compatible with multiple formats like JPEG, PDF and Google slides.
-
 Donut chart with icons for data driven statistics powerpoint slides
Businessmen, micro, small and medium enterprises can use the PPT visual as a master slide. PowerPoint presentation supports filling background in a different color from the text. All images are 100% editable in the presentation slide. Text can be differentiated form the background by the handy features provided by PPT layout. There is no space constrain in the PowerPoint design, thus enabling easy addition or edition of data.
-
 Donut style pie chart for data driven analysis powerpoint slides
Organized slide pie diagram is totally variable. Downloading design in any configuration choices like JPEG, JPG or PDF is straightforward and lively. Provide a star point of view to your organization slides. Highly clear with Google slides. Symbols are in like way being joined. Editing of substance, portrayal, diagrams, and substance as showed up by your hurting and need. Visuals don't dark when exposed on widescreen.
-
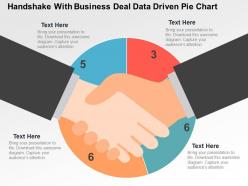 Handshake with business deal data driven pie chart powerpoint slides
We are proud to present our handshake with business deal data driven pie chart powerpoint slides. Graphic of handshake and pie chart has been used to design this power point template diagram. This PPT diagram contains the concept of data driven business deal and analysis. Use this PPT diagram for business and finance related presentations.
-
 Key design pie chart with idea generation process control powerpoint slides
Skillfully crafted Presentation layout. Completely modifiable PowerPoint visual as some elements are editable. Easiness of personalization with your company name and logo. PPT diagram can be downloaded easily and transform into JPG and PDF format. Choice to access similar designs with different stages. PowerPoint slide can be projected in standard and widescreen view. Awesome use of colors and innovatively designed.
-
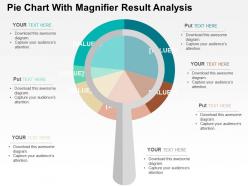 Pie chart with magnifier result analysis powerpoint slides
Readymade template pie chart with magnifier result analysis. Can be used for business people, sales executives and communication departments. Colors, charts and shapes can be easily changed as the PPT slide is completely editable. Simply click to add company logo, trademark or name. This PPT Slide is available in both Standard and Widescreen slide size. Easy and quick downloading process.
-
 Six staged donut style year based timeline powerpoint slides
High resolution PPT example for timeline to identify sales growth. Increase the level of personalization with your company logo and name. Compatible with all software and can be saved in any format. Useful tool for business analysts, sales people, sales managers and professionals of any industry. Precise and easy to comprehend information on PPT sample. Wide screen projection does not affect the output adversely.
-
 How well spend the money sample ppt presentation
Presenting how well spend the money sample ppt presentation. This is a how well spend the money sample ppt presentation. This is a twelve stage process. The stages in this process are business, marketing, process, analysis, strategy, management.
-
 How well spend the money ppt slide template
Presenting how well spend the money ppt slide template. This is a how well spend the money ppt slide template. This is a twelve stage process. The stages in this process are business, management, strategy, icons, process.
-
 Sales highlights ppt sample file
Presenting sales highlights ppt sample file. This is a sales highlights ppt sample file. This is a five stage process. The stages in this process are total sales by month, opportunities total sales by probability, opportunity name amount, total sale amount, lead sources revenue share.
-
 Performance overview ppt examples professional
Presenting performance overview ppt examples professional. This is a performance overview ppt examples professional. This is a one stage process. The stages in this process are social engagement, website review, local mobile strategy, local reach, your business, reviews, rank, needs improvement, customer solution, recommended budget.
-
 Monthly social media dashboard snapshot ppt design
Presenting monthly social media dashboard snapshot ppt design. This is a monthly social media dashboard ppt design. This is a four stage process. The stages in this process are social events, sales, social traffic and conversion, key social metrics, referrals, conversions, events.
-
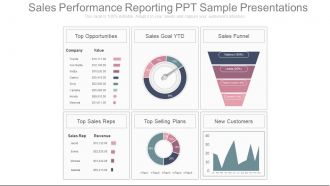 Sales performance reporting ppt sample presentations
These slides are fully editable to suit your needs. Instantly download any design within a few seconds. Standard and widescreen compatible graphics. Can be opened using Google Slides also. Suitable for use by marketers, sales team, businessmen. Premium customer support service.This is a four stage process. The stages in this process are top opportunities, sales goal ytd, sales funnel, top sales reps, top selling plans, new customers, company, value, sales rep, revenue.
-
 Current sources of revenue powerpoint layout
Presenting current sources of revenue powerpoint layout. Presenting current sources of revenue powerpoint layout. Presenting current sources of revenue powerpoint layout. This is a current sources of revenue powerpoint layout. This is five stage process. The stages in this process are business, percentage, finance, strategy, success.
-
 Current sources of revenue ppt background template
Presenting current sources of revenue ppt background template. Presenting current sources of revenue ppt background template. Presenting current sources of revenue ppt background template. This is a current sources of revenue ppt background template. This is five stage process. The stages in this process are business, percentage, finance, strategy, success.
-
 Current sources of revenue sample of ppt presentation
Presenting current sources of revenue sample of ppt presentation. Presenting current sources of revenue sample of ppt presentation. Presenting current sources of revenue sample of ppt presentation. This is a current sources of revenue sample of ppt presentation. This is four stage process. The stages in this process are business, percentage, strategy, analysis, success.
-
 Operating expenses by category powerpoint shapes
Presenting operating expenses by category powerpoint shapes. This is a operating expenses by category powerpoint shapes. This is a seven stage process. The stages in this process are operating expenses.
-
 Operating expenses by category powerpoint slide designs
Presenting operating expenses by category powerpoint slide designs. This is a operating expenses by category powerpoint slide designs. This is a eight stage process. The stages in this process are business, management, marketing, finance, operating.
-
 Operating expenses by category powerpoint slide inspiration
Presenting operating expenses by category powerpoint slide inspiration. This is a operating expenses by category powerpoint slide inspiration. This is a five stage process. The stages in this process are business, management, marketing, finance, operating.
-
 Operating expenses by category ppt icon
Presenting operating expenses by category ppt icon. This is a operating expenses by category ppt icon. This is a seven stage process. The stages in this process are business, management, marketing, finance, operating.
-
 Potential sources of revenue powerpoint slide graphics
Presenting potential sources of revenue powerpoint slide graphics. This is a potential sources of revenue powerpoint slide graphics. This is a five stage process. The stages in this process are potential sources of revenue.
-
 Potential sources of revenue powerpoint slide inspiration
Presenting potential sources of revenue powerpoint slide inspiration. This is a potential sources of revenue powerpoint slide inspiration. This is a four stage process. The stages in this process are business, management, marketing, finance, operating.
-
 Potential sources of revenue ppt design templates
Presenting potential sources of revenue ppt design templates. This is a potential sources of revenue ppt design templates. This is a five stage process. The stages in this process are business, management, marketing, finance, operating.
-
 Potential sources of revenue ppt designs
Presenting potential sources of revenue ppt designs. This is a potential sources of revenue ppt designs. This is a five stage process. The stages in this process are business, management, marketing, finance, operating.
-
 Referral report powerpoint slide introduction
Presenting referral report powerpoint slide introduction. This is a referral report powerpoint slide introduction. This is a two stage process. The stages in this process are contacted, handed off, proposal, received referral revenue, generated by sent referrals, received referrals, sent referrals, calendar events.
-
 Agency performance sample of ppt
Presenting agency performance sample of ppt. This is a agency performance sample of ppt. This is a four stage process. The stages in this process are tra score, brand safety, viewability, industry snapshot, ad fraud.
-
 Core strategic audience ppt design templates
Presenting core strategic audience ppt design templates. This is a core strategic audience ppt design templates. This is a five stage process. The stages in this process are business, marketing, finance, management, strategy.
-
 Media budget powerpoint slides
Presenting media budget powerpoint slides. This is a media budget powerpoint slides. This is a seven stage process. The stages in this process are donut, strategy, management, finance, business.
-
 Lead scoring ppt infographic template
Presenting lead scoring ppt infographic template. This is a lead scoring ppt infographic template. This is a six stage process. The stages in this process are measurable roi on lead generation program, increased conversion rates from qualified lead to opportunity, increased sales productivity and effectiveness, better alignment of marketing and sales efforts, better forecast and pipeline visibility, shortened sales cycle.
-
 Lead scoring ppt inspiration
Presenting lead scoring ppt inspiration. This is a lead scoring ppt inspiration. This is a four stage process. The stages in this process are projects completed, number of scoring rules, number of dimensions, adoption of lead scoring solutions chosen.
-
 Marketing reach by channels ppt samples
Presenting marketing reach by channels ppt samples. This is a marketing reach by channels ppt samples. This is a seven stage process. The stages in this process are which marketing channel is growing fastest, strategy, financial, business, management.
-
 Business model template 2 powerpoint slide template
Presenting business model template 2 powerpoint slide template. This is a business model template 2 powerpoint slide template. This is a three stage process. The stages in this process are percentage, process, business, marketing, strategy, success.
-
 Business model template 2 powerpoint slide themes
Presenting business model template 2 powerpoint slide themes. This is a business model template 2 powerpoint slide themes. This is a two stage process. The stages in this process are business, percentage, process, marketing, strategy, success.
-
 Financial statement powerpoint presentation templates
Stunning financial statement PowerPoint design. Fit to be used with Google slides. Replace the images, text and the content in the slide design. Change the size, style and orientation of the slides. Use your company’s name or brand name to make it your own presentation template. Beneficial for managers, professors, marketers, etc. Possess great quality for better understanding and error-free performance. Flexible option for conversion in PDF or JPG formats. Available in Widescreen format also. Useful for making business plan and strategies.
-
 How well spend the money powerpoint slide background
Presenting how well spend the money powerpoint slide background. This is a how well spend the money powerpoint slide background. This is a one stage process. The stages in this process are icons, process, business, marketing, strategy, success, management.
-
 How well spend the money powerpoint slide clipart
Presenting how well spend the money powerpoint slide clipart. This is a how well spend the money powerpoint slide clipart. This is a one stage process. The stages in this process are icons, process, business, marketing, strategy, success, management.
-
 How well spend the money ppt background graphics
Presenting how well spend the money ppt background graphics. This is a how well spend the money ppt background graphics. This is a one stage process. The stages in this process are business, marketing, strategy, success, management.
-
 How well spend the money ppt diagrams
Presenting how well spend the money ppt diagrams. This is a how well spend the money ppt diagrams. This is a one stage process. The stages in this process are how well spend the money.
-
 Lead scoring ppt examples professional
Presenting lead scoring ppt examples professional. This is a lead scoring ppt examples professional. This is a six stage process. The stages in this process are measurable roi on lead generation program, increased conversion rates from qualified lead to opportunity, increased sales productivity and effectiveness, shortened sales.
-
 Lead scoring ppt images
Presenting lead scoring ppt images. This is a lead scoring ppt images. This is a four stage process. The stages in this process are adoption of lead scoring solutions chosen, projects completed, number of scoring rules, number of dimensions.
-
Presentation Design is very nice, good work with the content as well.
-
Very unique, user-friendly presentation interface.
-
Great quality product.
-
Amazing product with appealing content and design.
-
Top Quality presentations that are easily editable.
-
Best Representation of topics, really appreciable.
-
Topic best represented with attractive design.
-
Great quality product.
-
Appreciate the research and its presentable format.
-
Presentation Design is very nice, good work with the content as well.


