- Sub Categories
-
 Kpi dashboard showing employee churn key metrics and open positions
Presenting this set of slides with name - Kpi Dashboard Showing Employee Churn Key Metrics And Open Positions. This is a four stage process. The stages in this process are Human Resource, Hrm, Human Capital.
-
 Risk Management Kpi Dashboard Showing Incidents By Priority And Severity
Presenting this set of slides with name - Risk Management Kpi Dashboard Showing Incidents By Priority And Severity. This is a four stage process. The stages in this process are Risk Management, Risk Assessment, Project Risk.
-
 Engineering procurement and construction kpi having compliance rate
Presenting this set of slides with name - Engineering Procurement And Construction Kpi Having Compliance Rate. This is a three stage process. The stages in this process are Engineering, Procurement And Construction, Construction Management, Engineering, Purchasing And Construction .
-
 Engineering procurement and construction kpi showing production volume and quantity ordered
Presenting this set of slides with name - Engineering Procurement And Construction Kpi Showing Production Volume And Quantity Ordered. This is a four stage process. The stages in this process are Engineering, Procurement And Construction, Construction Management, Engineering, Purchasing And Construction .
-
 Donut pie chart ppt visual aids gallery
Presenting this set of slides with name - Donut Pie Chart Ppt Visual Aids Gallery. This is a five stage process. The stages in this process are Business, Marketing, Percentage, Chart, Process.
-
 Financial ppt visual aids files
Presenting this set of slides with name - Financial Ppt Visual Aids Files. This is a three stage process. The stages in this process are Business, Marketing, Percentage, Maximum, Medium, Minimum, Financial.
-
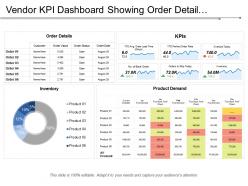 Vendor kpi dashboard showing order detail inventory and orders to ship today
Presenting this set of slides with name - Vendor Kpi Dashboard Showing Order Detail Inventory And Orders To Ship Today. This is a four stage process. The stages in this process are Vendor, Supplier, Retailer.
-
 Vendor kpi dashboard showing role holder alerts and specialization chart
Presenting Vendor KPI Dashboard Showing Role Holder Alerts And Specialization Chart Pictures PPT slide. This presentation design has been professionally designed, is fully editable in PowerPoint and is compatible with Google slides as well. The font type, font size, colors of the diagrams, background color are customizable and the company logo can be added too. High quality graphs, charts, tables and icons ensure that there is no deteriorating in quality on enlarging their size. Fast download at click of a button.
-
 Vendor kpi dashboard showing supplier compliance stats and procurement cycle time
Presenting this set of slides with name - Vendor Kpi Dashboard Showing Supplier Compliance Stats And Procurement Cycle Time. This is a four stage process. The stages in this process are Vendor, Supplier, Retailer.
-
 Donut pie chart powerpoint slide information
Presenting this set of slides with name - Donut Pie Chart Powerpoint Slide Information. This is a three stage process. The stages in this process are Business, Marketing, Chart, Percentage, Strategy.
-
 Donut pie chart ppt diagrams
Presenting this set of slides with name - Donut Pie Chart Ppt Diagrams. This is a four stage process. The stages in this process are Donut, Finance, Marketing, Planning, Analysis.
-
 Audit kpi dashboard of operating systems manufacturer report and model report
Presenting this set of slides with name - Audit Kpi Dashboard Of Operating Systems Manufacturer Report And Model Report. This is a five stage process. The stages in this process are Audit, Examine, Survey.
-
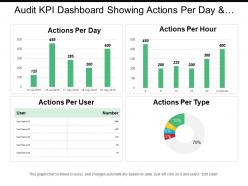 Audit kpi dashboard showing actions per day and actions per hour
Presenting this set of slides with name - Audit Kpi Dashboard Showing Actions Per Day And Actions Per Hour. This is a five stage process. The stages in this process are Audit, Examine, Survey.
-
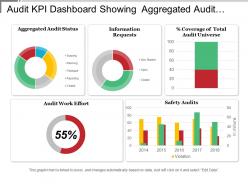 Audit kpi dashboard showing aggregated audit status and audit work effort
Presenting this set of slides with name - Audit Kpi Dashboard Showing Aggregated Audit Status And Audit Work Effort. This is a five stage process. The stages in this process are Audit, Examine, Survey.
-
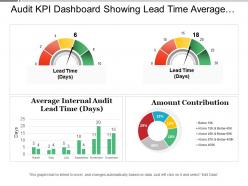 Audit kpi dashboard showing lead time average entry variance and amount contribution
Presenting this set of slides with name - Audit Kpi Dashboard Showing Lead Time Average Entry Variance And Amount Contribution. This is a four stage process. The stages in this process are Audit, Examine, Survey.
-
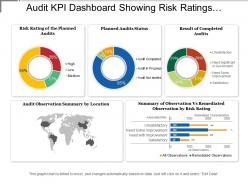 Audit kpi dashboard showing risk ratings planned audit status
Presenting this set of slides with name - Audit Kpi Dashboard Showing Risk Ratings Planned Audit Status. This is a five stage process. The stages in this process are Audit, Examine, Survey.
-
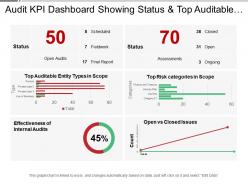 Audit kpi dashboard showing status and top auditable entity types
Presenting this set of slides with name - Audit Kpi Dashboard Showing Status And Top Auditable Entity Types. This is a six stage process. The stages in this process are Audit, Examine, Survey.
-
 Social media audit kpi dashboard showing followers activity summary and activity leads
This PPT template is very useful for your business PowerPoint presentation. It is fully editable and has editable features like editable font, font size, font color, etc. There are many shapes to choose from like squares, triangles, circles, rectangles, pentagon and many more shapes in order to edit this presentation in PowerPoint. All the images in this PPT are 100% editable. The excel-linked charts in this PPT template can also be edited with ease. It can be viewed and saved in JPG or PDF format. It is fully compatible with Google slides as well.
-
 Call center kpi dashboard showing abandoned calls group calls group statistics
Presenting this set of slides with name - Call Center Kpi Dashboard Showing Abandoned Calls Group Calls Group Statistics. This is a four stage process. The stages in this process are Call Center Agent, Customer Care, Client Support.
-
 Call center kpi dashboard showing satisfaction index customer retention
Presenting this set of slides with name - Call Center Kpi Dashboard Showing Satisfaction Index Customer Retention. This is a five stage process. The stages in this process are Call Center Agent, Customer Care, Client Support.
-
 Call center kpi dashboard showing total revenue customer satisfaction costs per support
Presenting this set of slides with name - Call Center Kpi Dashboard Showing Total Revenue Customer Satisfaction Costs Per Support. This is a four stage process. The stages in this process are Call Center Agent, Customer Care, Client Support.
-
 Maintenance kpi dashboard showing issue trends and infrastructure health
Presenting this set of slides with name - Maintenance Kpi Dashboard Showing Issue Trends And Infrastructure Health. This is a three stage process. The stages in this process are Maintenance, Preservation, Conservation.
-
 Maintenance kpi dashboard showing operations monitor and past due operations
Presenting this set of slides with name - Maintenance Kpi Dashboard Showing Operations Monitor And Past Due Operations. This is a three stage process. The stages in this process are Maintenance, Preservation, Conservation.
-
 Maintenance kpi dashboard showing overdue work orders by priority and department
Presenting this set of slides with name - Maintenance Kpi Dashboard Showing Overdue Work Orders By Priority And Department. This is a four stage process. The stages in this process are Maintenance, Preservation, Conservation.
-
 Maintenance kpi dashboard showing schedule compliance and mttr
Presenting this set of slides with name - Maintenance Kpi Dashboard Showing Schedule Compliance And Mttr. This is a nine stage process. The stages in this process are Maintenance, Preservation, Conservation.
-
 Project status kpi dashboard snapshot showing progress and risk matrix
Presenting project status KPI dashboard snapshot showing progress and risk matrix PowerPoint template. Simple data input like company logo, name or trademark. This PowerPoint theme is fully supported by Google slides. Picture quality of these slides does not change even when projected on large screen. This formats can be easily changed to JPEG and PDF applications. This template is suitable for marketing, sales persons, business managers and entrepreneurs. Adjust PPT layout, font, text and color as per your necessity
-
 Key financial ratios template 1 powerpoint slide background designs
Presenting this set of slides with name - Key Financial Ratios Template 1 Powerpoint Slide Background Designs. This is a four stage process. The stages in this process are Business, Donut Chart, Finance, Marketing, Strategy, Analysis.
-
 Compliance and legal kpi dashboard showing compliance issues and resolution time
Presenting this set of slides with name - Compliance And Legal Kpi Dashboard Showing Compliance Issues And Resolution Time. This is a three stage process. The stages in this process are Compliance And Legal, Legal Governance, Risk Management.
-
 Compliance and legal kpi dashboard showing total matter value
Presenting this set of slides with name - Compliance And Legal Kpi Dashboard Showing Total Matter Value. This is a six stage process. The stages in this process are Compliance And Legal, Legal Governance, Risk Management.
-
 Financing ppt inspiration graphics tutorials
Presenting this set of slides with name - Financing Ppt Inspiration Graphics Tutorials. This is a two stage process. The stages in this process are Financing, Investment Terms, Dollar, Business, Icons.
-
 Location ppt file slides
Presenting this set of slides with name - Location Ppt File Slides. This is a three stage process. The stages in this process are Asia, South America, Australia And Oceania, Location, Geographical.
-
 Silhouettes ppt show themes
Presenting this set of slides with name - Silhouettes Ppt Show Themes. This is a two stage process. The stages in this process are Silhouette, People, Communication, Business, Marketing.
-
 Financial powerpoint slide designs download
Presenting this set of slides with name - Financial Powerpoint Slide Designs Download. This is a three stage process. The stages in this process are Financial, Minimum, Medium, Maximum.
-
 Financial ratio kpi dashboard showing cost of office space per employee and sales per employee
Presenting this set of slides with name - Financial Ratio Kpi Dashboard Showing Cost Of Office Space Per Employee And Sales Per Employee. This is a two stage process. The stages in this process are Accounting Ratio, Financial Statement, Financial Ratio.
-
 Financial ratio kpi dashboard snapshot showing liquidity ratio and profitability ratio
Presenting this set of slides with name - Financial Ratio Kpi Dashboard Snapshot Showing Liquidity Ratio And Profitability Ratio. This is a three stage process. The stages in this process are Accounting Ratio, Financial Statement, Financial Ratio.
-
 Financial performance kpi dashboard showing asset allocation balance sheet
Presenting this set of slides with name - Financial Performance Kpi Dashboard Showing Asset Allocation Balance Sheet. This is a two stage process. The stages in this process are Financial Performance, Financial Report, Financial Review.
-
 Financial performance kpi dashboard showing burn rate opex ratio gross profit
Presenting this set of slides with name - Financial Performance Kpi Dashboard Showing Burn Rate Opex Ratio Gross Profit. This is a four stage process. The stages in this process are Financial Performance, Financial Report, Financial Review.
-
 Financial performance kpi dashboard showing payroll headcount ratio cost per lead
Presenting this set of slides with name - Financial Performance Kpi Dashboard Showing Payroll Headcount Ratio Cost Per Lead. This is a seven stage process. The stages in this process are Financial Performance, Financial Report, Financial Review.
-
 Key financial ratios powerpoint slide introduction
Presenting this set of slides with name - Key Financial Ratios Powerpoint Slide Introduction. This is a four stage process. The stages in this process are Return On Assets, Return On Equity, Return On Investment, Debt To Equity Ratio, Current Ratio.
-
 Workforce kpi dashboard showing number of employee overhead ratio and salary
Presenting this set of slides with name - Workforce Kpi Dashboard Showing Number Of Employee Overhead Ratio And Salary. This is a three stage process. The stages in this process are Staff, Personnel, Workforce.
-
 Workforce kpi dashboard showing part time vs full time employee
Presenting this set of slides with name - Workforce Kpi Dashboard Showing Part Time Vs Full Time Employee. This is a four stage process. The stages in this process are Staff, Personnel, Workforce.
-
 Workforce kpi dashboard showing resignation rate manager instability rate and performance workflow process
Presenting this set of slides with name - Workforce Kpi Dashboard Showing Resignation Rate Manager Instability Rate And Performance Workflow Process. This is a six stage process. The stages in this process are Staff, Personnel, Workforce.
-
 Workforce kpi dashboard showing visibility headcount and direct compensation change
Presenting this set of slides with name - Workforce Kpi Dashboard Showing Visibility Headcount And Direct Compensation Change. This is a five stage process. The stages in this process are Staff, Personnel, Workforce.
-
 Workforce planning kpi dashboard showing salary merit bonus headcount and performance
Presenting this set of slides with name - Workforce Planning Kpi Dashboard Showing Salary Merit Bonus Headcount And Performance. This is a five stage process. The stages in this process are Staff, Personnel, Workforce.
-
 Use of funds ppt examples slides
Presenting this set of slides with name - Use Of Funds Ppt Examples Slides. This is a four stage process. The stages in this process are Product Development, Marketing, New Hires, Operational Cost, Relevant Example.
-
 Comparison ppt icon examples
Presenting this set of slides with name - Comparison Ppt Icon Examples. This is a two stage process. The stages in this process are Business, Marketing, Male, Female, Comparison, Percentage.
-
 Comparison ppt inspiration slides
Presenting this set of slides with name - Comparison Ppt Inspiration Slides. This is a two stage process. The stages in this process are Male, Female, Finance.
-
 Key financial ratios ppt show designs download
Presenting this set of slides with name - Key Financial Ratios Ppt Show Designs Download. This is a four stage process. The stages in this process are Return On Assets, Return On Equity, Return On Investment, Debt To Equity Ratio, Current Ratio.
-
 Donut pie chart ppt background designs
PPT is compatible with numerous format options like JPEG, JPG or PDF. Ease of modifying PowerPoint icons, colors, shades and orientation. There is freedom to customize it with company name and logo. You have access to inclusion and exclusion of contents as per specific needs of any business. High resolution images with splendid picture quality ensure zero issue of blur image, when projected on wide screen. Presentation is compatible with multiple software options. Widely used by business professionals, students, teachers, business analysts and strategists.
-
 Entertainment recreation and arts kpi dashboard average annual expenditure and time spent
Presenting this set of slides with name - Entertainment Recreation And Arts Kpi Dashboard Average Annual Expenditure And Time Spent. This is a three stage process. The stages in this process are Entertainment, Recreation And Arts, Attractions, Culture, Entertainment.
-
 Entertainment recreation and arts kpi dashboard distribution of video game sales
Presenting this set of slides with name - Entertainment Recreation And Arts Kpi Dashboard Distribution Of Video Game Sales. This is a four stage process. The stages in this process are Entertainment, Recreation And Arts, Attractions, Culture, Entertainment.
-
 Entertainment recreation and arts kpi dashboard revenue players and payers
Presenting this set of slides with name - Entertainment Recreation And Arts Kpi Dashboard Revenue Players And Payers. This is a four stage process. The stages in this process are Entertainment, Recreation And Arts, Attractions, Culture, Entertainment.
-
 Entertainment recreation and arts kpi dashboard showing active daily players and today tournaments
Presenting this set of slides with name - Entertainment Recreation And Arts Kpi Dashboard Showing Active Daily Players And Today Tournaments. This is a four stage process. The stages in this process are Entertainment, Recreation And Arts, Attractions, Culture, Entertainment.
-
 Entertainment recreation and arts kpi dashboard showing digital media sources of capital
Presenting this set of slides with name - Entertainment Recreation And Arts Kpi Dashboard Showing Digital Media Sources Of Capital. This is a three stage process. The stages in this process are Entertainment, Recreation And Arts, Attractions, Culture, Entertainment.
-
 Entertainment recreation and arts kpi dashboard showing of media usage and time spent per user
Presenting this set of slides with name - Entertainment Recreation And Arts Kpi Dashboard Showing Of Media Usage And Time Spent Per User. This is a four stage process. The stages in this process are Entertainment, Recreation And Arts, Attractions, Culture, Entertainment.
-
 Education and research kpi dashboard by country language and education types
Presenting education and research KPI dashboard by country language and education types PPT slide. The different language PPT template designed by the professional team of SlideTeam. The different country language report slide is fully editable in PowerPoint. The country language KPI report PowerPoint slide is compatible with Google Slide so a user can share this language dashboard slide with others. A user can make changes in the font size, font type, color as well as dimensions of the education distribution PPT template as per the requirement. You may edit the value in the new research program metric report template as the slide gets linked with the Excel sheet. .
-
 Education and research kpi dashboard snapshot showing enrolment and sap
Presenting education and research KPI dashboard snapshot showing enrolment and SAP PPT slide. The enrolment and SAP analytic KPI dashboard PowerPoint template designed by the professional team of SlideTeam. The SAP package KPI report slide is fully editable in PowerPoint. The research SAP dashboard presentation slide is compatible with Google Slide so a user can share this SAP analytic dashboard slide with others. A user can make changes in the font size, font type, color as well as dimensions of the SAP analytics cloud business content dashboard PowerPoint template as per the requirement.
-
 Education and research kpi dashboard snapshot showing enrolment breakdown
Presenting education and research KPI dashboard snapshot showing enrolment breakdown PPT slide. The student enrolment dashboard PowerPoint slide designed by the professional team of SlideTeam. The enrolment page KPI report template is fully editable in PowerPoint. The research enrolment KPI report PPT template is compatible with Google Slide so a user can share this enrolment dashboard slide with others. A user can make changes in the font size, font type, color as well as dimensions of the campus and college dashboard slide as per the requirement. You may edit the value in the enrollment reporting system dashboard template as the slide gets linked with the Excel sheet.
-
 Education and research kpi dashboard showing response timeline and researcher engagement
Presenting education and research KPI dashboard showing response timeline and researcher engagement PPT slide. The education report PPT slide designed by professional team of SlideTeam. The research grant KPI dashboard presentation template is customizable in PowerPoint. The student attendance rate KPI report PowerPoint slide is also compatible with Google Slide so a user can share this template with others. A user can make changes in the font size, font type, color as well as dimensions of the education finance metric dashboard template as per the requirement. You may edit the value in the education KPI dashboard PowerPoint template as the slide gets linked with the Excel sheet. .
-
 Supply chain management kpi dashboard showing inventory accuracy and turnover
Presenting this set of slides with name - Supply Chain Management Kpi Dashboard Showing Inventory Accuracy And Turnover. This is a five stage process. The stages in this process are Demand Forecasting, Predicting Future Demand, Supply Chain Management.
-
Enough space for editing and adding your own content.
-
Excellent products for quick understanding.
-
Perfect template with attractive color combination.
-
Illustrative design with editable content. Exceptional value for money. Highly pleased with the product.
-
Visually stunning presentation, love the content.
-
Great quality slides in rapid time.
-
Unique design & color.
-
Best way of representation of the topic.
-
Great product with highly impressive and engaging designs.
-
Editable templates with innovative design and color combination.


