- Sub Categories
-
 Marketing reach by channels ppt examples
Presenting marketing reach by channels ppt examples. This is a marketing reach by channels ppt examples. This is a two stage process. The stages in this process are which marketing channel is growing fastest, influencer engagement use cases.
-
 New method for expenditure management sample ppt presentation
Presenting new method for expenditure management sample ppt presentation. This is a new method for expenditure management sample ppt presentation. This is a one stage process. The stages in this process are business, process, marketing, success, icons, strategy, management.
-
 Sales breakdown powerpoint slide influencers
Presenting sales breakdown powerpoint slide influencers. This is a sales breakdown powerpoint slide influencers. This is a four stage process. The stages in this process are railway stations and other, downtown hotel and resorts, cruise liners and, seaports, north america, south america, central america and caribbean, eurasia and asia, europe, africa.
-
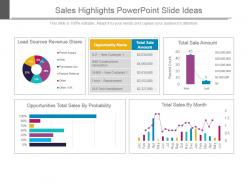 Sales highlights powerpoint slide ideas
Presenting sales highlights powerpoint slide ideas. This is a sales highlights powerpoint slide ideas. This is a five stage process. The stages in this process are lead sources revenue share, opportunity name, total sale amount, total sale amount, opportunities total sales by probability, total sales by month.
-
 Management of team dynamics skills powerpoint slide information
Presenting management of team dynamics skills powerpoint slide information. This is a management of team dynamics skills powerpoint slide information. This is a four stage process. The stages in this process are noticing when the group avoid a topic, recognizing and understanding the stages of team development, noticing when the group avoid a topic, sensing individuals feelings.
-
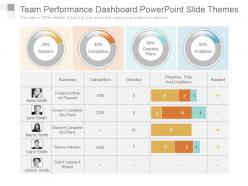 Team performance dashboard powerpoint slide themes
Presenting team performance dashboard powerpoint slide themes. This is a team performance dashboard powerpoint slide themes. This is a four stage process. The stages in this process are summary, completion, overdue, progress, plan and problems, reward, finished what he planned, doesnt complete his plans, doesnt complete his plans, shows initiative, didnt submit a report.
-
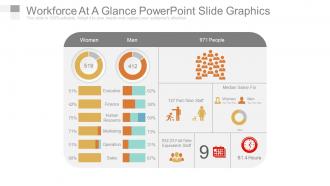 Workforce at a glance powerpoint slide graphics
Presenting this workforce analysis and planning PowerPoint presentation slide. The PPT slide is available in both widescreen size (16:9) and standard screen size (4:3). This template has been designed by our team of qualified designers and is editable in PowerPoint. You can change the font type, font size, font style, icons and background color of the slide as per your requirement. It is convenient to insert your company name and logo in the slide. You can remove the sample content in text placeholders and add your presentation’s content. The slide is fully compatible with Google slides and can be saved in JPG or PDF format easily. High resolution graphic image ensures that there is no deterioration in quality on enlarging the size of the image. You can download the slide quickly at the click of a button.
-
 Team performance dashboard snapshot ppt icon
Presenting team performance dashboard ppt icon. This is a team performance dashboard snapshot ppt icon. This is a four stage. The Stages in this process are john smith, anita smith, carol smith, marry smith, peter smith, reward, completion, overdue plans, problems, summary, finished what he planned, doesn?t complete his plans, doesnt complete his plans, shows initiative, didnt submit a report, completion, overdue, progress, plan and problems, reward.
-
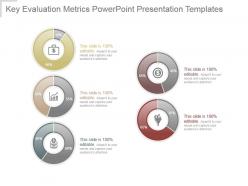 Key evaluation metrics powerpoint presentation templates
Presenting key evaluation metrics powerpoint presentation templates. This is a key evaluation metrics powerpoint presentation templates. This is a five stage process. The stages in this process are icons, planning, business, finance, marketing.
-
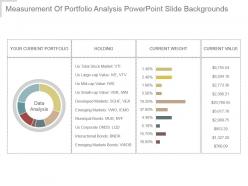 Measurement of portfolio analysis powerpoint slide backgrounds
Presenting measurement of portfolio analysis powerpoint slide backgrounds. This is a measurement of portfolio analysis powerpoint slide backgrounds. This is a seven stage process. The stages in this process are data analysis, your current portfolio, holding, current weight, current value.
-
 Portfolio evaluation example ppt presentation
Presenting portfolio evaluation example ppt presentation. This is a portfolio evaluation example ppt presentation. This is a two stage process. The stages in this process are peso govt debt securities, foreign govt debt securities, peso corporate debt securities, dollar corporate debt securities, equity.
-
 Portfolio revision powerpoint slide background picture
Presenting portfolio revision powerpoint slide background picture. This is a portfolio revision powerpoint slide background picture. This is a two stage process. The stages in this process are stocks, current portfolio, new portfolio.
-
 Key evaluation metrics powerpoint layout
Presenting key evaluation metrics powerpoint layout. This is a key evaluation metrics powerpoint layout. This is a five stage process. The stages in this process are icons, business, marketing, presentation, management.
-
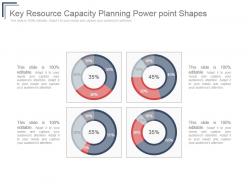 Key resource capacity planning power point shapes
Presenting key resource capacity planning power point shapes. This is a key resource capacity planning power point shapes. This is a four stage process. The stages in this process are success, business, marketing, presentation, management.
-
 Key resource capacity planning powerpoint presentation
Presenting key resource capacity planning powerpoint presentation. This is a key resource capacity planning powerpoint presentation. This is a five stage process. The stages in this process are success, business, marketing, presentation, management.
-
 Measurement of portfolio analysis powerpoint slide
Presenting measurement of portfolio analysis PowerPoint slide. This layout is Compatible with Google slides. Easy to put in company logo, trademark or name; accommodate words to support the key points. Images do no blur out even when they are projected on large screen.PPT template can be utilized by sales and marketing teams and business managers. Instantly downloadable slide and supports formats like JPEG and PDF. Adjust colors, text and fonts as per your business requirements.
-
 Portfolio evaluation powerpoint show
Presenting portfolio evaluation powerpoint show. This is a portfolio evaluation powerpoint show. This is a two stage process. The stages in this process are peso govt debt securities, foreign govt debt securities, peso corporate debt securities, dollar corporate debt securities, equity.
-
 Portfolio revision powerpoint slide background
Presenting portfolio revision powerpoint slide background. This is a portfolio revision powerpoint slide background. This is a two stage process. The stages in this process are current portfolio, new portfolio.
-
 Key evaluation metrics powerpoint slide background
Presenting key evaluation metrics powerpoint slide background. This is a key evaluation metrics powerpoint slide background. This is a five stage process. The stages in this process are business, process, marketing, strategy, success, analysis.
-
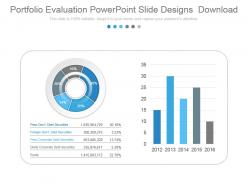 Portfolio evaluation powerpoint slide designs download
Presenting portfolio evaluation powerpoint slide designs download. This is a portfolio evaluation powerpoint slide designs download. This is a two stage process. The stages in this process are peso govt debt securities, foreign govt debt securities, peso corporate debt securities, dollar corporate debt securities, equity.
-
 Portfolio revision powerpoint shapes
Presenting portfolio revision powerpoint shapes. This is a portfolio revision powerpoint shapes. This is a two stage process. The stages in this process are current portfolio, new portfolio.
-
 Resource capacity planning powerpoint guide
Presenting resource capacity planning powerpoint guide. This is a resource capacity planning powerpoint guide. This is a five stage process. The stages in this process are business, process, marketing, management, strategy, success.
-
 Resource capacity planning powerpoint ideas
Presenting resource capacity planning powerpoint ideas. This is a resource capacity planning powerpoint ideas. This is a three stage process. The stages in this process are percentage, business, process, marketing, management, strategy, success.
-
 Selection of the optimal portfolio powerpoint slide designs
Presenting selection of the optimal portfolio powerpoint slide designs. This is a selection of the optimal portfolio powerpoint slide designs. This is a three stage process. The stages in this process are business, process, marketing, management, strategy, success.
-
 Current quarter portfolio ppt images
Presenting current quarter portfolio ppt images. This is a current quarter portfolio ppt images. This is a six stage process. The stages in this process are pie, business, marketing, finance, management.
-
 Team members performance overview powerpoint slide backgrounds
Presenting team members performance overview powerpoint slide backgrounds. This is a team members performance overview powerpoint slide backgrounds. This is a four stage process. The stages in this process are team members, performance overview, business, strategy, marketing, management, presentation.
-
 Team performance dashboard powerpoint slide deck
Presenting team performance dashboard powerpoint slide deck. This is a team performance dashboard powerpoint slide deck. This is a four stage process. The stages in this process are completion, overdue plans, problems, summary, completion, overdue, progress, plan and problems, reward.
-
 Revenue generation company performance ppt sample download
Presenting revenue generation company performance ppt sample download. This is a revenue generation company performance ppt sample download. This is a four stage process. The stages in this process are business, management, analysis, strategy, success.
-
 Pie chart industry cost structure ppt slide
Presenting pie chart industry cost structure ppt slide. This is a pie chart industry cost structure ppt slide. This is a seven stage process. The stages in this process are profit, marketing, rent and utilities, purchases, wages, other, depreciation.
-
 Competitors market share division powerpoint slide
Presenting competitors market share division powerpoint slide. This is a competitors market share division powerpoint slide. This is a six stage process. The stages in this process are competitor, percentage, marketing, strategy, business, success.
-
 Market cost distribution pie chart ppt slide
Presenting market cost distribution pie chart ppt slide. This is a market cost distribution pie chart ppt slide. This is a seven stage process. The stages in this process are purchases, wages, other, rent and utilities, marketing, profit, depreciation.
-
 Media budget sample ppt presentation
Presenting media budget sample ppt presentation. Presenting media budget sample ppt presentation. This is a media budget sample ppt presentation. This is a five stage process. The stages in this process are business, finance, process, strategy, marketing, management.
-
 Media budget ppt example
Presenting media budget ppt example. This is a media budget ppt example. This is a five stage process. The stages in this process are finance, donut, business, success, marketing, strategy.
-
 Marketing expenditures pie chart powerpoint slide deck
Presenting marketing expenditures pie chart powerpoint slide deck. This is a marketing expenditures pie chart powerpoint slide deck. This is a five stage process. The stages in this process are business, finance, process, strategy, chart and graph.
-
 Brand development dashboard ppt slide themes
Presenting brand development dashboard ppt slide themes. This is a brand development dashboard ppt slide themes. This is a three stage process. The stages in this process are implementation, discovery, conception.
-
 Doughnut chart for data visualization comparison of percentages powerpoint slides design
Presenting doughnut chart for data visualization comparison of percentages powerpoint slides design. This is a doughnut chart for data visualization comparison of percentages powerpoint slides design. This is a four stage process. The stages in this process are business, marketing, financial, percentage, increase.
-
 Doughnut chart for numbers comparison data analysis slide powerpoint topics
Presenting doughnut chart for numbers comparison data analysis slide powerpoint topics. This is a doughnut chart for numbers comparison data analysis slide powerpoint topics. This is a six stage process. The stages in this process are circular, process, percentage, financial, business.
-
 Financial slide showing budget allocation ppt background
Presenting financial slide showing budget allocation ppt background. This is a financial slide showing budget allocation ppt background. This is a seven stage process. The stages in this process are circular, process, percentage, financial, budget.
-
 Cost structure analysis powerpoint slide deck
Presenting cost structure analysis powerpoint slide deck. This is a cost structure analysis powerpoint slide deck. This is a seven stage process. The stages in this process are wages, purchases, rent and utilities, depreciation, other, profit, marketing.
-
 Relative market share of different competitors ppt diagrams
Presenting relative market share of different competitors ppt diagrams. This is a relative market share of different competitors ppt diagrams. This is a six stage process. The stages in this process are competitor, market share.
-
 Brand marketing campaign report powerpoint guide
Presenting brand marketing campaign report powerpoint guide. This is a brand marketing campaign report powerpoint guide. This is a four stage process. The stages in this process are brand safety, industry snapshot, viewability, tra score, ad fraud.
-
 Campaign budget plan pie chart powerpoint ideas
Presenting campaign budget plan pie chart powerpoint ideas. This is a campaign budget plan pie chart powerpoint ideas. This is a seven stage process. The stages in this process are business, success, finance, strategy, management.
-
 Pie chart for user behavior studies presentation slide
Presenting pie chart for user behavior studies presentation slide. This is a pie chart for user behavior studies presentation slide. This is a six stage process. The stages in this process are business, success, strategy, finance, circular.
-
 Circular process business networking powerpoint design
Presenting circular process business networking powerpoint design. This is a circular process business networking powerpoint design. This is a five stage process. The stages in this process are circular, process, marketing, business, management.
-
 Big data business benefits pie charts sample of ppt presentation
Presenting big data business benefits pie charts sample of ppt presentation. This is a big data business benefits pie charts sample of ppt presentation. This is a four stage process. The stages in this process are increased efficiency, improved customer experience and engagement, better business decision making, achieved financial savings.
-
 Business operational plan pie charts powerpoint presentation
Presenting business operational plan pie charts powerpoint presentation. This is a business operational plan pie charts powerpoint presentation. This is a three stage process. The stages in this process are business, operation, plan, percentage, financial.
-
 Business growth comparison pie chart powerpoint topics
Presenting business growth comparison pie chart powerpoint topics. This is a business growth comparison pie chart powerpoint topics. This is a two stage process. The stages in this process are business, meter, measure, growth, comparison.
-
 Technology big data benefits pie chart ppt templates
Presenting technology big data benefits pie chart ppt templates. This is a technology big data benefits pie chart ppt templates. This is a four stage process. The stages in this process are increased efficiency, better business decision making, improved customer experience and engagement, achieved financial savings.
-
 Industry analysis framework pie chart powerpoint slide show
Presenting industry analysis framework pie chart powerpoint slide show. This is a industry analysis framework pie chart powerpoint slide show. This is a six stage process. The stages in this process are industry analysis framework pie chart,market analysis market share brand.
-
 Project cost feasibility study ppt example
Presenting project cost feasibility study ppt example. This is a project cost feasibility study ppt example. This is a two stage process. The stages in this process are project cost feasibility study,our cost.
-
 Business model assessment powerpoint graphics
Presenting business model assessment powerpoint graphics. This is a business model assessment powerpoint graphics. This is a three stage process. The stages in this process are business model, assessment, financial, presentation.
-
 Spending plan pie chart ppt slide examples
Presenting spending plan pie chart ppt slide examples. This is a spending plan pie chart ppt slide examples. This is a twelve stage process. The stages in this process are spending plan, pie chart, presentation, process, icons.
-
 Employees who leave within first 6 months powerpoint shapes
Presenting employees who leave within first 6 months powerpoint shapes. This is a employees who leave within first 6 months powerpoint shapes. This is a three stage process. The stages in this process are employees left job within the first 6 months, felt their boss was a jerk, work was different than they expected, changed their mind on work type.
-
 Managers training hours doughnut chart powerpoint slide
Presenting managers training hours doughnut chart powerpoint slide. This is a managers training hours doughnut chart powerpoint slide. This is a four stage process. The stages in this process are open positions by divisions, key metrics, total employees, employee churn.
-
 Types of employee training provided doughnut chart powerpoint slide clipart
Presenting types of employee training provided doughnut chart powerpoint slide clipart. This is a types of employee training provided doughnut chart powerpoint slide clipart. This is a four stage process. The stages in this process are in person, hybrid, on-line, hands on.
-
 Why people leave an organization pie chart powerpoint slide deck samples
Presenting why people leave an organization pie chart powerpoint slide deck samples. This is a why people leave an organization pie chart powerpoint slide deck samples. This is a six stage process. The stages in this process are management general work environment, unsatisfied with pay and benefits, lack of fit to job, lack of job security, lack of flexibility scheduling, limited career advancement promotional opportunities.
-
 Sales dashboard powerpoint slide show
Presenting sales dashboard powerpoint slide show. This is a sales dashboard powerpoint slide show. This is a two stage process. The stages in this process are customer retention, sales chart, yield from new and existing customers, business sales report.
-
 Employee satisfaction by income level doughnut chart ppt slide
Presenting employee satisfaction by income level doughnut chart ppt slide. This is a employee satisfaction by income level doughnut chart ppt slide. This is a four stage process. The stages in this process are employee satisfaction with workforce, satisfaction by income level, 55 percent yes, neutral, 15 percent no, 45 percent are either dissatisfied or neutral.
-
 Specialist training hours employee comparison chart example of ppt
Presenting specialist training hours employee comparison chart example of ppt. This is a specialist training hours employee comparison chart example of ppt. This is a five stage process. The stages in this process are training by category, technicians, executives, supervisor, managers, specialists.
-
 Top 3 reasons why employees leave early sample of ppt
Presenting top 3 reasons why employees leave early sample of ppt. This is a top 3 reasons why employees leave early sample of ppt. This is a two stage process. The stages in this process are decided the work was something they didnt want to do, were given different work than they expected from the interview, felt their boss was a jerk, top 3 reasons why they left, barely on board, portion of people who have left a job within the first six month.
-
Very unique, user-friendly presentation interface.
-
The content is very helpful from business point of view.
-
Best way of representation of the topic.
-
Content of slide is easy to understand and edit.
-
Unique and attractive product design.
-
Professional and unique presentations.
-
The content is very helpful from business point of view.
-
Attractive design and informative presentation.
-
Good research work and creative work done on every template.
-
Excellent design and quick turnaround.


