Data Driven Sliding Bars and and other powerpoint diagrams and templates
- Sub Categories
-
 Manpower supply horizontal chart covering total hiring count at particular round
Presenting this set of slides with name - Manpower Supply Horizontal Chart Covering Total Hiring Count At Particular Round. This is a four stage process. The stages in this process are Manpower Supply, Manpower Service, Manpower Recruitment.
-
 Technical industry mobile data market drivers with percentages
Presenting this set of slides with name - Technical Industry Mobile Data Market Drivers With Percentages. This is a nine stage process. The stages in this process are Growth Drivers, Growth Opportunity, Market Drivers.
-
 Market landscape product company sites blogs seminar social sites
Presenting this set of slides with name - Market Landscape Product Company Sites Blogs Seminar Social Sites. This is a twelve stage process. The stages in this process are Current Landscape, Competitor Landscape, Market Landscape.
-
 Asset capital loans management bank revenue drivers with icons
Presenting this set of slides with name - Asset Capital Loans Management Bank Revenue Drivers With Icons. This is a eight stage process. The stages in this process are Revenue Drivers, Income Drivers, Earning Drivers.
-
 Customer retention acquisition innovation retail revenue drivers with icons
Presenting this set of slides with name - Customer Retention Acquisition Innovation Retail Revenue Drivers With Icons. This is a twelve stage process. The stages in this process are Revenue Drivers, Income Drivers, Earning Drivers.
-
 Hr dashboard employee age breakdown graph donut chart
Presenting this set of slides with name - Hr Dashboard Employee Age Breakdown Graph Donut Chart. This is a four stage process. The stages in this process are Hr Dashboard, Human Resource Dashboard, Hr Kpi.
-
 Hr dashboard employee type employee tenure
Presenting this set of slides with name - Hr Dashboard Employee Type Employee Tenure. This is a six stage process. The stages in this process are Hr Dashboard, Human Resource Dashboard, Hr Kpi.
-
 Budget forecast showing income of the various months and savings
Presenting this set of slides with name - Budget Forecast Showing Income Of The Various Months And Savings. This is a three stage process. The stages in this process are Budget Forecast, Forecast Vs Actual Budget, Plan Vs Forecast.
-
 Marketing kpi dashboard showing bounce rate average session duration
Presenting this set of slides with name - Marketing Kpi Dashboard Showing Bounce Rate Average Session Duration. This is a three stage process. The stages in this process are Marketing, Branding, Promoting.
-
 Marketing kpi dashboard snapshot showing lead funnel traffic sources key metrics
Presenting this set of slides with name - Marketing Kpi Dashboard Snapshot Showing Lead Funnel Traffic Sources Key Metrics. This is a three stage process. The stages in this process are Marketing, Branding, Promoting.
-
 Marketing kpi dashboard showing revenue per acquisition leads speed profit
Presenting this set of slides with name - Marketing Kpi Dashboard Showing Revenue Per Acquisition Leads Speed Profit. This is a three stage process. The stages in this process are Marketing, Branding, Promoting.
-
 R and d kpi dashboard showing spending this year and cost for new product
Presenting this set of slides with name - R And D Kpi Dashboard Showing Spending This Year And Cost For New Product. This is a five stage process. The stages in this process are R And D, Research And Development, Research And Technological Development.
-
 R and d kpi dashboard showing systematic discussion rate innovation engagement and sponsorship index
Presenting this set of slides with name - R And D Kpi Dashboard Showing Systematic Discussion Rate Innovation Engagement And Sponsorship Index. This is a four stage process. The stages in this process are R And D, Research And Development, Research And Technological Development.
-
 Rental and leasing kpi dashboard showing annual rent depot rental overview
Presenting this set of slides with name - Rental And Leasing Kpi Dashboard Showing Annual Rent Depot Rental Overview. This is a seven stage process. The stages in this process are Rental And Leasing, Dealing And Leasing, Rental And Engage.
-
 Information technology kpi dashboard showing project issues server status
Presenting this set of slides with name - Information Technology Kpi Dashboard Showing Project Issues Server Status. This is a six stage process. The stages in this process are Information Technology, It, Iot.
-
 Information technology kpi dashboard showing work order activity
Presenting this set of slides with name - Information Technology Kpi Dashboard Showing Work Order Activity. This is a six stage process. The stages in this process are Information Technology, It, Iot.
-
 Quality control kpi dashboard showing defects and downtime
Presenting this set of slides with name - Quality Control Kpi Dashboard Showing Defects And Downtime. This is a five stage process. The stages in this process are Quality Management, Quality Control, Quality Assurance.
-
 Quality control kpi dashboard showing test case status
Presenting this set of slides with name - Quality Control Kpi Dashboard Showing Test Case Status. This is a two stage process. The stages in this process are Quality Management, Quality Control, Quality Assurance.
-
 Resource utilisation info graphics with bars and graphs
Presenting this set of slides with name - Resource Utilisation Info Graphics With Bars And Graphs. This is a three stage process. The stages in this process are Resource Management, Resource Utilization, Resource Allocation.
-
 Resource utilization planning with task name project
Presenting this set of slides with name - Resource Utilization Planning With Task Name Project. This is a three stage process. The stages in this process are Resource Management, Resource Utilization, Resource Allocation.
-
 Engineering procurement and construction kpi dashboard showing cost of purchase order and cost reduction
You can use this PPT slideshow very easily as it is fully customizable. You can effortlessly insert or remove any diagrammatic representation from the given template. The font size, font color and font style can be easily edited. This graph PPT is linked to excel and changes automatically based on the data you enter. You can save the deck in either PDF or JPG format. To make any changes in the PPT slideshow, simply follow the instructions given in the sample slides. The size, color and orientation of all shapes are 100% customizable, so don’t waste any further time and download this presentation.
-
 Engineering procurement and construction kpi dashboard showing delivery timeline and resources
Presenting this set of slides with name - Engineering Procurement And Construction Kpi Dashboard Showing Delivery Timeline And Resources. This is a four stage process. The stages in this process are Engineering, Procurement And Construction, Construction Management, Engineering, Purchasing And Construction .
-
 Engineering procurement and construction kpi dashboard showing net project revenue per employee
Presenting this set of slides with name - Engineering Procurement And Construction Kpi Dashboard Showing Net Project Revenue Per Employee. This is a two stage process. The stages in this process are Engineering, Procurement And Construction, Construction Management, Engineering, Purchasing And Construction .
-
 Engineering procurement and construction kpi dashboard showing project summary cost and budget
Presenting this set of slides with name - Engineering Procurement And Construction Kpi Dashboard Showing Project Summary Cost And Budget. This is a four stage process. The stages in this process are Engineering, Procurement And Construction, Construction Management, Engineering, Purchasing And Construction .
-
 Social media kpi dashboard showing conversions by social network and metrics
Presenting this set of slides with name - Social Media Kpi Dashboard Showing Conversions By Social Network And Metrics. This is a five stage process. The stages in this process are Social Media, Digital Marketing, Social Marketing.
-
 Social media kpi dashboard showing facebook impression by demographic instagram key metrics
Presenting this set of slides with name - Social Media Kpi Dashboard Showing Facebook Impression By Demographic Instagram Key Metrics. This is a four stage process. The stages in this process are Social Media, Digital Marketing, Social Marketing.
-
 Social media kpi dashboard showing facebook investment returns conversion from ads
Presenting this set of slides with name - Social Media Kpi Dashboard Showing Facebook Investment Returns Conversion From Ads. This is a five stage process. The stages in this process are Social Media, Digital Marketing, Social Marketing.
-
 Social media kpi dashboard showing facebook page stats youtube channel views
Presenting this set of slides with name - Social Media Kpi Dashboard Showing Facebook Page Stats Youtube Channel Views. This is a five stage process. The stages in this process are Social Media, Digital Marketing, Social Marketing.
-
 Social media kpi dashboard showing followers facebook daily reach
SlideTeam presents the Social media KPI dashboard showing followers Facebook daily reach This slideshow is modifiable according to your needs as you can make all the required changes to it whenever you feel like. You can edit the font size and font style. These slides are fully compatible with Google Slides. You can view the presentation on both 16:9 widescreen side as well as the 4:3 standard screen size. You can save them in either JPG or PDF format.
-
 Human resources kpi dashboard showing employee number by salary staff composition
Presenting this set of slides with name - Human Resources Kpi Dashboard Showing Employee Number By Salary Staff Composition. This is a four stage process. The stages in this process are Human Resource, Hrm, Human Capital.
-
 Human resources kpi dashboard showing recruitment funnel application sources
Presenting this set of slides with name - Human Resources Kpi Dashboard Showing Recruitment Funnel Application Sources. This is a six stage process. The stages in this process are Human Resource, Hrm, Human Capital.
-
 Human resources kpi dashboard showing satisfaction survey result age breakdown
Presenting human resources KPI dashboard showing satisfaction survey result age breakdown data driven PowerPoint slide. Fit to be used with the Google slides. Replace the visuals, text and the content in the slide design. Change the size, style and orientation of the slides. Use your company’s name or brand name to make it your own presentation template. Beneficial for managers, professors, marketers, etc. Flexible option for conversion in PDF or JPG formats. Available in Widescreen format also. Useful for making business plan and strategies.
-
 Human resources kpi dashboard showing staff strength compensation distribution
SlideTeam presenting Human Resources Kpi Dashboard Showing Staff Strength Compensation Distribution PPT. It will not only help you in knowing the exact strength of the staff but also about actual staff required in the organization. This slideshow is entirely editable and you can edit it whenever you want. All the slides in this presentation are compatible with Google slides. You can enter thousands of relatable icons of your own choice. You can also change from 4:3 standard screen size to 16:9 widescreen size.
-
 Risk Management Kpi Dashboard Showing Consequence Vs Likelihood
Presenting this set of slides with name - Risk Management Kpi Dashboard Showing Consequence Vs Likelihood. This is a three stage process. The stages in this process are Risk Management, Risk Assessment, Project Risk.
-
 Risk Management Kpi Dashboard Showing Cost Of Control And Risk Score
Presenting this set of slides with name - Risk Management Kpi Dashboard Showing Cost Of Control And Risk Score. This is a five stage process. The stages in this process are Risk Management, Risk Assessment, Project Risk.
-
 Risk management kpi dashboard showing loss events actions and compliance
Presenting this set of slides with name - Risk Management Kpi Dashboard Showing Loss Events Actions And Compliance. This is a four stage process. The stages in this process are Risk Management, Risk Assessment, Project Risk.
-
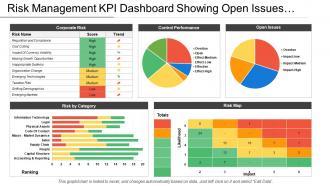
 Risk Management Kpi Dashboard Showing Open Issues And Control Performance
Presenting this set of slides with name - Risk Management Kpi Dashboard Showing Open Issues And Control Performance. This is a five stage process. The stages in this process are Risk Management, Risk Assessment, Project Risk.
-
 Risk Management Kpi Dashboard Showing Risk Distribution By Country Office
Presenting this set of slides with name - Risk Management Kpi Dashboard Showing Risk Distribution By Country Office And Business Process. This is a six stage process. The stages in this process are Risk Management, Risk Assessment, Project Risk.
-
 Risk Management Kpi Dashboard Showing Risk Heat Map And Control Rate By
Presenting this set of slides with name - Risk Management Kpi Dashboard Showing Risk Heat Map And Control Rate By Period. This is a five stage process. The stages in this process are Risk Management, Risk Assessment, Project Risk.
-
 Engineering procurement and construction kpi dashboard showcasing project summary cost and budget
Presenting this set of slides with name - Engineering Procurement And Construction Kpi Dashboard Showcasing Project Summary Cost And Budget. This is a five stage process. The stages in this process are Engineering, Procurement And Construction, Construction Management, Engineering, Purchasing And Construction .
-
 Engineering procurement and construction kpi having compliance rate
Presenting this set of slides with name - Engineering Procurement And Construction Kpi Having Compliance Rate. This is a three stage process. The stages in this process are Engineering, Procurement And Construction, Construction Management, Engineering, Purchasing And Construction .
-
 Clustered bar ppt visual aids ideas
Presenting this set of slides with name - Clustered Bar Ppt Visual Aids Ideas. This is a three stage process. The stages in this process are Financials, Business, Unit Count, Marketing, Graph.
-
 Activity ratios ppt ideas
Presenting this set of slides with name - Activity Ratios Ppt Ideas. This is a two stage process. The stages in this process are Business, Marketing, Finance, Graph, Strategy.
-
 Activity ratios ppt slide show
Presenting this set of slides with name - Activity Ratios Ppt Slide Show. This is a two stage process. The stages in this process are Business, Marketing, Finance, Graph, Strategy.
-
 Liquidity ratios ppt slide
Presenting this set of slides with name - Liquidity Ratios Ppt Slide. This is a two stage process. The stages in this process are Business, Marketing, Finance, Graph.
-
 Profitability ratios powerpoint slide graphics
Presenting this set of slides with name - Profitability Ratios Powerpoint Slide Graphics. This is a two stage process. The stages in this process are Business, Marketing, Graph, Strategy, Finance.
-
 Profitability ratios ppt images
Presenting this set of slides with name - Profitability Ratios Ppt Images. This is a two stage process. The stages in this process are Business, Marketing, Graph, Strategy, Finance.
-
 Profitability ratios ppt infographic template
Presenting this set of slides with name - Profitability Ratios Ppt Infographic Template. This is a two stage process. The stages in this process are Business, Marketing, Graph, Strategy, Finance.
-
 Solvency ratios ppt background
Presenting this set of slides with name - Solvency Ratios Ppt Background. This is a two stage process. The stages in this process are Business, Marketing, Graph, Strategy, Finance.
-
 Vendor kpi dashboard showing supplier compliance stats and procurement cycle time
Presenting this set of slides with name - Vendor Kpi Dashboard Showing Supplier Compliance Stats And Procurement Cycle Time. This is a four stage process. The stages in this process are Vendor, Supplier, Retailer.
-
 Stacked bar ppt sample download
Presenting this set of slides with name - Stacked Bar Ppt Sample Download. This is a four stage process. The stages in this process are Slide Bars, Business, Marketing, Strategy, Planning.
-
 Stacked bar presentation portfolio
Presenting this set of slides with name - Stacked Bar Presentation Portfolio. This is a four stage process. The stages in this process are Slide Bars, Business, Marketing, Strategy, Planning.
-
 Audit kpi dashboard of operating systems manufacturer report and model report
Presenting this set of slides with name - Audit Kpi Dashboard Of Operating Systems Manufacturer Report And Model Report. This is a five stage process. The stages in this process are Audit, Examine, Survey.
-
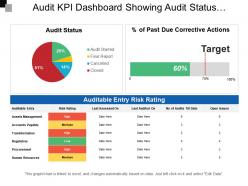
 Audit kpi dashboard showing audit status auditable entry risk rating
Presenting this set of slides with name - Audit Kpi Dashboard Showing Audit Status Auditable Entry Risk Rating. This is a four stage process. The stages in this process are Audit, Examine, Survey.
-
 Audit kpi dashboard showing overall assurance internal audit and results
Presenting audit kpi dashboard showing overall assurance internal audit and results presentation slide. The PPT layout is extremely easy to understand as it enables you to roll out various improvements to the editable slides. You can change the text dimension, textual style and furthermore the textual style shading according to your prerequisites. Layout slide can be downloaded rapidly and taxi be spared in configuration of PDF or JPG effectively. The format slide in the wake of being downloaded can be seen in extensive screen show proportion of 16:9 or standard size presentation proportion of 4:3.
-
 Audit kpi dashboard showing recurring audit finding instances and audit finding summary
Presenting this set of slides with name - Audit Kpi Dashboard Showing Recurring Audit Finding Instances And Audit Finding Summary. This is a four stage process. The stages in this process are Audit, Examine, Survey.
-
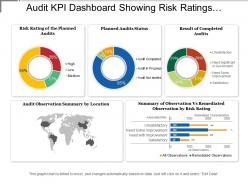
 Audit kpi dashboard showing risk ratings planned audit status
Presenting this set of slides with name - Audit Kpi Dashboard Showing Risk Ratings Planned Audit Status. This is a five stage process. The stages in this process are Audit, Examine, Survey.
-
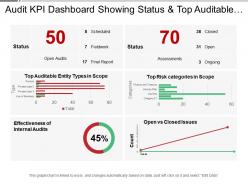
 Audit kpi dashboard showing status and top auditable entity types
Presenting this set of slides with name - Audit Kpi Dashboard Showing Status And Top Auditable Entity Types. This is a six stage process. The stages in this process are Audit, Examine, Survey.
-
 Call center kpi dashboard showing satisfaction index customer retention
Presenting this set of slides with name - Call Center Kpi Dashboard Showing Satisfaction Index Customer Retention. This is a five stage process. The stages in this process are Call Center Agent, Customer Care, Client Support.
-
 Call center kpi dashboard showing total calls average answer speed abandon rate
Presenting this set of slides with name - Call Center Kpi Dashboard Showing Total Calls Average Answer Speed Abandon Rate. This is a five stage process. The stages in this process are Call Center Agent, Customer Care, Client Support.
-
like
-
Like
-
Unique and attractive product design.
-
Wonderful templates design to use in business meetings.
-
Really like the color and design of the presentation.
-
Excellent products for quick understanding.
-
excellent performance
-
Great designs, really helpful.
-
Informative presentations that are easily editable.
-
Very unique and reliable designs.


