Data Driven Miscellaneous Measuring Graphics diagrams slides and templates
- Sub Categories
-
 Globe with bar graph data driven success indication powerpoint slides
We are proud to present our globe with bar graph data driven success indication powerpoint slides. Explain the global success indication with this power point template diagram. This PPT diagram contains the graphic of globe with bar graph. Use this PPT diagram for global marketing and business related presentations.
-
 Speedometer with three text boxes powerpoint slides
Perfect balance of colors, shapes and stages in relation to presentation topic. High resolution and fine quality PowerPoint slides. Instant download and can be shared easily with large audience. Compatible with Google slides and easily convertible into JPEG and PDF. Guidance for executing the changes has been provided for assistance. Modify and personalize the presentation by including the company name and logo.
-
 Two scientific thermometer for calculation powerpoint slides
They act as a perfect mode for the transfer of information from organisation to the viewers. An error free environment can be created with these designs. True and Accurate information is delivered to the spectators. Simple steps are need to be followed in order to download or edit them. They display professionalism. They are technology and result oriented.
-
 Financial highlights powerpoint slide presentation tips
Presenting financial highlights powerpoint slide presentation tips. This is a financial highlights powerpoint slide presentation tips. This is a four stage process. The stages in this process are sales, operating expenses, operating income, net income, profitability.
-
 Average handle time powerpoint graphics
Presenting average handle time powerpoint graphics. This is a average handle time powerpoint graphics. This is a two stage process. The stages in this process are target, measuring, dashboard, management.
-
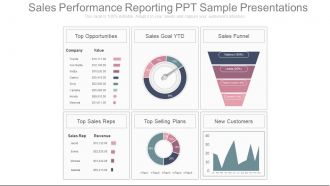
 Sales performance reporting ppt sample presentations
These slides are fully editable to suit your needs. Instantly download any design within a few seconds. Standard and widescreen compatible graphics. Can be opened using Google Slides also. Suitable for use by marketers, sales team, businessmen. Premium customer support service.This is a four stage process. The stages in this process are top opportunities, sales goal ytd, sales funnel, top sales reps, top selling plans, new customers, company, value, sales rep, revenue.
-
 Website performance review ppt slide design
Presenting website performance review ppt slide design. This is a website performance review ppt slide design. This is a four stage process. The stages in this process are business, strategy, finance, management, marketing.
-
 Key performance indicators template 3 powerpoint slide show
Presenting key performance indicators template 3 powerpoint slide show. Presenting key performance indicators template 3 powerpoint slide show. Presenting key performance indicators template 3 powerpoint slide show. This is a key performance indicators template 3 powerpoint slide show. This is four stage process. The stages in this process are area of focus, metrics, targets, objectives, vision and strategy, objective, measures, targets, invites.
-
 Key performance indicators template 3 powerpoint themes
Presenting key performance indicators template 3 powerpoint themes. This is a key performance indicators template 3 powerpoint themes. This is a four stage process. The stages in this process are objective, measures, targets, invites.
-
 Key performance indicators template 3 presentation visuals
Presenting key performance indicators template 3 presentation visuals. This is a key performance indicators template 3 presentation visuals. This is a four stage process. The stages in this process are metrics, targets, objectives, invites.
-
 Key performance indicators template powerpoint slide backgrounds
Excellent use colors in the presentation template. Imaginatively created PowerPoint shape with modification options. Easily adjustable PPT slide as can be converted into JPG and PDF format. Conforming designs accessible to different nodes and stages. Great pixel quality as image quality remains relentless on every screen size. Choice to reveal slide in standard 4:3 widescreen 16:9 view. Presentation graphic suitable with Google slides. Fast download saves valuable time. Makes it easier to share the information with ease with large set of viewers. Easy to portray the KRAs related to the work.
-
 Lead scoring powerpoint slide
Presenting lead scoring powerpoint slide. This is a lead scoring powerpoint slide. This is a six stage process. The stages in this process are measurable roi on lead generation program, increased conversion rates from qualified lead to opportunity, increased sales productivity and effectiveness, shortened sales cycle, better forecast and pipeline visibility, better alignment of marketing and sales efforts.
-
 Our key metrics powerpoint slide designs
Presenting our key metrics PowerPoint slide designs. This power point slide offers you plenty of space to put in titles and sub titles. High resolution-based presentation layout does not change the image even after resizing. This presentation icon is fully compatible with Google slides. Quick downloading speed and simple editing options in color text and fonts.PPT icons can easily be changed into JPEG and PDF applications. This diagram has been designed for entrepreneurs, corporate and business managers.
-
 Our key metrics ppt sample presentations
Presenting our key metrics ppt sample presentations. This is a our key metrics ppt sample presentations. This is a five stage process. The stages in this process are cash flow, turnover, net income, customer satisfaction, productivity.
-
 Financial highlights powerpoint slide deck template
Presenting financial highlights powerpoint slide deck template. This is a financial highlights powerpoint slide deck template. This is a four stage process. The stages in this process are performance, recurring revenue, revenue, adjusted ebitda.
-
 Financial highlights powerpoint slides
Presenting financial highlights powerpoint slides. This is a financial highlights powerpoint slides. This is a four stage process. The stages in this process are profit and loss, sales, operating expenses, operating income, net income.
-
 Lead scoring ppt examples professional
Presenting lead scoring ppt examples professional. This is a lead scoring ppt examples professional. This is a six stage process. The stages in this process are measurable roi on lead generation program, increased conversion rates from qualified lead to opportunity, increased sales productivity and effectiveness, shortened sales.
-
 Our key metrics ppt examples professional
Presenting our key metrics ppt examples professional. This is a our key metrics ppt examples professional. This is a five stage process. The stages in this process are productivity, cash flow, customer satisfaction, turnover, net income.
-
 Kpi Dashboard Powerpoint Slide Images
Presenting kpi dashboard powerpoint slide images. This is a kpi dashboard powerpoint slide images. This is a one stage process. The stages in this process are sold products, earned revenue, outcasts, successful adverts, operations, target, compare.
-
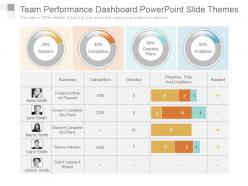
 Team performance dashboard powerpoint slide themes
Presenting team performance dashboard powerpoint slide themes. This is a team performance dashboard powerpoint slide themes. This is a four stage process. The stages in this process are summary, completion, overdue, progress, plan and problems, reward, finished what he planned, doesnt complete his plans, doesnt complete his plans, shows initiative, didnt submit a report.
-
 Kpi dashboard ppt infographic template
Presenting kpi dashboard ppt infographic template. This is a Kpi Dashboard Ppt Infographic Template. This is a four stage. The Stages in this process are outcasts, successful adverts, earned revenue, sold products, operations.
-
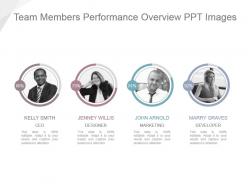
 Team members performance overview ppt images
Presenting team members performance overview ppt images. This is a team members performance overview ppt images. This is a four stage. The Stages in this process are kelly smith, jenney willis, john arnold, marry graves, ceo, designer, marketing, developer.
-
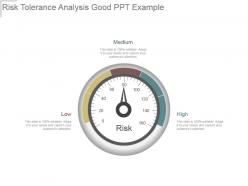
 Risk tolerance analysis good ppt example
Presenting risk tolerance analysis good ppt example. This is a risk tolerance analysis good ppt example. This is a one stage process. The stages in this process are high, low, medium.
-
 Risk tolerance analysis powerpoint slide designs
Presenting risk tolerance analysis powerpoint slide designs. This is a risk tolerance analysis powerpoint slide designs. This is a one stage process. The stages in this process are middle, low, high.
-
 Sales performance versus target ppt model
Presenting sales performance versus target ppt model. This is a sales performance versus target ppt model. This is a three stage process. The stages in this process are dashboard, business, marketing, strategy, measure.
-
 Kpi Dashboard Snapshot Powerpoint Ideas
Fabulously composed PPT design useful for business professionals, organizational experts or researchers , students and many more from diverse areas , Comprehensive and convenient PPT Images with ductile dummy data options, Consonant with all available graphic software’s and Google slides, Accessible to other file configurations like PDF or JPG. Multi-color options, background images, styles and other characteristics are fully editable, Expeditious downloading process, Allows to introduce your company logo or brand name in the PPT slides.
-
 Company timeline example ppt presentation
Presenting company timeline example ppt presentation. This is a company timeline example ppt presentation. This is a six stage process. The stages in this process are business, marketing, icons, strategy, timeline.
-
 Key financials presentation visuals
Presenting key financials presentation visuals. This is a key financials presentation visuals. This is a three stage process. The stages in this process are business, marketing, measure, success, graph.
-
 Dashboard snapshot ppt examples professional
Presenting dashboard snapshot ppt examples professional. This is a dashboard ppt examples professional. This is a three stage process. The stages in this process are low, medium, high.
-
 Finance dashboard snapshot powerpoint template
Presenting finance dashboard powerpoint template. This is a finance dashboard snapshot powerpoint template. This is a four stage process. The stages in this process are dashboard, finance, percentage, business, marketing.
-
 Business sales dashboard powerpoint template
Presenting business sales dashboard powerpoint template. This is a business sales dashboard powerpoint template. This is a one stage process. The stages in this process are dashboard, measurement, strategy, business, success.
-
 Product popularity comparison harvey balls ppt slide
Presenting product popularity comparison harvey balls ppt slide. This is a product popularity comparison harvey balls ppt slide. This is a four stage process. The stages in this process are business, percentage, finance, marketing, strategy, success.
-
 3 harvey balls for result analysis example of ppt
Presenting 3 harvey balls for result analysis example of ppt. This is a 3 harvey balls for result analysis example of ppt. This is a three stage process. The stages in this process are finance, process, business, marketing, percentage.
-
 Project progress meter dashboard powerpoint slide designs download
Presenting project progress meter dashboard powerpoint slide designs download. This is a project progress meter dashboard powerpoint slide designs download. This is a three stage process. The stages in this process are business, marketing, dashboard, percentage.
-
 Kpi for sales performance with dashboard powerpoint presentation diagram
Presenting kpi for sales performance with dashboard powerpoint presentation diagram. This is a kpi for sales performance with dashboard powerpoint presentation diagram. This is a four stage process. The stages in this process are area of focus, metrics, objectives, focus, objective, measures, targets, invites, vision and strategy.
-
 Marketing dashboard snapshot powerpoint presentation template design
Presenting marketing dashboard snapshot powerpoint presentation template design. This is a marketing dashboard powerpoint presentation template design. This is a three stage process. The stages in this process are observation, data driven marketing, support.
-
 Campaign performance report powerpoint presentation
Presenting campaign performance report powerpoint presentation. This is a campaign performance report powerpoint presentation. This is a four stage process. The stages in this process are industry snapshot, viewability, ad fraud, brand safety, tra score.
-
 Tra score brand safety dashboard of ad agency ppt model
Presenting tra score brand safety dashboard of ad agency ppt model. This is a tra score brand safety dashboard of ad agency ppt model. This is a four stage process. The stages in this process are brand safety, ad fraud, tra score, viewability.
-
 Big data benefits pie chart for business powerpoint show
Presenting big data benefits pie chart for business powerpoint show. This is a big data benefits pie chart for business powerpoint show. This is a four stage process. The stages in this process are increased efficiency, better business decision making, improved customer experience and engagement, achieved financial savings.
-
 Big data opportunities and challenges ppt slide templates
Presenting big data opportunities and challenges ppt slide templates. This is a big data opportunities and challenges ppt slide templates. This is a three stage process. The stages in this process are business, marketing, finance, success, percentage.
-
 Gender comparison pie chart powerpoint slide show
Presenting gender comparison pie chart powerpoint slide show. This is a gender comparison pie chart powerpoint slide show. This is a two stage process. The stages in this process are women, men.
-
 Revenue speedometer dashboard snapshot ppt diagrams
Presenting revenue speedometer dashboard Snapshot ppt diagrams. This is a revenue speedometer dashboard ppt diagrams. This is a three stage process. The stages in this process are business, marketing, success, dashboard, percentage.
-
 Performance measurement and comparison dashboard snapshot ppt design
Presenting performance measurement and comparison dashboard snapshot ppt design. This is a performance measurement and comparison dashboard ppt design. This is a three stage process. The stages in this process are series, qtr.
-
 Business performance four point dashboard snapshot ppt slide
Presenting business performance four point dashboard snapshot ppt slide. This is a business performance four point dashboard ppt slide. This is a four stage process. The stages in this process are business, success, dashboard, finance, strategy.
-
 Financial reporting dashboard snapshot ppt model
Presenting financial reporting dashboard ppt model. This is a financial reporting dashboard snapshot ppt model. This is a three stage process. The stages in this process are business, dashboard, financial, measuring, meter.
-
 Market trends analysis percentage spending by region powerpoint slide introduction
Presenting market trends analysis percentage spending by region powerpoint slide introduction. This is a market trends analysis percentage spending by region powerpoint slide introduction. This is a two stage process. The stages in this process are western europe, asia, north america, eastern europe, latin america, middle east, africa.
-
 Market trends in business plan powerpoint slide presentation examples
Presenting market trends in business plan powerpoint slide presentation examples. This is a market trends in business plan powerpoint slide presentation examples. This is a five stage process. The stages in this process are business, marketing, growth, demand, planning.
-
 Salesforce dashboard powerpoint slide presentation tips
Presenting salesforce dashboard powerpoint slide presentation tips. This is a salesforce dashboard powerpoint slide presentation tips. This is a two stage process. The stages in this process are business, marketing, dashboard, management, planning.
-
 Product performance dashboard powerpoint slide information
Presenting product performance dashboard powerpoint slide information. This is a product performance dashboard powerpoint slide information. This is a one stage process. The stages in this process are business, success, dashboard, measure, strategy.
-
 Evaluating advertising agency on parameters dashboard ppt templates
Presenting evaluating advertising agency on parameters dashboard ppt templates. This is a evaluating advertising agency on parameters dashboard ppt templates. This is a four stage process. The stages in this process are ad fraud, industry snapshot, view ability, brand safety.
-
 Sales performance reporting dashboard powerpoint template
Presenting sales performance reporting dashboard powerpoint template. This is a sales performance reporting dashboard powerpoint template. This is a three stage process. The stages in this process are dashboard, management, process, strategy, analysis.
-
 Dashboard powerpoint slide background
Presenting dashboard powerpoint slide background. This is a dashboard powerpoint slide background. This is a one stage process. The stages in this process are dashboard, meter, measure, speed, percentage.
-
 Creative ad agency performance evaluation powerpoint slide deck
Presenting creative ad agency performance evaluation powerpoint slide deck. This is a creative ad agency performance evaluation powerpoint slide deck. This is a four stage process. The stages in this process are viewability, brand safety, industry snapshot, ad fraud.
-
 Customer segmentation dashboard speedometer powerpoint slide
Presenting customer segmentation dashboard speedometer powerpoint slide. This is a customer segmentation dashboard speedometer powerpoint slide. This is a three stage process. The stages in this process are dashboard, measurement, business, strategy, success.
-
 Media usage preferences survey results powerpoint slide images
Presenting media usage preferences survey results powerpoint slide images. This is a media usage preferences survey results powerpoint slide images. This is a four stage process. The stages in this process are digital video, mobile video, advanced tv, broadcast cable ott tv, increase, maintain, decrease.
-
 Business cost reduction comparison dashboard snapshot ppt ideas
Presenting business cost reduction comparison dashboard ppt ideas. This is a business cost reduction comparison dashboard snapshot ppt ideas. This is a four stage process. The stages in this process are business, meter, measure, reduction, cost.
-
 Annual project performance dashboard snapshot ppt slide show
Presenting annual project performance dashboard snapshot ppt slide show. This is a annual project performance dashboard ppt slide show. This is a four stage process. The stages in this process are business, bar graph, dashboard, measure, value.
-
 Business goal performance dashboard snapshot ppt slide styles
Presenting business goal performance dashboard ppt slide styles. This is a business goal performance dashboard snapshot ppt slide styles. This is a one stage process. The stages in this process are business, bar graph, dashboard, measure, value.
-
 Financial reporting and analysis pie chart ppt slide
Presenting financial reporting and analysis pie chart ppt slide. This is a financial reporting and analysis pie chart ppt slide. This is a four stage process. The stages in this process are finance, marketing, percentage, process, success.
-
 Improved customer service experience pie charts ppt images
Presenting improved customer service experience pie charts ppt images. This is a improved customer service experience pie charts ppt images. This is a four stage process. The stages in this process are increased efficiency, better business decision making, improved customer experience and engagement, achieved financial savings.
-
Editable templates with innovative design and color combination.
-
Presentation Design is very nice, good work with the content as well.
-
Attractive design and informative presentation.
-
Informative presentations that are easily editable.
-
Helpful product design for delivering presentation.
-
Much better than the original! Thanks for the quick turnaround.
-
Great quality product.
-
Excellent Designs.
-
Topic best represented with attractive design.
-
Design layout is very impressive.


