- Sub Categories
-
 Data driven 3d business changes with time powerpoint slides
We are proud to present our data driven 3d business changes with time powerpoint slides. A bar graph is composed of discrete bars that represent different categories of data. The length or height of the bar is equal to the quantity within that category of data. Bar graphs are best used to compare values across categories.
-
 Data driven 3d business data on regular intervals powerpoint slides
We are proud to present our data driven 3d business data on regular intervals powerpoint slides. A bar graph is composed of discrete bars that represent different categories of data. The length or height of the bar is equal to the quantity within that category of data. Bar graphs are best used to compare values across categories.
-
 Data driven 3d business inspection procedure chart powerpoint slides
Presenting, data driven 3d business inspection procedure chart PowerPoint slides. High-resolution PPT slides to address the inspection procedure formation. The content is authoritative and ready to use. Modifiable background, color, layout, and font style and font type. Can be quickly converted into PDF and JPG format. The appealing layout for comparison and captivating figures to demonstrate the concept. Compatible with google slides and can be converted into pdf or jpeg format as per the need.
-
 Data driven 3d business intelligence and data analysis powerpoint slides
We are proud to present our data driven 3d business intelligence and data analysis powerpoint slides. A bar graph is composed of discrete bars that represent different categories of data. The length or height of the bar is equal to the quantity within that category of data. Bar graphs are best used to compare values across categories.
-
 Data driven 3d business trend series chart powerpoint slides
We are proud to present our data driven 3d business trend series chart powerpoint slides. A bar graph is composed of discrete bars that represent different categories of data. The length or height of the bar is equal to the quantity within that category of data. Bar graphs are best used to compare values across categories.
-
 Data driven 3d categories of data sets powerpoint slides
We are proud to present our data driven 3d categories of data sets powerpoint slides. A bar graph is composed of discrete bars that represent different categories of data. The length or height of the bar is equal to the quantity within that category of data. Bar graphs are best used to compare values across categories.
-
 Data driven 3d change in business process chart powerpoint slides
We are proud to present our data driven 3d change in business process chart powerpoint slides. A bar graph is composed of discrete bars that represent different categories of data. The length or height of the bar is equal to the quantity within that category of data. Bar graphs are best used to compare values across categories.
-
 Data driven 3d chart for business observation powerpoint slides
We are proud to present our data driven 3d chart for business observation powerpoint slides. A bar graph is composed of discrete bars that represent different categories of data. The length or height of the bar is equal to the quantity within that category of data. Bar graphs are best used to compare values across categories.
-
 Data driven 3d chart for interpretation of statistics powerpoint slides
We are proud to present our data driven 3d chart for interpretation of statistics powerpoint slides. A bar graph is composed of discrete bars that represent different categories of data. The length or height of the bar is equal to the quantity within that category of data. Bar graphs are best used to compare values across categories.
-
 Data driven 3d chart for quality characterstics powerpoint slides
We are proud to present our data driven 3d chart for quality characterstics powerpoint slides. A bar graph is composed of discrete bars that represent different categories of data. The length or height of the bar is equal to the quantity within that category of data. Bar graphs are best used to compare values across categories.
-
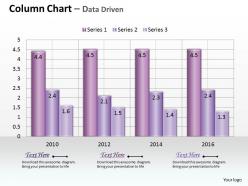 Data driven sets of business information powerpoint slides
We are proud to present our data driven sets of business information powerpoint slides. Use this PowerPoint chart to display business information. It gets easier to understand and interpret the data. This PowerPoint diagram allows you to present information in an intelligent and meaningful manner.
-
 Data driven 3d chart shows data sets in order powerpoint slides
We are proud to present our data driven 3d chart shows data sets in order powerpoint slides. Our Data Driven 3D Chart Shows Data Sets In Order Powerpoint Slides Power Point Templates Are Topically Designed To Provide An Attractive Backdrop To Any Subject. Use Them To Look Like A Presentation Pro. Use Our Data Driven 3D Chart Shows Data Sets In Order Powerpoint Slides Power Point Templates To Effectively Help You Save Your Valuable Time. They Are Readymade To Fit Into Any Presentation Structure.
-
 Data driven 3d chart shows interrelated sets of data powerpoint slides
We are proud to present our data driven 3d chart shows interrelated sets of data powerpoint slides. Our Data Driven 3D Chart Shows Interrelated Sets Of Data Powerpoint Slides Power Point Templates Provide You With A Vast Range Of Viable Options. Select The Appropriate Ones And Just Fill In Your Text. Subscribe To Our Data Driven 3D Chart Shows Interrelated Sets Of Data Powerpoint Slides Power Point Templates And Receive Great Value For Your Money. Be Assured Of Finding The Best Projection To Highlight Your Words.
-
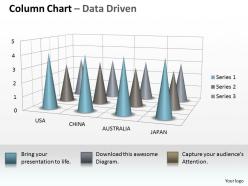 Data driven 3d chart to incorporate business information powerpoint slides
We are proud to present our data driven 3d chart to incorporate business information powerpoint slides. Our Data Driven 3D Chart To Incorporate Business Information Powerpoint Slides Power Point Templates Are Aesthetically Designed To Attract Attention. We Guarantee That They Will Grab All The Eyeballs You Need. Our Data Driven 3D Chart To Incorporate Business Information Powerpoint Slides Power Point Templates Are Specially Created By A Professional Team With Vast Experience. They Diligently Strive To Come Up With The Right Vehicle For Your Brilliant Ideas.
-
 Data driven 3d chart to monitor business process powerpoint slides
We are proud to present our data driven 3d chart to monitor business process powerpoint slides. Deadlines Are An Element Of Todays Workplace. Our Data Driven 3D Chart To Monitor Business Process Powerpoint Slides Power Point Templates Help You Meet The Demand. Just Browse And Pick The Slides That Appeal To Your Intuitive Senses. Our Data Driven 3D Chart To Monitor Business Process Powerpoint Slides Power Point Templates Will Help You Be Quick Off The Draw. Just Enter Your Specific Text And See Your Points Hit Home.
-
 Data driven 3d column chart for data analysis powerpoint slides
We are proud to present our data driven 3d column chart for data analysis powerpoint slides. Our Data Driven 3D Column Chart For Data Analysis Powerpoint Slides Power Point Templates Are The Chords Of Your Song. String Them Along And Provide The Lilt To Your Views. Our Data Driven 3D Column Chart For Data Analysis Powerpoint Slides Power Point Templates Help You Pinpoint Your Timelines. Highlight The Reasons For Your Deadlines With Their Use.
-
 Data driven 3d column chart for market surveys powerpoint slides
We are proud to present our data driven 3d column chart for market surveys powerpoint slides. Our Data Driven 3D Column Chart For Market Surveys Powerpoint Slides Power Point Templates Give You The Basic Framework Of Your Talk. Give It The Shape You Desire With Your Wonderful Views. Our Data Driven 3D Column Chart For Market Surveys Powerpoint Slides Power Point Templates Are The Lungs Of Your Talk. Fill Them With The Oxygen Of Your In-depth Thought Process.
-
 Data driven 3d column chart for sets of information powerpoint slides
We are proud to present our data driven 3d column chart for sets of information powerpoint slides. Our Data Driven 3D Column Chart For Sets Of Information Powerpoint Slides Power Point Templates Provide The Pitch To Bowl On. Mesmerize Your Audience With Your Guile. Our Data Driven 3D Column Chart For Sets Of Information Powerpoint Slides Power Point Templates Are Stepping Stones To Success. Climb Them Steadily And Reach The Top.
-
 Data driven 3d column chart to represent information powerpoint slides
We are proud to present our data driven 3d column chart to represent information powerpoint slides. Our Data Driven 3D Column Chart To Represent Information Powerpoint Slides Power Point Templates Are The Strands Of Your Mental Loom. Weave Them Together And Produce A Magical Tapestry. Our Data Driven 3D Column Chart To Represent Information Powerpoint Slides Power Point Templates Provide Windows To Your Brilliant Mind. Open Them To Your Audience And Impress Them With Your Knowledge.
-
 Data driven 3d compare yearly business performance powerpoint slides
We are proud to present our data driven 3d compare yearly business performance powerpoint slides. Our Data Driven 3D Compare Yearly Business Performance Powerpoint Slides Power Point Templates Are The Layers Of Your Gourmet Cake. Provide The Icing Of Your Ideas And Produce A Masterpiece. Use Our Data Driven 3D Compare Yearly Business Performance Powerpoint Slides Power Point Templates And Feel The Difference. Right Off They Generate A Surge Of Interest.
-
 Data driven 3d distribution of data in sets powerpoint slides
We are proud to present our data driven 3d distribution of data in sets powerpoint slides. Let Our Data Driven 3D Data In Segments Pie Chart Powerpoint Slides Power Point Templates Be The Vehicle Of Your Successful Journey. Ride The Bus To Glory With Your Grand Ideas. Our Data Driven 3D Data In Segments Pie Chart Powerpoint Slides Power Point Templates Are Like A Basic Christmas Tree. Decorate It With Your Beautiful Thoughts And Spread Joy And Happiness.
-
 Data driven 3d effective data display chart powerpoint slides
We are proud to present our data driven 3d effective data display chart powerpoint slides. Our Data Driven 3D Effective Data Display Chart Powerpoint Slides Power Point Templates Provide The Links In Your Chain Of Thought. Once Intertwined They Enhance The Strength Of Your Words. Our Data Driven 3D Effective Data Display Chart Powerpoint Slides Power Point Templates Are Like Ingredients In Your Recipe Of Success. Stir Them Together And Get People Licking Their Lips.
-
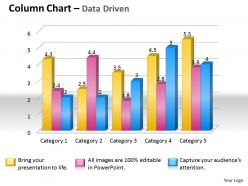 Data driven 3d grouped data bar chart powerpoint slides
Presenting the 3D Grouped data Bar chart PowerPoint Presentation slide. The PPT template is available in both standard size and widescreen size. It can be edited and customized in PowerPoint according to your need. You can change the colors of the bars, colors of the background, font type, font size and font color. Also, relevant content can be placed easily in the text placeholders. You can also insert your company name and logo in the slide. The placement of the text placeholders can also be changed to suit your presentation’s requirement. The slide is in sync with Google slides and can be saved in JPG or PDF formats. The 3 D Grouped data bar chart is of the highest quality. Go ahead and download this 100% editable PPT image now!
-
 Data driven 3d interpretation of statistical quality control powerpoint slides
We are proud to present our data driven 3d interpretation of statistical quality control powerpoint slides. Our Data Driven 3D Interpretation Of Statistical Quality Control Powerpoint Slides Power Point Templates Are Creatively Constructed And Eye Catching. Focus Attention On The Key Issues Of Your Presentation. Use Our Data Driven 3D Interpretation Of Statistical Quality Control Powerpoint Slides Power Point Templates And Nail The Day. Lead Your Team Show Them The Way.
-
 Data driven 3d process variation column chart powerpoint slides
We are proud to present our data driven 3d process variation column chart powerpoint slides. Bubbling And Bursting With Ideas Are You. Let Our Data Driven 3D Process Variation Column Chart Powerpoint Slides Power Point Templates Give Them The Shape For You. You Have Gained Great Respect For Your Brilliant Ideas. Use Our Data Driven 3D Process Variation Column Chart Powerpoint Slides Power Point Templates To Strengthen And Enhance Your Reputation.
-
 Data driven 3d quality control of units powerpoint slides
We are proud to present our data driven 3d quality control of units powerpoint slides. Channelize The Thoughts Of Your Team With Our Data Driven 3D Quality Control Of Units Powerpoint Slides Power Point Templates. Urge Them To Focus On The Goals You Have Set. Give Impetus To The Hopes Of Your Colleagues. Our Data Driven 3D Quality Control Of Units Powerpoint Slides Power Point Templates Will Aid You In Winning Their Trust.
-
 Data driven 3d sets of data in column chart powerpoint slides
We are proud to present our data driven 3d sets of data in column chart powerpoint slides. Raise The Bar With Our Data Driven 3D Sets Of Data In Column Chart Powerpoint Slides Power Point Templates. They Are Programmed To Take You To The Next Level. Our Data Driven 3D Sets Of Data In Column Chart Powerpoint Slides Power Point Templates Bring A Lot To The Table. Their Alluring Flavors Will Make Your Audience Salivate.
-
 Data driven 3d statistical process column chart powerpoint slides
We are proud to present our data driven 3d statistical process column chart powerpoint slides. Use Our Data Driven 3D Statistical Process Column Chart Powerpoint Slides Power Point Templates Get Your Audience In Sync. Grab Their Eyeballs They Won?t Even Blink. You Work The Stage With An Air Of Royalty. Let Our Data Driven 3D Statistical Process Column Chart Powerpoint Slides Power Point Templates Be The Jewels In Your Crown.
-
 Data driven 3d statistical quality control chart powerpoint slides
We are proud to present our data driven 3d statistical quality control chart powerpoint slides. Put Your Wonderful Verbal Artistry On Display. Our Data Driven 3D Statistical Quality Control Chart Powerpoint Slides Power Point Templates Will Provide You The Necessary Glam And Glitter. You Have The Co-Ordinates For Your Destination Of Success. Let Our Data Driven 3D Statistical Quality Control Chart Powerpoint Slides Power Point Templates Map Out Your Journey.
-
 Data driven 3d survey for sales chart powerpoint slides
We are proud to present our data driven 3d survey for sales chart powerpoint slides. Our Data Driven 3D Survey For Sales Chart Powerpoint Slides Power Point Templates Are Like The Strings Of A Tennis Racquet. Well Strung To Help You Serve Aces. Aesthetically Crafted By Artistic Young Minds. Our Data Driven 3D Survey For Sales Chart Powerpoint Slides Power Point Templates Are Designed To Display Your Dexterity.
-
 Data driven chart for business project powerpoint slides
We are proud to present our data driven chart for business project powerpoint slides. Zap Them With Our Data Driven Chart For Business Project Powerpoint Slides Power Point Templates. See Them Reel Under The Impact. Inspire Your Team With Our Data Driven Chart For Business Project Powerpoint Slides Power Point Templates. Let The Force Of Your Ideas Flow Into Their Minds.
-
 Data driven chart for case studies powerpoint slides
We are proud to present our data driven chart for case studies powerpoint slides. Create A Matrix With Our Data Driven Chart For Case Studies Powerpoint Slides Power Point Templates. Feel The Strength Of Your Ideas Click Into Place. Stir Your Ideas In The Cauldron Of Our Data Driven Chart For Case Studies Powerpoint Slides Power Point Templates. Cast A Magic Spell On Your Audience.
-
 Data driven chart shows changes over the time powerpoint slides
We are proud to present our data driven chart shows changes over the time powerpoint slides. Your Ideas Provide Food For Thought. Our Data Driven Chart Shows Changes Over The Time Powerpoint Slides Power Point Templates Will Help You Create A Dish To Tickle The Most Discerning Palate. Our Data Driven Chart Shows Changes Over The Time Powerpoint Slides Power Point Templates Are Innately Eco-Friendly. Their High Recall Value Negate The Need For Paper Handouts.
-
 Data driven column chart of various fields powerpoint slides
We are proud to present our data driven column chart of various fields powerpoint slides. Our Data Driven Column Chart Of Various Fields Powerpoint Slides Power Point Templates Are Focused Like A Searchlight Beam. They Highlight Your Ideas For Your Target Audience. Walk Right In To Our Data Driven Column Chart Of Various Fields Powerpoint Slides Power Point Templates Store. You Will Get More Than You Ever Bargained For.
-
 Data driven economic analysis with column chart powerpoint slides
We are proud to present our data driven economic analysis with column chart powerpoint slides. Raise A Toast With Our Data Driven Economic Analysis With Column Chart Powerpoint Slides Power Point Templates. Spread Good Cheer Amongst Your Audience. Press The Right Buttons With Our Data Driven Economic Analysis With Column Chart Powerpoint Slides Power Point Templates. They Will Take Your Ideas Down The Perfect Channel.
-
 Data driven 3d column chart for business project powerpoint slides
We are proud to present our data driven 3d column chart for business project powerpoint slides. Our Data Driven Column 3D Chart For Business Project Powerpoint slides Power Point Templates Will Provide Weight To Your Words. They Will Bring Out The Depth Of Your Thought Process. Words Like Arrows Fly Straight And True. Use Our Data Driven 3D Column Chart For Business Project Powerpoint slides Power Point Templates To Make Them Hit Bulls eye Every time.
-
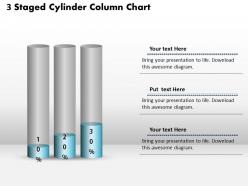 0414 3 staged cylinder column chart powerpoint graph
Incredibly amicable PPT design entirely useful for trade professionals, trade experts etc. from diverse areas , Comprehensive and convenient PPT Images with ductile dummy data options with an alternate to add company name, design or symbol, Consonant with all available graphic software’s and Google slides, Totally accessible into other file configurations like PDF or JPG. Features as background images, styles, texts and other characteristics are fully editable, Expeditious downloading process.
-
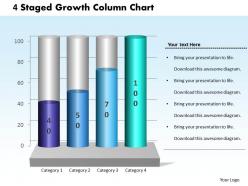 0414 4 staged growth column chart powerpoint graph
We are proud to present our 0414 4 staged growth column chart powerpoint graph. Our 4 Staged Growth Column Chart PowerPoint Graph Powerpoint Templates will generate and maintain the level of interest you desire. They will create the impression you want to imprint on your audience. Our 4 Staged Growth Column Chart PowerPoint Graph Powerpoint Templates are effectively colour coded to priorities your plans. They automatically highlight the sequence of events you desire.
-
 0414 5 staged column chart design powerpoint graph
We are proud to present our 0414 5 staged column chart design powerpoint graph. Hit the ground running with our 5 Staged Column Chart Design PowerPoint Graph Powerpoint Templates. Go the full distance with ease and elan. Leave a lasting impression with our 5 Staged Column Chart Design PowerPoint Graph Powerpoint Templates. They possess an inherent longstanding recall factor.
-
 0414 5 staged column growth chart powerpoint graph
Quality images and graphic icons. An easy access to download the slide template. Replace the watermark with your company’s logo or business name. Use your own images and the icons in the slides. Edit the content, size, colors and the orientation of the slide icons. Follow provided instructions to edit and change the slide icons. Advantageous for the Business presenters, Mangers and the employees.
-
 0414 5 staged percentage cylinders column chart powerpoint graph
We are proud to present our 0414 5 staged percentage cylinders column chart powerpoint graph. Brilliant backdrops are the essence of our 5 Staged Percentage Cylinders Column Chart PowerPoint Graph Powerpoint Templates. Guaranteed to illuminate the minds of your audience. Our 5 Staged Percentage Cylinders Column Chart PowerPoint Graph Powerpoint Templates are conceived by a dedicated team. Use them and give form to your wondrous ideas.
-
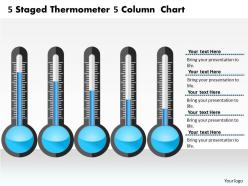 0414 5 staged thermometer 5 column chart powerpoint graph
We are proud to present our 0414 5 staged thermometer 5 column chart powerpoint graph. Hit the right notes with our 5 Staged Thermometer 5 Column Chart PowerPoint Graph Powerpoint Templates. Watch your audience start singing to your tune. Walk your team through your plans using our 5 Staged Thermometer 5 Column Chart PowerPoint Graph Powerpoint Templates. See their energy levels rise as you show them the way.
-
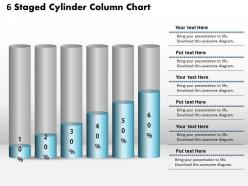 0414 6 staged cylinder column chart powerpoint graph
We are proud to present our 0414 6 staged cylinder column chart powerpoint graph. Our 6 Staged Cylinder Column Chart PowerPoint Graph Powerpoint Templates are created with admirable insight. Use them and give your group a sense of your logical mind. Use our 6 Staged Cylinder Column Chart PowerPoint Graph Powerpoint Templates to bullet point your ideas. See them fall into place one by one.
-
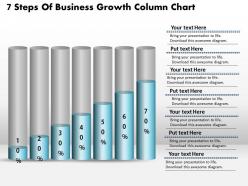 0414 7 steps of buisness growth column chart powerpoint graph
We are proud to present our 0414 7 steps of buisness growth column chart powerpoint graph. Use our 7 Steps Of Buisness Growth Column Chart PowerPoint Graph Powerpoint Templates to weave a web of your great ideas. They are guaranteed to attract even the most critical of your colleagues. Our 7 Steps Of Buisness Growth Column Chart PowerPoint Graph Powerpoint Templates are designed to help you succeed. They have all the ingredients you need.
-
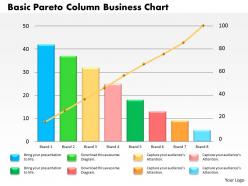 0414 basic pareto column business chart powerpoint graph
User oriented and secures proofing and editing is supported by PPT design. Untroubled functioning is rendered by the PowerPoint slide show on all software’s. Color, style and position of icons is ensured plus extended and is compatible with Google slides. When projected on the wide screen the PPT layout does not vary the pixels or color resolution. Can be used by the technical support department, teachers, businessmen, managers and other professionals to track and level performance.
-
 0414 battery percentage style column chart powerpoint graph
High resolution slide design visuals. Impactful and eye catchy images. No fear of image pixilation when projected on wide screen. Ease of download. Compatible with multiple formats, Google slides, Mac and Windows. Compatible with multiple software options both online and offline. Thoroughly editable slide design visuals. Ease of inclusion and exclusion of slide content. Ease of slide design personalization with company specific name, logo and trademark.
-
 0414 box plots business column chart powerpoint graph
High resolution PowerPoint presentation template. Slide has a creative and professional look. Completely compatible with Google slides. Offers modification in font, colors and shape. Trouble free to download and saves valuable time. Personalization by insertion of company trade name and design. Available in both Standard and Widescreen format. Downloadable PowerPoint template to insert text and share.
-
 0414 business data driven column chart powerpoint graph
We are proud to present our 0414 business data driven column chart powerpoint graph. Clear and concise is the credo of our 0414 Business Data Driven Column Chart Powerpoint Graph Powerpoint Templates. Use them and dispel any doubts your team may have. Effective communication is what our 0414 Business Data Driven Column Chart Powerpoint Graph Powerpoint Templates ensure. They help you put across your views with precision and clarity.
-
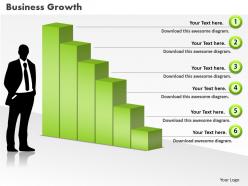 0414 business man with column chart powerpoint graph
Useful for professionals facilitating growth and progress related presentations. High definition graphics never pixilate if projected on bigger screens. Easily changeable into formats like JPEG and PDF. No space constraints for adding titles and sub-titles. Insert company’s logo, trademark or name accordingly. Easy to download and consumes less storage space. Compatible with Google slides and runs smoothly with softwares. Amendable in terms of color, orientation, design and font text.
-
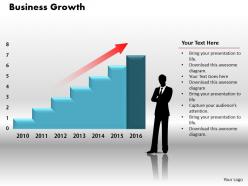 0414 business person with column chart powerpoint graph
Useful for start-ups and professionals preparing business-related presentations. Compatible with every software and Google slides. Provision to add name, trademark and logo of the company. No space constraints for adding sub-titles and titles. No pixilation with respect to picture graphics when projected on wider or bigger screens. Customisable in terms of color, font of the text, design an orientation. Convertible into common formats like PDF and JPEG.
-
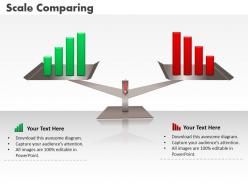 0414 business scale comparing column chart powerpoint graph
Equipped with numerous beneficial qualities required for a successful presentation. These can be easily tailored without putting much effort. Presentation slide comes in standard and widescreen view. Easily transformable into JPEG and PDF document. Creative and Innovative PowerPoint presentation design. Various other designs available with different charts. The quality is well appreciated by the high-profile businesses.
-
 0414 business success concept column chart powerpoint graph
PowerPoint template has extraordinary quality to impose a long-lasting impression. PPT comes with easy instructions for any modifications. Growth and success oriented slides. Slide can be easily inserted in an ongoing presentation. These are compatible with Google framework. These do not need much time and effort for their operation. Choice to get presentation design in Standard and Widescreen view.
-
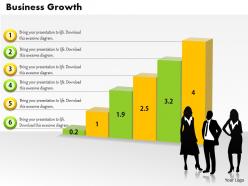 0414 business team with growth column chart powerpoint graph
Professionally crafted PowerPoint designs. Ease to share the presentation slide in standard and widescreen view. PPT slides are wholly compatible with Google slides. Fully modifiable PPT Slide with business team. Include or exclude business name, logo and icon possible. Beneficial for business professionals, students, teachers, scientists, business analysts and strategists. Compatible with Google slides as well.
-
 0414 business women with column pie chart powerpoint graph
Access to change the content or insert information. No concession with the quality, once opened on wide screen. Compatible with Microsoft office software and the Google slides. Modify and personalize the presentation by including the company name and logo. Guidance for executing the changes has been provided for assistance. Amendable presentation slide with pie chart. High resolution of diagrams and graphics.
-
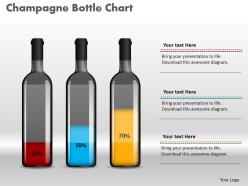 0414 champagne bottle percentage column chart powerpoint graph
We are proud to present our 0414 champagne bottle percentage column chart powerpoint graph. Whatever the nuance you want to project. We have a 0414 Champagne Bottle Percentage Column Chart Powerpoint Graph Powerpoint Templates that will get it across. Create a connection with your audience using our 0414 Champagne Bottle Percentage Column Chart Powerpoint Graph Powerpoint Templates. Transfer your depth of knowledge clearly across to them.
-
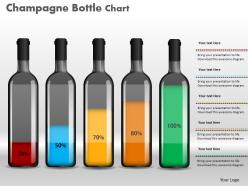 0414 champagne bottle column chart for data diaplay powerpoint graph
Employ slides in numerous software smoothly and coherently. Trouble-free download and use of slide. Company logo, trademark or name can be appended for extra accuracy and specificity. PPT graphics never pixelate when projected on widescreen displays. PowerPoint Slides quite compatible with google slides. Insert more titles and sub titles without space constraints. High resolution PPT slides for clarity. Highly alterable layout including font, text, color and design.
-
 0414 column chart business data illustration powerpoint graph
Slide runs quite fluently with all software. Fast download of PPT templates. Include your company logo, name or trademark with no issues. PPT graphics pixelation does not occur once slide viewed on widescreen. Compatibility with google slides for quick processing and information sharing. Coherently display titles and subtitles with no space constraints. Extremely customizable layout including font, text, color and design. High resolution PPT slides for clarity.
-
 0414 column chart business deal illustration powerpoint graph
This PPT template completely supported with Google slides. Formats can easily be changed into other software’s applications like PDF and JPEG. Simple to input company logo, brand name or name. The quality of presentation image does not blur even when your project it on full-size screen. Adjust PowerPoint design slides font, text, color and design as per your technique. Best suited for entrepreneurs and large business organization.
-
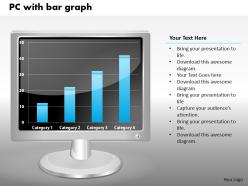 0414 column chart graph on pc powerpoint graph
We are proud to present our 0414 column chart graph on pc powerpoint graph. Our 0414 Column Chart Graph On PC Powerpoint Graph Powerpoint Templates are creatively constructed and eye catching. Focus attention on the key issues of your presentation. Use our 0414 Column Chart Graph On PC Powerpoint Graph Powerpoint Templates and nail the day. Lead your team show them the way.
-
 0414 column chart growth illustration powerpoint graph
Image quality remain the unaffected even when resize the image. Change PowerPoint image font, text, color and design as per your method. Perfect for marketing professionals, business managers, entrepreneurs and big organizations. This presentation slide is totally attuned with Google slide. Easy adaptation to other software’s like JPG and PDF formats. Easy to put in company logo, brand or name.
-
Understandable and informative presentation.
-
Awesome presentation, really professional and easy to edit.
-
Very well designed and informative templates.
-
Best way of representation of the topic.
-
Understandable and informative presentation.
-
I discovered this website through a google search, the services matched my needs perfectly and the pricing was very reasonable. I was thrilled with the product and the customer service. I will definitely use their slides again for my presentations and recommend them to other colleagues.
-
Very well designed and informative templates.
-
Awesome presentation, really professional and easy to edit.
-
Very unique, user-friendly presentation interface.
-
Editable templates with innovative design and color combination.


