- Sub Categories
-
 0414 thermometer column chart data illustration powerpoint graph
We are proud to present our 0414 thermometer column chart data illustration powerpoint graph. Our Thermometer Column Chart Data Illustration Powerpoint Graph Powerpoint Templates give you that extra zing. Add your views and make your audience sing. Our pretty Thermometer Column Chart Data Illustration Powerpoint Graph Powerpoint Templates are like snowflakes that fall. Gather them together and have a ball. Put your wondrously glowing ideas into them. Bind them together and create mayhem.
-
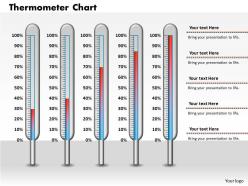 0414 thermometer column chart design powerpoint graph
Educate your team with the knowledge you have gained. Professionals can use this slide for health and column chart graph representation. All the colors used in the PPT slide is editable. Use this template in full screen for the best experience, get rid of the watermark and use it with google slides, just click download and follow the steps.
-
 0414 thermometer column chart for business growth powerpoint graph
We are proud to present our 0414 thermometer column chart for business growth powerpoint graph. Our Thermometer Column Chart For Business Growth Powerpoint Graph Powerpoint Templates are creatively constructed and eye catching. Focus attention on the key issues of your presentation. Use our Thermometer Column Chart For Business Growth Powerpoint Graph Powerpoint Templates and nail the day. Lead your team show them the way.
-
 0414 thermometer column chart for growth powerpoint graph
We are proud to present our 0414 thermometer column chart for growth powerpoint graph. Our Thermometer Column Chart For Growth Powerpoint Graph Powerpoint Templates are building a great reputation. Of being the driving force of a good presentation. Use our Thermometer Column Chart For Growth Powerpoint Graph Powerpoint Templates and surely win the game. As a presenter gain great name and fame.
-
 0414 thermometer column chart graphics powerpoint graph
All images are 100% editable in the presentation design. Presentation slide supports changing the color, size and orientation of any icon to your liking. PPT design supports the best graphic features; objects can be re arranged according to the requirement. Smooth animations, transitions and movement of objects across the slide. PPT slide is beneficial in business, academics, science, weather and science projections.
-
 0414 thermometer column chart layout powerpoint graph
We are proud to present our 0414 thermometer column chart layout powerpoint graph. Our Thermometer Column Chart Layout Powerpoint Graph Powerpoint Templates give good value for money. They also have respect for the value of your time. Take a leap off the starting blocks with our Thermometer Column Chart Layout Powerpoint Graph Powerpoint Templates. They will put you ahead of the competition in quick time.
-
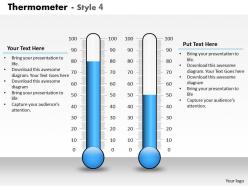 0414 thermometer column chart style graphics powerpoint graph
We are proud to present our 0414 thermometer column chart style graphics powerpoint graph. Put the wind in your sails with our Thermometer Column Chart Style Graphics Powerpoint Graph Powerpoint Templates. Skim smoothly over the choppy waters of the market. Let our Thermometer Column Chart Style Graphics Powerpoint Graph Powerpoint Templates give the updraft to your ideas. See them soar to great heights with ease.
-
 0414 thermometer column chart to compare data powerpoint graph
We are proud to present our 0414 thermometer column chart to compare data powerpoint graph. Timeline crunches are a fact of life. Meet all deadlines using our Thermometer Column Chart To Compare Data Powerpoint Graph Powerpoint Templates. Connect the dots using our Thermometer Column Chart To Compare Data Powerpoint Graph Powerpoint Templates. Fan expectations as the whole picture emerges.
-
 0414 thermometer column chart to display data powerpoint graph
We are proud to present our 0414 thermometer column chart to display data powerpoint graph. Let our Thermometer Column Chart To Display Data Powerpoint Graph Powerpoint Templates mark the footprints of your journey. Illustrate how they will lead you to your desired destination. Conjure up grand ideas with our magical Thermometer Column Chart To Display Data Powerpoint Graph Powerpoint Templates. Leave everyone awestruck by the end of your presentation.
-
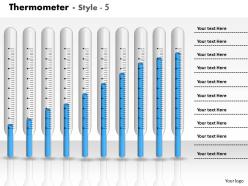 0414 thermometer column chart with 10 stages powerpoint graph
We are proud to present our 0414 thermometer column chart with 10 stages powerpoint graph. Bubbling and bursting with ideas are you. Let our Thermometer Column Chart With 10 Stages Powerpoint Graph Powerpoint Templates give them the shape for you. You have gained great respect for your brilliant ideas. Use our Thermometer Column Chart With 10 Stages Powerpoint Graph Powerpoint Templates to strengthen and enhance your reputation.
-
 0414 thermometer data driven column chart powerpoint graph
We are proud to present our 0414 thermometer data driven column chart powerpoint graph. Channelise the thoughts of your team with our Thermometer Data Driven Column Chart Powerpoint Graph Powerpoint Templates. Urge them to focus on the goals you have set. Give impetus to the hopes of your colleagues. Our Thermometer Data Driven Column Chart Powerpoint Graph Powerpoint Templates will aid you in winning their trust.
-
 0414 thermometer design column chart powerpoint graph
PPT slide supports resize, recolor and reverse the images. Good quality images can be used to compliment and reinforce message. Works well in Windows 7, 8, 10, XP, Vista and Citrix. Editing in presentation slide show can be done from anywhere by any device. PDF integrated features help to convert PPT to PDF. Supports to work offline and later upload the changes.
-
 0414 thermometer designed column chart powerpoint graph
PPT slide is compatible with Google slide. High resolution. PPT visual is useful to businessmen, academicians, for science, weather and science projections. Presentation slide show helps to insert links of stored files and can be used t create animated GIF if required. PPT graphic can be optimized and viewed in tablets, phone, widescreen monitors and projector screens.
-
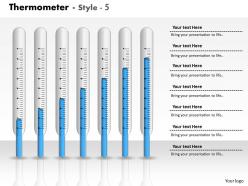 0414 thermometer graph column chart powerpoint graph
Can be viewed in 4: 3 standard screen size or 16:9 wide screen size. PPT design has many supporting actions like write, erase, correct, clean and select. Internet based click facilities like image search, oxford dictionary and others can be added with. ease and gives professional look to the PPT slide. Enables real time edition or collaboration with auto saving options.
-
 0414 thermometer layout column chart powerpoint graph
Beneficial for sales, marketing and productivity business by entrepreneurs. All images are 100% editable in the presentation slide. Presentation icon supports changing the color, size and orientation of any icon to your liking. Internet based click facilities like image search, oxford dictionary and others can be added with. ease and gives professional look to the PPT slide. Supports sharing and co-authoring of slide.
-
 0414 three thermometers column chart powerpoint graph
We are proud to present our 0414 three thermometers column chart powerpoint graph. Our Three Thermometers Column Chart Powerpoint Graph Powerpoint Templates provide you the cutting edge. Slice through the doubts in the minds of your listeners. You aspire to touch the sky with glory. Let our Three Thermometers Column Chart Powerpoint Graph Powerpoint Templates provide the fuel for your ascent.
-
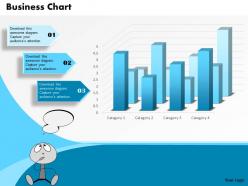 0514 3d bar graph data driven business chart diagram powerpoint slides
They are superlative designed PowerPoint visuals useful for management professionals, business analysts and researchers etc. These are wholly amendable PPT layouts, designs, forms, shades and icons etc. These PPT graphics can be acclimating with other software and all Google slides. They are spectacularly conceived pictorial Presentation templates which can be easily convertible into PDF or JPG file layouts. They provide high quality visuals.
-
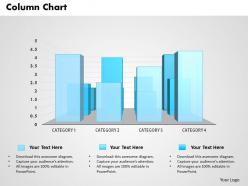 0514 3d bar graph data driven result display powerpoint slides
Wonderfully designed PPT design templates suitable for different business professionals and management scholars, Detailed and appropriate PPT Images with supple data alternate and can add title and subtitle too, Feasible downloading flexibility available hence which is time savings, Fully harmonious with all the graphic software available and all Google slides, Editable background images, styles, texts, colors, fonts etc.,
-
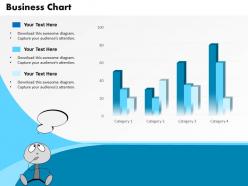 0514 3d bar graph for data driven sales result display powerpoint slides
Delicately projected PPT template congruous for the business and marketing management scholars etc., Conversant with all Google slides and different software functions, sleek and smooth downloading available which saves time, Rebuild able backgrounds, style, matter, figures etc, easily insert able company logo, emblem or trademark, High quality PPT visuals which remain unaffected when projected on wide screen, exportable to other file formats such as PDF or JPG.
-
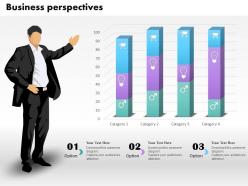 0514 3d business prospective data driven chat powerpoint slides
Well Spruced Presentation graphics, All features like contents, themes, symbols can be manually alterable, PPT templates can be exportable into diverse file structures such as PDF or JPG, Well pertinent for the management students and other business and marketing professionals, Sufficient room available to reinstate the dummy Presentation design data and to add sufficient title or subtitles, easily compatible with all Google slides.
-
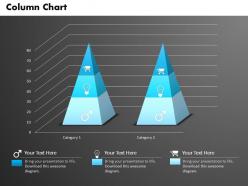 0514 3d triangular chart for data driven result display powerpoint slides
We are proud to present our 0514 3d triangular chart for data driven result display powerpoint slides. A triangular data driven chart is used in this Business power Point template. Use this template for sequential data flow in any presentation.
-
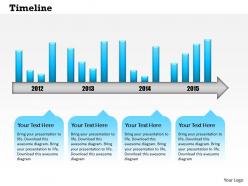 0514 annual data driven time line diagram powerpoint slides
Can be used by businessmen, sales, marketing and managers in the company. Filling background in a different color from the text is additional supportive feature of PPT layout. All images are 100% editable in the presentation slide. Presentation icon supports changing the color, size and orientation of any icon to your liking. Featured proofing and editing is supported in presentation slide show. Smooth functioning is ensured by the presentation slide show on all software’s.
-
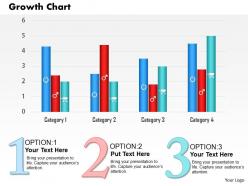 0514 business growth chart for finance powerpoint slides
Impactful visuals with intellectual content. Ease of download. Easy to execute changes at personal level as per the need. 100 percent editable slide design template. High resolution visuals. No fear of image pixilation when projected on wide screen. Compatible with multiple numbers of software options like, JPEG, JPG and PNG. Used by large number of business analysts, business strategists, students and teachers.
-
 0514 data driven blue bar graph powerpoint slides
We are proud to present our 0514 data driven blue bar graph powerpoint slides. A blue bar graph graphic is used in this Business Power Point template. This creative template is very well designed for business presentations.
-
 0514 data driven business bar graph business chart powerpoint slides
Use of Pixel friendly icons and the graphics. Allow to edit the style, background and the color of PowerPoint slides after downloading. Trouble free insertion of trademark or company logo. Save it in the JPG or PDF format. Easy to enter the data and the information in the slides. Useful for the Business leaders, employees, Human Resource department and the managers.
-
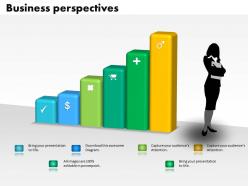 0514 data driven business prespective bar graph powerpoint slides
We are proud to present our 0514 data driven business prespective bar graph powerpoint slides. This Business Power Point template is designed with graphic of donut chart with data driven analysis. Show all kind of business perspectives with our unique graphic templates.
-
 0514 data driven chart for shopping powerpoint slides
We are proud to present our 0514 data driven chart for shopping powerpoint slides. To display shopping related analyses in any business presentation use our creative Business Power Point template with data driven techniques.
-
 0514 data driven financial business chart powerpoint slides
We are proud to present our 0514 data driven financial business chart powerpoint slides. To display financial result analyses in any business presentation use our creative Business Power Point template with data driven techniques.
-
 0514 data driven sales and marketing chart powerpoint slides
We are proud to present our 0514 data driven sales and marketing chart powerpoint slides. Data driven sales and marketing concept and analysis is can be display with our unique Business Power Point template. Get good remarks on your efforts of making presentations.
-
 0514 data driven triangular bar graph powerpoint slides
We are proud to present our 0514 data driven triangular bar graph powerpoint slides. A triangular shape data driven bar graph is used in this Business power Point template. Use this template for sequential data flow in any presentation.
-
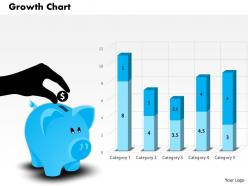 0514 financial growth chart with piggy powerpoint slides
We are proud to present our 0514 financial growth chart with piggy powerpoint slides. This Business Power Point template slide is designed with 3d graphic of piggy with growth chart. This template is crafted for financial growth display.
-
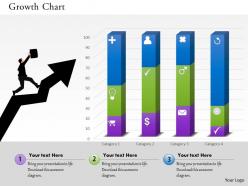 0514 follow the growth path for finance powerpoint slides
Best quality images and designs used in the Presentation. Presentation slide can be easily customized i.e. colour and font. Accessibility to enter the business details as required. Fast download and effortlessly alterable into JPEG and PDF. Quick option to download and share. Perfect for Finance professionals and experts.
-
 0514 money data driven chart powerpoint slides
Offer 100% access to change the size and style of the slides once downloaded and saved in the desired format. Accessible in standard and widescreen view display. More bars can also be added as per the need. Simple to download and share. Exclusively editable PowerPoint templates to allow customization i.e. with color, text and layout. Easily convertible into JPEG or PDF document. Beneficial for the business managers, financial executives, marketing professionals and the strategy designers.
-
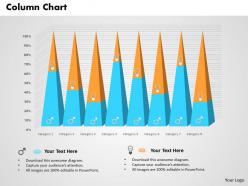 0514 triangular data driven chart for analysis powerpoint slides
We are proud to present our 0514 triangular data driven chart for analysis powerpoint slides. A triangular shape data driven chart is used in this Business power Point template. Use this template for sequential data flow in any presentation.
-
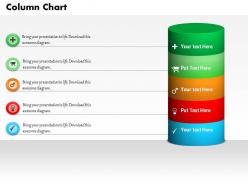 0514 vertical data driven bar graph powerpoint slides
Completely compatible with Google slides. Picture graphics do not distort when projected on big screen. Quick downloading speed and change formats to other software like JPEG and PDF. High resolution based slide and does not alter after resizing. Easy customization editing options for fonts, colors and text. Beneficial for business, corporate and marketing people.
-
 1214 3d tablet with triangular text diagram for data representation powerpoint slide
100% compatible PowerPoint slides with Google slides. Convenient display option to view in standard and widescreen view. These PPT designs are extremely flexible and accurate. They make sure to display relevant information in front on the viewers. High quality resolution Presentation diagram. Alteration is possible with color, text and layout. Quick to download and saves valuable time.
-
 1214 colored coloum chart for result analysis powerpoint slide
We are proud to present our 1214 colored coloum chart for result analysis powerpoint slide. Colored column chart has been used to craft this power point template. This PPT slide contains the concept of result analysis. Use this PPT slide for your finance and marketing related presentations.
-
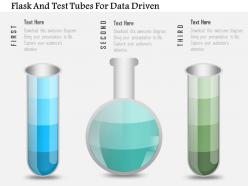 1214 flask and test tubes for data driven powerpoint slide
We are proud to present our 1214 flask and test tubes for data driven powerpoint slide. Graphic of flask and test tubes are used to craft this power point template slide. This PPT slide can be used for data driven measurement and analysis. Use this PPT slide for your science and math related presentation.
-
 1214 human face with colored graph for data analysis powerpoint slide
We are proud to present our 1214 human face with colored graph for data analysis powerpoint slide. This power point template slide has been crafted with graphic of human face and colored graph. This PPT slide contains the concept data analysis for any business or financial data. Use this PPT slide and get good remarks from your viewers.
-
 1214 human icons with bubbles and different icons inside powerpoint slide
We are proud to present our 1214 human icons with bubbles and different icons inside powerpoint slide. This power point template slide has been crafted with graphic of human icons and bubbles. This PPT slide also contains the different icons. Use this PPT slide for your business development related presentations.
-
 1214 three staged pencil diagram for graph formation powerpoint slide
We are proud to present our 1214 three staged pencil diagram for graph formation powerpoint slide. Three staged pencil diagram has been used to craft this power point template slide. This PPT contains the concept of graph formation. This PPT slide is usable for education and business related presentations.
-
 1214 three text boxes for timer for time management powerpoint slide
We are proud to present our 1214 three text boxes for timer for time management powerpoint slide. This Power Point template slide has been designed with graphic of three text boxes. These text boxes are used for data representation. Use this PPT slide for your business and marketing data related presentations.
-
 1214 three trucks for data representation for business powerpoint slide
We are proud to present our 1214 three trucks for data representation for business powerpoint slide. This Power Point template slide has been designed with graphic of three trucks. These trucks are used as a data representation. Use this PPT slide for your business data related presentations.
-
 1214 two tablets with growth bar grah data driven powerpoint slide
We are proud to present our 1214 two tablets with growth bar grah data driven powerpoint slide. This power point template slide has been crafted with graphic of two tablets and bar graph. This PPT slide contains the data driven analysis. Use this PPT slide and build presentation for your business growth and financial analysis.
-
 Business man with data driven growth chart powerpoint slides
Downloads instantaneously without unnecessary steps. High resolution PPT images with fully modifiable size and orientation. Fully editable text sans length constraints on titles and subtitles. Insert your company name, brand name, tagline or watermark. Convert easily into PDF or JPG formats and run with any software. Impressive addition to presentations by project managers, sales executives, marketers etc.
-
 Colored thermometer with analysis powerpoint slides
The incorporation of these images with your presentations creates a perfect looking presentation. Numerous icons are offered to include in the presentation. The appearance of these can be altered by changing the colours and the content. All the vital business aspects are very well covered in these slides. They have easy and error free downloading.
-
 Data driven bar graph made with pencils powerpoint slides
Easy proofing and editing is added on feature of presentation visual. Presentation slide is useful in business marketing, management and recourse disbursement. Basic theme yet it can modified with respect to font, color and layout. Attractive color scheme gives a professional look to PPT layout. Conversion into PDF or JPG formats is very easy and handy. PPT graphic offers font size which can be read from a distance. Shapes are in vector format and can be edited.
-
 Data driven growth chart financial planning powerpoint slides
Basic theme yet it can modified with respect to font, color and layout. Attractive and professional color scheme. Presentation graphic offers font size which can be read from a distance. High resolution is offered by the presentation slide show. Easy to download and instant use of pre designed PPT layout adds to its advantage. High color resolution offered by PPT. Beneficial for businessmen, project managers for business and financial accounting purposes.
-
 Data driven human resource management powerpoint slides
All images are 100% editable in the presentation design. Good quality images can be used to compliment message. Works well in Windows 7, 8, 10, XP, Vista and Citrix. Editing in presentation slide show can be done from anywhere by any device. Students, teachers, businessmen or industrial managers can put to use the PPT layout as per their requirement. Compatibility with Google slides. PPT graphic offers font size which can be read from a distance. High resolution is offered by the presentation slide show.
-
 Educational chart data driven made with pencils powerpoint slides
Format slide pie outline is completely changeable. Downloading layout in any format decisions like JPEG, JPG or PDF is simple and brisk. Provide a pro perspective to your format slides. Highly apparent with Google slides. Symbols are in like way being joined. Customization of content, representation, outlines, and substance as appeared by your aching and need. Visuals don't obscure when opened on widescreen. Company logo, name and trademark can be effectively installed.
-
 Four forks style data driven bar graphs powerpoint slides
Work adequately with all thing alterations. Easy to embed association logo, trademark or name. Visuals quality don't pixelate when expected on wide screen. Well magnificent with Google slides. Basically snap to download. Free of space necessities to state titles and sub titles. Modify PPT manage, inventive style, substance, shading and plan as showed by your style. Can be effortlessly changed over into PDF or JPG gatherings. High declaration slides portrayals.
-
 Globe with bar graph data driven success indication powerpoint slides
We are proud to present our globe with bar graph data driven success indication powerpoint slides. Explain the global success indication with this power point template diagram. This PPT diagram contains the graphic of globe with bar graph. Use this PPT diagram for global marketing and business related presentations.
-
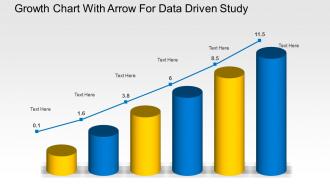 Growth chart with arrow for data driven study powerpoint slides
We are proud to present our growth chart with arrow for data driven study powerpoint slides. Graphic of growth chart with arrow has been used to design this power point template diagram. This PPT diagram contains the concept of data driven growth analysis. Use this PPT diagram for business and finance related presentations.
-
 Pencil bar graph for data driven analysis powerpoint slides
Pre-designed PPT Template for marketing professionals, researchers, analysts, sales executives, etc. for data driven analysis. Colors, text and font can be easily changed as the PPT slide is completely editable. You can also add company logo, trademark or name. Easy and fast downloading process. Unaffected high resolution even after customization. This PPT Slide is available in both Standard and Widescreen slide size.
-
 Year based data driven bar graph powerpoint slides
Well crafted and professionally equipped PowerPoint visual. Use of bright and bold colors for maximum visual appeal. Ease of editing every component of the PPT template. Guidance for executing the changes has been provided for assistance. Modify and personalize the presentation by including the company name and logo. Compatible with varied number of format options.
-
 Our channel sales numbers powerpoint themes
Presenting our channel sales numbers powerpoint themes. This is a our channel sales numbers powerpoint themes. This is a four stage process. The stages in this process are growth, dashboard, measuring, management.
-
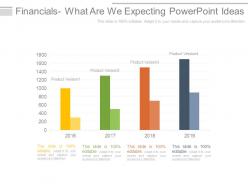 Financials what are we expecting powerpoint ideas
Presenting financials what are we expecting powerpoint ideas. This is a financials what are we expecting powerpoint ideas. This is a four stage process. The stages in this process are business, years, process, analysis, strategy, management.
-
 Financials what are we expecting ppt slides
Presenting financials what are we expecting ppt slides. This is a financials what are we expecting ppt slides. This is a four stage process. The stages in this process are analysis, business, marketing, strategy, success.
-
 Shareholders funds and market cap ppt sample download
Presenting shareholders funds and market cap ppt sample download. This is a shareholders funds and market cap ppt sample download. This is a five stage process. The stages in this process are shareholders funds, market capitalization, market capitalization as a percentage of cse market capitalization.
-
 World sector growth ppt slides download
Presenting world sector growth ppt slides download. This is a world sector growth ppt slides download. This is a four stage process. The stages in this process are graph, management, strategy, business, success.
-
Awesome presentation, really professional and easy to edit.
-
Best way of representation of the topic.
-
Nice and innovative design.
-
Best way of representation of the topic.
-
Visually stunning presentation, love the content.
-
Amazing product with appealing content and design.
-
Helpful product design for delivering presentation.
-
Innovative and Colorful designs.
-
Out of the box and creative design.
-
Illustrative design with editable content. Exceptional value for money. Highly pleased with the product.


