- Sub Categories
-
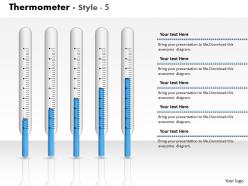 0414 column chart thermometer graph powerpoint graph
Impressive visuals of high quality. Good quality resolution. No issue of blurred images when projected on wide screen. Compatible with multiple number of online and offline software options. Ease of personalization and customization. Add the data and figures with ease. For assistance refer to the editing guidance provided in the presentation itself. Effectively downloaded and used by entrepreneurs, strategists, marketers, students and teachers.
-
 0414 column chart with business growth powerpoint graph
Effortlessly amendable PPT illustration into JPG and PDF. Seamless use of colors in the PowerPoint visual design. Access to include organization badge, icon and picture as required. Matching designs attainable with different nodes and stages. High determination with fabulous picture quality. Quick to download and saves valuable time. Exquisitely crafted Presentation background. Preference to demonstrate slide in standard 4:3 widescreen 16:9 view.
-
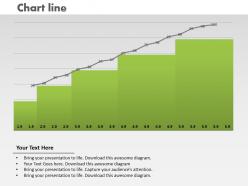 0414 column chart with growth line powerpoint graph
Multiple display option such as standard and widescreen view. Adjustable presentation background with remarkable pixel quality. Easy customization of presentation graphic and content. Proficiently transformable into numerous software options such as JPG or PDF. Provides a uniform approach to your PowerPoint illustration. Choice to insert company name, badge and label. Similar PPT designs accessible with different nodes and stages.
-
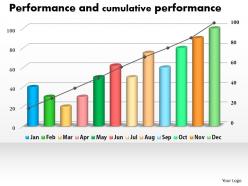 0414 column line chart for cumulative performance powerpoint graph
Incredible quality Presentation visual design with better display. Easy to include personalized content corporate logo or emblem. Contents of slide background are 100% editable to the extent. Multiple options like JPG and PDF for saving the presentation visual. PPT background downloadable with different nodes and stages. The PowerPoint illustration presentable in standard and widescreen view. Impeccable use of vectors which can be customized as per your requirement.
-
 0414 cylinders column chart of percentage growth powerpoint graph
PPT example works perfectly with Google slides. Fluently download and variable into JPEG and PDF document. Smoothly editable PowerPoint clipart as color, text and font are editable. Alternate of insertion of trade representation and pictograph for personalization. Presentation slide template can be exhibited in both standard and widescreen view. Convenience to download identical designs with different nodes and stages. Perfect for business entrepreneurs, event management team, project management team, industry professionals etc.
-
 0414 data display with thermometer column chart powerpoint graph
We are proud to present our 0414 data display with thermometer column chart powerpoint graph. You have a driving passion to excel in your field. Our 0414 Data Display With Thermometer Column Chart Powerpoint Graph Powerpoint Templates will prove ideal vehicles for your ideas. You are well armed with penetrative ideas. Our 0414 Data Display With Thermometer Column Chart Powerpoint Graph Powerpoint Templates will provide the gunpowder you need.
-
 0414 data distribution column chart powerpoint graph
Simple to save into JPEG and PDF document. PPT samples are harmonious with Google slides. Flexible to share in widescreen view as amazing picture quality. Easy to alter color, text, font and shape. Similar designs accessible with different nodes and stages as required. Convenience to incorporate occupational label, design. Speedy download and sharing is easy. Valuable for sending birthday wishes, personalized messages and postal envelope services etc.
-
 0414 data sets column chart illustration powerpoint graph
We are proud to present our 0414 data sets column chart illustration powerpoint graph. Our 0414 Data Sets Column Chart Illustration Powerpoint Graph Powerpoint Templates are like the strings of a tennis racquet. Well strung to help you serve aces. Aesthetically crafted by artistic young minds. Our 0414 Data Sets Column Chart Illustration Powerpoint Graph Powerpoint Templates are designed to display your dexterity.
-
 0414 design of thermometer column chart powerpoint graph
We are proud to present our 0414 design of thermometer column chart powerpoint graph. Our 0414 Design Of Thermometer Column Chart Powerpoint Graph Powerpoint Templates provide you the cutting edge. Slice through the doubts in the minds of your listeners. You aspire to touch the sky with glory. Let our 0414 Design Of Thermometer Column Chart Powerpoint Graph Powerpoint Templates provide the fuel for your ascent.
-
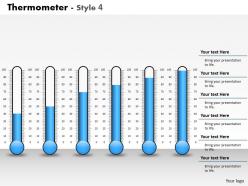 0414 display of thermometer column chart powerpoint graph
We are proud to present our 0414 display of thermometer column chart powerpoint graph. You are an avid believer in ethical practices. Highlight the benefits that accrue with our 0414 Display of Thermometer Column Chart Powerpoint Graph Powerpoint Templates. Set your controls for the heart of the sun. Our 0414 Display of Thermometer Column Chart Powerpoint Graph Powerpoint Templates will be the propellant to get you there.
-
 0414 Donut And Column Business Charts Powerpoint Graph
Entirely editable PowerPoint presentation slide. Adaptable with several software programs like JPEG and PDF. Preference to include and remove content as per the commerce need. Available in both standard as well as in widescreen slide. Gives a professional perspective to your PowerPoint slide. Personalization of PPT template is possible as per your requirement. Similar samples available with different nodes and stages.
-
 0414 down arrow on column chart powerpoint graph
Provides a professional outlook to your PowerPoint presentation. Icons can also be added. Customization of each PowerPoint graphic and text according to your desire and want. Available in Widescreen slide size also. Modifiable PPT slide for business charts and graphs. Compatible with numerous format options like JPEG, JPG or PDF. Freedom to customize it with company name and logo.
-
 0414 financial ratio slider column chart powerpoint graph
Flexible option for conversion in PDF or JPG formats. Professionally designed presentation slides. Fully adjustable with Google slides. Can be easily changed as the PPT slide chart is completely editable. Personalize the presentation with individual company name and logo. Suitable for finance experts, accounts team professionals, etc. Download and save the presentation in desired format.
-
 0414 frequency distribution in 3d column chart powerpoint graph
Use of high-resolution and quality images. Trouble free insertion of the brand logo or name in the background. Adjustable style, size and orientation of the slide charts. Open without any risk on wide screen. Use perfectly with Google slides and other Microsoft office software. 100% editing of the slide charts, colors, text, etc. Used by the business professionals, marketing people and management students.
-
 0414 graph mobile column chart design powerpoint graph
Simple and fast to download without convoluted steps. Fully editable text for titles and subtitles without word length constraints. Easily modifiable orientation, color scheme, contrast and sizes of PPT infographics. Insert your logo, tagline, brand name etc. Edit any number of times without any loss of resolution of presentation images. Ideal for finance managers, project planners, consultants, advisers etc.
-
 0414 graphics of thermometer column chart powerpoint graph
We are proud to present our 0414 graphics of thermometer column chart powerpoint graph. Stamp the authority of your intellect with our Graphics Of Thermometer Column Chart Powerpoint Graph Powerpoint Templates. Your superior ideas will hit the target always and everytime. Use our Graphics Of Thermometer Column Chart Powerpoint Graph Powerpoint Templates to embellish your thoughts. See them provide the desired motivation to your team.
-
 0414 human parts column chart design powerpoint graph
Displays the vitality of body language by utilizing lively graphics and icons. Visually appealing PPT presentation diagrams. Grabs the viewers’ attention easily. Provides pre-defined guidelines for making any changes in these patterns to match the business needs. Allows insertion of business trademark, logos and names. Can be viewed on huge screens for better vision and clarity.
-
 0414 incraesing flow column chart 3 stages powerpoint graph
We are proud to present our 0414 incraesing flow column chart 3 stages powerpoint graph. Our Incraesing Flow Column Chart 3 Stages Powerpoint Graph Powerpoint Templates provide the pitch to bowl on. Mesmerise your audience with your guile. Our Incraesing Flow Column Chart 3 Stages Powerpoint Graph Powerpoint Templates are stepping stones to success. Climb them steadily and reach the top.
-
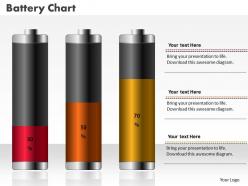 0414 increasing flow battery column chart powerpoint graph
Requires minimal additional space for explanations being self-expressive. Enable highlighting the key aspects. User- friendly PPT presentation diagrams. Supports the process of decision making to enhance business productivity. Makes the entire information appear extremely relevant and interesting. Compatible with Google Slides. Enables complete modification without any hassles. Provides error-free performance.
-
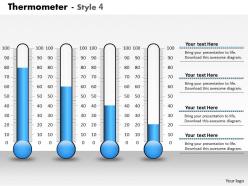 0414 increasing flow thermometer column chart powerpoint graph
We are proud to present our 0414 increasing flow thermometer column chart powerpoint graph. Our Increasing Flow Thermometer Column Chart Powerpoint Graph Powerpoint Templates are the layers of your gourmet cake. Provide the icing of your ideas and produce a masterpiece. Use our Increasing Flow Thermometer Column Chart Powerpoint Graph Powerpoint Templates and and feel the difference. Right off they generate a surge of interest.
-
 0414 inreasing profit ratio column chart powerpoint graph
We are proud to present our 0414 inreasing profit ratio column chart powerpoint graph. Let our Inreasing Profit Ratio Column Chart Powerpoint Graph Powerpoint Templates be the vehicle of your sucessful journey. Ride the bus to glory with your grand ideas. Our Inreasing Profit Ratio Column Chart Powerpoint Graph Powerpoint Templates are like a basic christmas tree. Decorate it with your beautiful thoughts and spread joy and happiness.
-
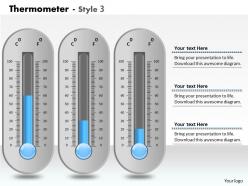 0414 layout of thermometer column chart powerpoint graph
We are proud to present our 0414 layout of thermometer column chart powerpoint graph. Our Layout of Thermometer Column Chart Powerpoint Graph Powerpoint Templates give you that extra zing. Add your views and make your audience sing. Our pretty Layout of Thermometer Column Chart Powerpoint Graph Powerpoint Templates are like snowflakes that fall. Gather them together and have a ball. Put your wondrously glowing ideas into them. Bind them together and create mayhem.
-
 0414 man woman perecntage column chart powerpoint graph
Hastily volatile shades, context, fonts, forms of PPT images, Dynamic PPT design in vector formats which can be exportable in to divergent forms like PDF or JPG, , Refurbish able Presentation graphics which is quite compatible with Google slides and other software’s applications, simply add relevant title or subtitles also, quite beneficial for social educationalists and scholars etc. Runs efficiently with all other software’s applications and all Google slides.
-
 0414 mobile bar graph column chart powerpoint graph
Cogently abstracted Presentation graphics makes it easy to interpret the related notion , Refine able matrix charts, designs, style, pattern, size of the PowerPoint images, An exclusive tool perfect for business managers, specialist, experts ,researchers and scholars etc. , PowerPoint slides can be easily exportable to various configurations like PDF or JPG. Easy to insert company logo or trademark, Option to add subsequent caption or subheadings also, well versed with Google slides and other programs.
-
 0414 pareto analysis column chart with stylized markers powerpoint graph
High-resolution images and the slide icons. Allow saving in the multiple formats like JPG or PDF format. Easy to edit and customize the content or the slide icons. 100% access to edit the background, style and orientation of the slide icons once downloaded. Provided guidance to customize the background or the slide icons content. Beneficial for the business leaders, sales and marketing professionals.
-
 0414 pareto variation with column line chart powerpoint graph
Pixel-friendly images and graphics in the icons. No effect on picture quality when used on a wide screen display. Attune well with the major online and offline softwares. Allow instant customization of the slide icons and the graphics. Provided instructions to customize the content and the slide icons. 100% editable slide icons. Useful for the business entrepreneurs and the marketing individuals.
-
 0414 percentage cylinders column chart 2 stages powerpoint graph
We are proud to present our 0414 percentage cylinders column chart 2 stages powerpoint graph. Put your wonderful verbal artistry on display. Our Percentage Cylinders Column Chart 2 Stages Powerpoint Graph Powerpoint Templates will provide you the necessary glam and glitter. You have the co-ordinates for your destination of sucess. Let our Percentage Cylinders Column Chart 2 Stages Powerpoint Graph Powerpoint Templates map out your journey.
-
 0414 percentage data champagne bottle column chart powerpoint graph
Picture quality does not deter when opened on a big screen display. Trouble-free incorporation of customized content or graphics. Provided guidance to modify the graphical content. Save the presentation visual in JPG or PDF format. Compatible with the online as well as offline PowerPoint softwares. Effectively useful for the Marketing professionals, interpreters and the strategy designers.
-
 0414 percentage data thermomete column chart powerpoint graph
The PPT images offer compatibility with Google templates. High resolution icons for clear message delivery. An easy access to make the desired changes or edit it anyways. Wide screen view of the slides. Easy conversion into JPG or PDF format. Unique and informational content. Valuable for health and care professionals.
-
 0414 percentage growth column chart powerpoint graph
Presentation slide supports changing the color, size and orientation of any icon to your liking. It’s easy for the PPT design to run smoothly on any software. All images are 100% editable in the presentation visual. Best feature being the conversion of presentation slide show to PDF or JPG format. Can be used by businesses of all sizes. Offers high resolution without compromising on pixels quality in PPT layout when viewed on a larger screen. Compatible with Google slides.
-
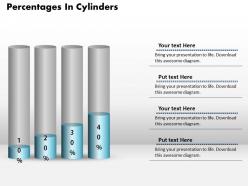 0414 percentage growth cylinders column chart powerpoint graph
We are proud to present our 0414 percentage growth cylinders column chart powerpoint graph. Bet on your luck with our Percentage Growth Cylinders Column Chart Powerpoint Graph Powerpoint Templates. Be assured that you will hit the jackpot. Let our Percentage Growth Cylinders Column Chart Powerpoint Graph Powerpoint Templates be the string of your bow. Fire of your ideas and conquer the podium.
-
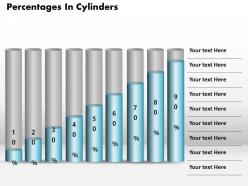 0414 percentage in cylinders 9 stages column chart powerpoint graph
We are proud to present our 0414 percentage in cylinders 9 stages column chart powerpoint graph. Tee off with our Percentage In Cylinders 9 Stages column chart Powerpoint Graph Powerpoint Templates. They will reward you with a hole in one. Launch your ideas with our Percentage In Cylinders 9 Stages column chart Powerpoint Graph Powerpoint Templates. Take your audience along on a magnificent flight.
-
 0414 percentage in cylinders 10 stages column chart powerpoint graph
Easy proofing and editing is added on feature of presentation visual. Presentation slide is useful in business marketing, management and recourse disbursement. Basic theme yet it can modified with respect to font, color and layout. Attractive color scheme gives a professional look to PPT layout. Conversion into PDF or JPG formats is very easy and handy. PPT graphic offers font size which can be read from a distance. Shapes are in vector format and can be edited.
-
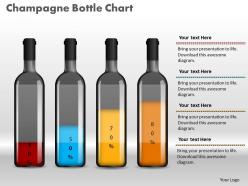 0414 percentage increase champagne bottle column chart powerpoint graph
Proofing and editing can be done with ease in PPT design. Smooth functioning is ensured by the presentation slide show on all software’s. Color, style and position can be standardized, supports font size which can be read from a distance. When projected on the wide screen the PPT layout does not sacrifice on pixels or color resolution.
-
 0414 percentage profit growth column chart powerpoint graph
All images are 100% editable in the presentation design. Changing the color, size and orientation of any icon to your liking is manageable in presentation slide. PPT design supports the best graphic features; icon list can be re arranged according to the requirement. Smooth animations, transitions and movement of objects across the slide. Beneficial by businessmen in marketing, service and sales departments and students.
-
 0414 percentage values donut and column chart powerpoint graph
Easy proofing and editing is added on feature of presentation visual. Presentation slide is useful in business marketing, management and recourse disbursement. Basic theme yet it can modified with respect to font, color and layout. Attractive color scheme gives a professional look to PPT layout. Conversion into PDF or JPG formats is very easy and handy. PPT graphic offers font size which can be read from a distance.
-
 0414 percentage increase in battery column chart powerpoint graph
Useful for professionals working in corporates and college going students studying finance. Easily convertible into JPEG and PDF. High resolution graphics will not pixilate on bigger or wider screen. Customisable PPT layout in terms of orientation, design, color and text. Add titles and sub-titles as it has ample space. Compatible with Google slides and runs with all softwares. Company’s name, logo and trademark can be added conveniently. Easy to download due to small size.
-
 0414 progress in 8 steps column chart powerpoint graph
Runs very well with softwares and is compatible with Google slides. Easy to download and consumes less space. Company’s name logo and trademark can be inserted. Picture graphics do not pixilate even when shown on a bigger screen. No space constraints while mentioning titles and sub-titles. Changeable orientation, font text, design and color. Convertible into PDF and JPEG. Useful for professionals preparing any progress related presentation.
-
 0414 progress thermometer column chart powerpoint graph
We are proud to present our 0414 progress thermometer column chart powerpoint graph. Our Progress Thermometer Column Chart Powerpoint Graph Power Point Templates Will Provide Weight To Your Words. They Will Bring Out The Depth Of Your Thought Process. Words Like Arrows Fly Straight And True. Use Our Progress Thermometer Column Chart Powerpoint Graph Power Point Templates To Make Them Hit Bulls eye Every time.
-
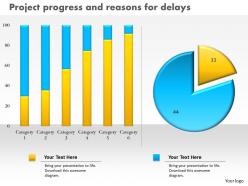 0414 project progress with column and pie chart powerpoint graph
Runs with all the softwares and is compatible with Google slides. Does not use much space and is easy to download. Provision to add name and logo of the company. Picture graphics never pixilate even if projected on bigger screens. Add titles and sub-titles as there is plenty of space. Changeable layout in terms of font text, color, design and orientation. Convertible into JPEG and PDF formats. Useful for business and progress related presentations.
-
 0414 pyramid style column chart powerpoint graph
Useful for business and growth related presentations. High resolution graphics do not pixilate when projected on bigger and wider screens. Runs smoothly with softwares and is compatible with Google slides. The layout can accommodate company’s logo, trademark and name. Provision to add sub-titles and titles as there are no space constraints. Changeable layout in terms of orientation, color, font text and design. Convertible into common formats like JPEG and PDF.
-
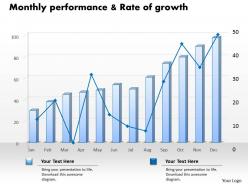 0414 rate of growth column line chart powerpoint graph
Beneficial for the business managers, marketing professionals and the strategy designers. Access to convert the presentation design into JPG and PDF. Offer 100% access to change the size and style of the slides once downloaded and saved in the desired format. High quality images and visuals used in the designing process. Choice to get presentation slide in standard or in widescreen view. Easy to convert in JPEG and PDF document. Compatible with Google slides.
-
 0414 running person on column chart powerpoint graph
Access to download and save in the JPG or PDF format. Convenient to be used on a wide screen view. Edit the size, style and orientation of the visuals and shapes. Follow given instructions to modify the slide template. The slide offers easy and effortless modification. Compatible with Google slides also. No effect on the picture quality whatever be the size of your screen. Useful for industry professionals, managers, executives, researchers, sales people, etc.
-
 0414 sales and profit column line chart powerpoint graph
Fast and simple to download without unnecessary hassles. Thoroughly editable PowerPoint presentation. Modify the charts at your personal comfort and need. Download and save the presentation in desired format. Compatible with wide variety of online and offline software options. Available in both Standard and Widescreen slide sizes. Add this slide anywhere within your own slides for maximum impact.
-
 0414 sales volume column and line chart powerpoint graph
High resolution images do not pixelate when projected on wide screen. Personalize the PPT with your company name and logo. Modify the presentation elements as per the need of an hour. Compatible with numerous software and format options. Used by entrepreneurs, marketers, managerial department, stakeholders and students. Self-explanatory and intellectual slide charts. Access to edit the content, style, size and orientation of the PPT slides.
-
 0414 slider bar graph column chart powerpoint graph
Flexible presentation design with amazing picture quality. Excel linked design so you can make changes in the excel sheet and the design will change accordingly. Variation is possible with color, text, font and shape. Prompt download and can be changed in JPEG and PDF format. Gives a specialized effect to your Presentation template. Alternate to customize the design by adding business badge, icon and symbol. PowerPoint slide exhibited in standard and widescreen view. Useful for corporate sale experts, finance strategists, professionals.
-
 0414 slider column chart data illustration powerpoint graph
Amendable presentation design with amazing picture quality. Modification is possible with color, text, font and shape. Excel linked design so you can make changes in the excel sheet and the design will change accordingly. Prompt download and can be changed in JPEG and PDF format. Gives a specialized effect to your Presentation template. Alternate to customize the design by adding business badge, icon and symbol. PowerPoint slide exhibited in standard and widescreen view. Useful for marketing people, corporate managers, revenue department and human resource teams.
-
 0414 slider column chart data series powerpoint graph
High resolution graphics. PPT slide can be presented in both standard and widescreen view. Completely editable slide as colors, icons, and text can be change as per the need. Quick download. Effortless addition of company name, trademark/ logo. PPT templates are well-harmonized with Google slides. Excel linked design so you can make changes in the excel sheet and the design will change accordingly. Beneficial for business owners, marketers, shareholders, financiers, investors, entrepreneurs.
-
 0414 slider column chart for business presenations powerpoint graph
Easily editable presentation layout as color, text and font are editable. PowerPoint designs are totally compatible with Google slides. Effortlessly download and changeable into JPEG and PDF document. Choice of insertion of corporate symbol and image for personalization. Presentable and easy to comprehend info graphic format. PPT slide can be presented in both standard and widescreen view. Excel linked design so you can make changes in the excel sheet and the design will change accordingly.
-
 0414 slider column chart for business trends powerpoint graph
We are proud to present our 0414 slider column chart for business trends powerpoint graph. Our Slider Column Chart For Business Trends Powerpoint Graph Powerpoint Templates offer you the needful to organize your thoughts. Use them to list out your views in a logical sequence. Our Slider Column Chart For Business Trends Powerpoint Graph Powerpoint Templates are created by a hardworking bunch of busy bees. Always flitting around with solutions guaranteed to please.
-
 0414 slider column chart for communicating data powerpoint graph
Simply adjustable PowerPoint templates as changes accepted with color, text and shape. PPT templates are well-harmonized with Google slides. Presentation slide can be displayed in standard and widescreen view. Give personal touch to the presentation with business symbol, name and image. Excel linked design so you can make changes in the excel sheet and the design will change accordingly. Easy to download and change into other format such as JPEG and PDF. Valuable for business managers, communication and marketing executives, sales and advertising agencies.
-
 0414 slider column chart for comparing data powerpoint graph
We are proud to present our 0414 slider column chart for comparing data powerpoint graph. Clear and concise is the credo of our Slider Column Chart For Comparing Data Powerpoint Graph Powerpoint Templates. Use them and dispel any doubts your team may have. Effective communication is what our Slider Column Chart For Comparing Data Powerpoint Graph Powerpoint Templates ensure. They help you put across your views with precision and clarity.
-
 0414 slider column chart for data series powerpoint graph
Image quality remain the unchanged after resizing. Change PowerPoint design’s font, text, color and design as per your way. Ideal for marketing professionals, business managers, entrepreneurs and big organizations. This presentation theme is totally attuned with Google slide. Easy conversion to other software’s like JPG and PDF formats. Trouble-free to put in company logo, brand or name.
-
 0414 slider column chart for market trends powerpoint graph
Picture quality remain similar even when you project it on big screen. Convert presentation slide fonts, text, color and design as per your style. Straightforwardly converted to other software application like JPG and PDF formats. Great for sales and marketing and entrepreneurs. This presentation theme is totally compatible with Google slides. Simple to put in company logo, brand or name.
-
 0414 slider column chart with bars powerpoint graph
We are proud to present our 0414 slider column chart with bars powerpoint graph. Our Slider Column Chart With Bars Powerpoint Graph Powerpoint Templates are the chords of your song. String them along and provide the lilt to your views. Our Slider Column Chart With Bars Powerpoint Graph Powerpoint Templates help you pinpoint your timelines. Highlight the reasons for your deadlines with their use.
-
 0414 tablate with bar graph column chart powerpoint graph
We are proud to present our 0414 tablate with bar graph column chart powerpoint graph. Our Tablate With Bar Graph Column Chart Powerpoint Graph Powerpoint Templates are the essential beat of your lilting melody. Adorn them with your tuneful thoughts and top the charts. Our Tablate With Bar Graph Column Chart Powerpoint Graph Powerpoint Templates give you a court to play on. Dribble your way along and score a goal.
-
 0414 thermometer 4 staged column chart powerpoint graph
We are proud to present our 0414 thermometer 4 staged column chart powerpoint graph. Our Thermometer 4 Staged Column Chart Powerpoint Graph Powerpoint Templates are the layers of your gourmet cake. Provide the icing of your ideas and produce a masterpiece. Use our Thermometer 4 Staged Column Chart Powerpoint Graph Powerpoint Templates and and feel the difference. Right off they generate a surge of interest.
-
 0414 thermometer business design column chart powerpoint graph
We are proud to present our 0414 thermometer business design column chart powerpoint graph. Whatever the nuance you want to project. We have a Thermometer Business Design Column Chart Powerpoint Graph Powerpoint Templates that will get it across. Create a connection with your audience using our Thermometer Business Design Column Chart Powerpoint Graph Powerpoint Templates. Transfer your depth of knowledge clearly across to them.
-
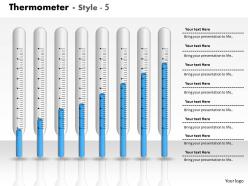 0414 thermometer business graph column chart powerpoint graph
We are proud to present our 0414 thermometer business graph column chart powerpoint graph. Let our Thermometer Business Graph Column Chart Powerpoint Graph Powerpoint Templates be the vehicle of your sucessful journey. Ride the bus to glory with your grand ideas. Our Thermometer Business Graph Column Chart Powerpoint Graph Powerpoint Templates are like a basic christmas tree. Decorate it with your beautiful thoughts and spread joy and happiness.
-
 0414 thermometer column chart business layout powerpoint graph
We are proud to present our 0414 thermometer column chart business layout powerpoint graph. Our Thermometer Column Chart Business Layout Powerpoint Graph Powerpoint Templates provide the links in your chain of thought. Once intertwined they enhance the strength of your words. Our Thermometer Column Chart Business Layout Powerpoint Graph Powerpoint Templates are like ingredients in your recipe of sucess. Stir them together and get people licking their lips.
-
Great designs, Easily Editable.
-
I discovered this website through a google search, the services matched my needs perfectly and the pricing was very reasonable. I was thrilled with the product and the customer service. I will definitely use their slides again for my presentations and recommend them to other colleagues.
-
Awesomely designed templates, Easy to understand.
-
Unique research projects to present in meeting.
-
Innovative and Colorful designs.
-
Unique design & color.
-
Very unique and reliable designs.
-
Very unique and reliable designs.
-
Appreciate the research and its presentable format.
-
Amazing product with appealing content and design.


