- Sub Categories
-
 Financials expectations for our company ppt inspiration
Presenting financials expectations for our company ppt inspiration. This is a financials expectations for our company ppt inspiration. This is a four stage process. The stages in this process are product version, product version, product version, product version.
-
 Financials what are we expecting powerpoint slide deck samples
Presenting financials what are we expecting powerpoint slide deck samples. This is a financials what are we expecting powerpoint slide deck samples. This is a four stage process. The stages in this process are business, financials, marketing, management, success.
-
 Financials what are we expecting powerpoint slide deck template
Presenting financials what are we expecting powerpoint slide deck template. This is a financials what are we expecting powerpoint slide deck template. This is a four stage process. The stages in this process are product version, business, marketing, financials, success.
-
 Financials what are we expecting powerpoint themes
Presenting financials what are we expecting powerpoint themes. This is a financials what are we expecting powerpoint themes. This is a four stage process. The stages in this process are product version, business, marketing, financials, success.
-
 Financials what are we expecting ppt example file
Presenting financials what are we expecting ppt example file. This is a financials what are we expecting ppt example file. This is a four stage process. The stages in this process are arrows, product version, business, marketing, process, success.
-
 Inflation rate powerpoint slide backgrounds
Presenting inflation rate powerpoint slide backgrounds. This is a inflation rate powerpoint slide backgrounds. This is a twelve stage process. The stages in this process are jan, feb, mar, apr, may, jun, jul, aug, sep, oct, nov, dec.
-
 Lead scoring ppt images
Presenting lead scoring ppt images. This is a lead scoring ppt images. This is a four stage process. The stages in this process are adoption of lead scoring solutions chosen, projects completed, number of scoring rules, number of dimensions.
-
 Market size and customer revenue analysis powerpoint presentation examples
Presenting market size and customer revenue analysis powerpoint presentation examples. This is a market size and customer revenue analysis powerpoint presentation examples. This is a six stage process. The stages in this process are in team users, in team revenue, from customer, we are planning to acquire users first and then paid customer, advertisers, event organizers.
-
 Marketing reach by channels ppt examples
Presenting marketing reach by channels ppt examples. This is a marketing reach by channels ppt examples. This is a two stage process. The stages in this process are which marketing channel is growing fastest, influencer engagement use cases.
-
 Net fixed asset turnover powerpoint show
Presenting net fixed asset turnover powerpoint show. This is a net fixed asset turnover powerpoint show. This is a six stage process. The stages in this process are business, marketing, process, analysis, success, management.
-
 Profit after tax pat powerpoint slide designs download
Presenting profit after tax pat powerpoint slide designs download. This is a profit after tax pat powerpoint slide designs download. This is a five stage process. The stages in this process are pat, pat margins, category.
-
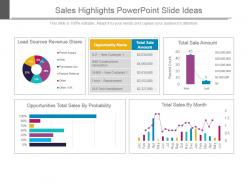 Sales highlights powerpoint slide ideas
Presenting sales highlights powerpoint slide ideas. This is a sales highlights powerpoint slide ideas. This is a five stage process. The stages in this process are lead sources revenue share, opportunity name, total sale amount, total sale amount, opportunities total sales by probability, total sales by month.
-
 Shareholders fund and market cap powerpoint slide information
Presenting shareholders fund and market cap powerpoint slide information. This is a shareholders fund and market cap powerpoint slide information. This is a five stage process. The stages in this process are shareholders, funds, market capitalization, market capitalization as a percentage of cse market capitalization.
-
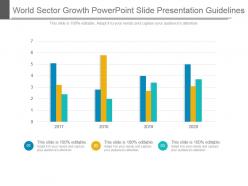 World sector growth powerpoint slide presentation guidelines
Presenting world sector growth powerpoint slide presentation guidelines. This is a world sector growth powerpoint slide presentation guidelines. This is a four stage process. The stages in this process are business, process, growth, success, marketing, strategy.
-
 Year based financial analysis powerpoint ideas
Presenting year based financial analysis powerpoint ideas. This is a year based financial analysis powerpoint ideas. This is a four stage process. The stages in this process are product version, business, marketing, process, success.
-
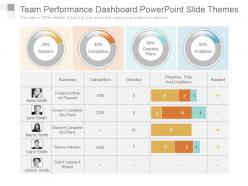 Team performance dashboard powerpoint slide themes
Presenting team performance dashboard powerpoint slide themes. This is a team performance dashboard powerpoint slide themes. This is a four stage process. The stages in this process are summary, completion, overdue, progress, plan and problems, reward, finished what he planned, doesnt complete his plans, doesnt complete his plans, shows initiative, didnt submit a report.
-
 Kpi dashboard ppt infographic template
Presenting kpi dashboard ppt infographic template. This is a Kpi Dashboard Ppt Infographic Template. This is a four stage. The Stages in this process are outcasts, successful adverts, earned revenue, sold products, operations.
-
 Performance comparison ppt infographics
Presenting performance comparison ppt infographics. This is a performance comparison ppt infographics. This is a two stage. The Stages in this process are customer focus, accountability, service excellence, problem solving, continuous improvement, collaborative conflict resolution.
-
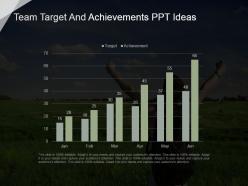 Team target and achievements ppt ideas
Presenting team target and achievements ppt ideas. This is a team target and achievements ppt ideas. This is a six stage. The Stages in this process are target, achievement, jan, feb, mar, apr, may, jun.
-
 Feasible set of portfolio powerpoint images
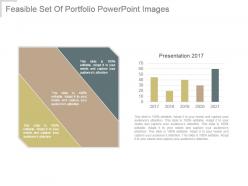
Presenting feasible set of portfolio powerpoint images. This is a feasible set of portfolio powerpoint images. This is a two stage process. The stages in this process are years, planning, business, finance, marketing.
-
 Portfolio evaluation example ppt presentation
Presenting portfolio evaluation example ppt presentation. This is a portfolio evaluation example ppt presentation. This is a two stage process. The stages in this process are peso govt debt securities, foreign govt debt securities, peso corporate debt securities, dollar corporate debt securities, equity.
-
 Feasible set of portfolio powerpoint slide backgrounds
Presenting feasible set of portfolio powerpoint slide backgrounds. This is a feasible set of portfolio powerpoint slide backgrounds. This is a five stage process. The stages in this process are years, planning, presentation, business, marketing.
-
 Portfolio evaluation powerpoint show
Presenting portfolio evaluation powerpoint show. This is a portfolio evaluation powerpoint show. This is a two stage process. The stages in this process are peso govt debt securities, foreign govt debt securities, peso corporate debt securities, dollar corporate debt securities, equity.
-
 Risk return plot powerpoint slide deck template
Presenting risk return plot powerpoint slide deck template. This is a risk return plot powerpoint slide deck template. This is a nine stage process. The stages in this process are annualized return, annualized standard deviation.
-
 Selection of the optimal portfolio powerpoint slide backgrounds
Presenting selection of the optimal portfolio powerpoint slide backgrounds. This is a selection of the optimal portfolio powerpoint slide backgrounds. This is a three stage process. The stages in this process are success, business, marketing, presentation, management.
-
 Feasible set of portfolio powerpoint slide designs
Presenting feasible set of portfolio powerpoint slide designs. This is a feasible set of portfolio powerpoint slide designs. This is a two stage process. The stages in this process are arrow, business, marketing, success, strategy, management.
-
 Portfolio evaluation powerpoint slide designs download
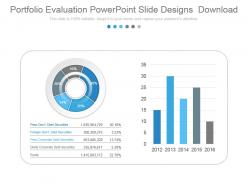
Presenting portfolio evaluation powerpoint slide designs download. This is a portfolio evaluation powerpoint slide designs download. This is a two stage process. The stages in this process are peso govt debt securities, foreign govt debt securities, peso corporate debt securities, dollar corporate debt securities, equity.
-
 Pareto analysis powerpoint slide deck
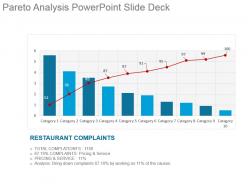
Presenting pareto analysis powerpoint slide deck. This is a pareto analysis powerpoint slide deck. This is a ten stage process. The stages in this process are restaurant complaints, total complaints, complaints pricing and service, pricing and service, analysis bring down complaints, category.
-
 Pareto chart powerpoint slide clipart
Presenting pareto chart powerpoint slide clipart. This is a pareto chart powerpoint slide clipart. This is a eight stage process. The stages in this process are category, reason.
-
 Process capability measurement powerpoint guide
Presenting process capability measurement powerpoint guide. This is a process capability measurement powerpoint guide. This is a nine stage process. The stages in this process are lsl, usl, category, target.
-
 4 quarters track record ppt ideas
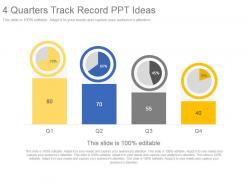
Presenting 4 quarters track record PPT template. Beneficial for the business managers, marketing professionals and the strategy designers. Access to convert the presentation design into JPG and PDF. Offer 100% access to change the size and style of the slides once downloaded and saved in the desired format. Choice to get presentation slide in standard or in widescreen view. Easy to convert in JPEG and PDF document. Compatible with Google slides. Easy and hassle-free downloading process.
-
 Funnel forecast review ppt examples slides
Presenting funnel forecast review ppt examples slides. This is a funnel forecast review ppt examples slides. This is a two stage process. The stages in this process are jan, feb, mar, apr, may, jun, jul, aug, sep, oct, nov, dec.
-
 Our research results powerpoint slide templates download
Presenting our research results powerpoint slide templates download. This is a our research results powerpoint slide templates download. This is a four stage process. The stages in this process are business, management, presentation, finance, marketing.
-
 Our research results ppt examples professional
Presenting our research results ppt examples professional. This is a our research results ppt examples professional. This is a four stage process. The stages in this process are business, management, presentation, finance, marketing.
-
 Quarter track record ppt examples professional
Presenting quarter track record ppt examples professional. This is a quarter track record ppt examples professional. This is a four stage process. The stages in this process are series.
-
 Kpi Dashboard Snapshot Powerpoint Ideas
Fabulously composed PPT design useful for business professionals, organizational experts or researchers , students and many more from diverse areas , Comprehensive and convenient PPT Images with ductile dummy data options, Consonant with all available graphic software’s and Google slides, Accessible to other file configurations like PDF or JPG. Multi-color options, background images, styles and other characteristics are fully editable, Expeditious downloading process, Allows to introduce your company logo or brand name in the PPT slides.
-
 Our growth profit presentation design
Presenting our growth profit presentation design. This is a our growth profit presentation design. This is a five stage process. The stages in this process are business, marketing, achievement, success, graph, target, arrows.
-
 Revenue generation company performance sample of ppt
Presenting revenue generation company performance sample of ppt. This is a revenue generation company performance sample of ppt. This is a four stage process. The stages in this process are business, marketing, graph, percentage, success.
-
 Channel sales dashboard powerpoint slide show
Presenting channel sales dashboard powerpoint slide show. This is a channel sales dashboard powerpoint slide show. This is a four stage process. The stages in this process are business, marketing, line chart, dashboard, management.
-
 Comparison world market trends powerpoint template
Presenting comparison world market trends powerpoint template. This is a comparison world market trends powerpoint template. This is a seven stage process. The stages in this process are latin america, canada, japan, europe, asia pacific, us, rest of world.
-
 Competitor revenue analysis powerpoint template
Presenting competitor revenue analysis powerpoint template. This is a competitor revenue analysis powerpoint template. This is a five stage process. The stages in this process are revenue, profit, in percentage, competitor.
-
 Competitors analysis graph powerpoint slide
Presenting competitors analysis graph powerpoint slide. This is a competitors analysis graph powerpoint slide. This is a six stage process. The stages in this process are in percentage, competitor.
-
 Market growth bar graph ppt template
Presenting market growth bar graph ppt template. This is a market growth bar graph ppt template. This is a eight stage process. The stages in this process are market size, growth rate.
-
 Market size comparison and demand forecasts ppt slide
Presenting market size comparison and demand forecasts ppt slide. This is a market size comparison and demand forecasts ppt slide. This is a two stage process. The stages in this process are asia pacific the largest market, market projected to reach.
-
 Product category positioning ppt slide
Presenting product category positioning ppt slide. This is a product category positioning ppt slide. This is a two stage process. The stages in this process are gaining market share, losing market share, average market growth, company growth, market share, sales in millions.
-
 Campaign performance ppt icon
Presenting campaign performance ppt icon. Presenting campaign performance ppt icon. This is a campaign performance ppt icon. This is a two stage process. The stages in this process are leads, brand, sales, loyalty.
-
 Agency performance powerpoint layout
Presenting agency performance powerpoint layout. This is a agency performance powerpoint layout. This is a four stage process. The stages in this process are tra score, ad fraud, viewability, brand safety, industry snapshot.
-
 Campaign performance powerpoint graphics
Presenting campaign performance powerpoint graphics. This is a campaign performance powerpoint graphics. This is a four stage process. The stages in this process are brand, leads, sales, loyalty.
-
 Competitor analysis framework powerpoint presentation templates
Presenting competitor analysis framework powerpoint presentation templates. This is a competitor analysis framework powerpoint presentation templates. This is a five stage process. The stages in this process are revenue, profit, in percentage, competitor.
-
 Market size calculation and forecasting powerpoint slide design ideas
Presenting market size calculation and forecasting powerpoint slide design ideas. This is a market size calculation and forecasting powerpoint slide design ideas. This is a eight stage process. The stages in this process are market size rmb, growth rate, market size.
-
 Market trends analysis powerpoint slide design templates
Presenting market trends analysis powerpoint slide design templates. This is a market trends analysis powerpoint slide design templates. This is a seven stage process. The stages in this process are rest of word, us, asia pacific, europe, japan, canada, latin america.
-
 Market trends report in marketing plan powerpoint slide designs
Presenting market trends report in marketing plan powerpoint slide designs. This is a market trends report in marketing plan powerpoint slide designs. This is a seven stage process. The stages in this process are africa, middle east, latin america, eastern europe, north america, asia, western europe, in percentage.
-
 Brand engagement powerpoint presentation example slides
Presenting brand engagement powerpoint presentation example slides. This is a brand engagement powerpoint presentation example slides. This is a four stage process. The stages in this process are engagement, monthly, weekly, brand.
-
 Corporate growth over the years presentation graphic visual
Presenting corporate growth over the years presentation graphic visual. This is a corporate growth over the years presentation graphic visual. This is a five stage process. The stages in this process are graph, success, business, marketing, growth.
-
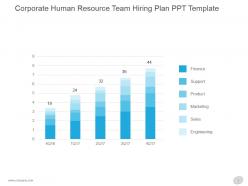 Corporate human resource team hiring plan ppt template
Presenting corporate human resource team hiring plan ppt template. This is a corporate human resource team hiring plan ppt template. This is a five stage process. The stages in this process are finance, support, product, marketing, sales, engineering.
-
 Graphical representation for total business revenue presentation layout
Presenting graphical representation for total business revenue presentation layout. This is a graphical representation for total business revenue presentation layout. This is a nine stage process. The stages in this process are graph, success, business, marketing, growth, management.
-
 Gross margin improvement powerpoint presentation diagram
Presenting gross margin improvement powerpoint presentation diagram. This is a gross margin improvement powerpoint presentation diagram. This is a two stage process. The stages in this process are chart title, q.
-
 Product line revenue for q1 q2 q3 q4 presentation chart diagram
Presenting product line revenue for q1 q2 q3 q4 presentation chart diagram. This is a product line revenue for q1 q2 q3 q4 presentation chart diagram. This is a four stage process. The stages in this process are product, q.
-
 Histograms powerpoint chart ppt slide
Presenting histograms powerpoint chart ppt slide. This is a histograms powerpoint chart ppt slide. This is a five stage process. The stages in this process are data collection histograms, histogram, profit in thousands.
-
 Analysis techniques pareto analysis ppt sample
Presenting analysis techniques pareto analysis ppt sample. This is a analysis techniques pareto analysis ppt sample. This is a five stage process. The stages in this process are analysis techniques pareto analysis.
-
Designs have enough space to add content.
-
Informative design.
-
Colors used are bright and distinctive.
-
Nice and innovative design.
-
Great designs, Easily Editable.
-
Excellent work done on template design and graphics.
-
Really like the color and design of the presentation.
-
Visually stunning presentation, love the content.
-
Designs have enough space to add content.
-
Very unique, user-friendly presentation interface.


