- Sub Categories
-
 Donut pie chart ppt powerpoint presentation pictures graphic tips
Presenting this set of slides with name - Donut Pie Chart Ppt Powerpoint Presentation Pictures Graphic Tips. This is a five stage process. The stages in this process are Business, Strategy, Marketing, Analysis, Management.
-
 Loyalty program performance dashboard ppt powerpoint presentation pictures graphics
Presenting this set of slides with name - Loyalty Program Performance Dashboard Ppt Powerpoint Presentation Pictures Graphics. This is a six stage process. The stages in this process are Business, Strategy, Marketing, Analysis, Management.
-
 Promotion cost by channel ppt powerpoint presentation pictures mockup
Presenting this set of slides with name - Promotion Cost By Channel Ppt Powerpoint Presentation Pictures Mockup. This is a two stage process. The stages in this process are Business, Strategy, Marketing, Analysis, Management.
-
 Business development positions ppt powerpoint presentation file professional cpb
Presenting this set of slides with name - Business Development Positions Ppt Powerpoint Presentation File Professional Cpb. This is an editable two stages graphic that deals with topics like Business Development Positions to help convey your message better graphically. This product is a premium product available for immediate download, and is 100 percent editable in Powerpoint. Download this now and use it in your presentations to impress your audience.
-
 Business development projects ppt powerpoint presentation file show cpb
Presenting this set of slides with name - Business Development Projects Ppt Powerpoint Presentation File Show Cpb. This is an editable two stages graphic that deals with topics like Business Development Projects to help convey your message better graphically. This product is a premium product available for immediate download, and is 100 percent editable in Powerpoint. Download this now and use it in your presentations to impress your audience.
-
 Business strategy ppt powerpoint presentation file background cpb
Presenting this set of slides with name - Business Strategy Ppt Powerpoint Presentation File Background Cpb. This is an editable three stages graphic that deals with topics like Business Strategy to help convey your message better graphically. This product is a premium product available for immediate download, and is 100 percent editable in Powerpoint. Download this now and use it in your presentations to impress your audience.
-
 Consumer demands ppt powerpoint presentation file templates cpb
Presenting this set of slides with name - Consumer Demands Ppt Powerpoint Presentation File Templates Cpb. This is an editable two stages graphic that deals with topics like Consumer Demands to help convey your message better graphically. This product is a premium product available for immediate download, and is 100 percent editable in Powerpoint. Download this now and use it in your presentations to impress your audience.
-
 E commerce data management ppt powerpoint presentation file portrait cpb
Presenting this set of slides with name - E Commerce Data Management Ppt Powerpoint Presentation File Portrait Cpb. This is an editable two stages graphic that deals with topics like E Commerce Data Management to help convey your message better graphically. This product is a premium product available for immediate download, and is 100 percent editable in Powerpoint. Download this now and use it in your presentations to impress your audience.
-
 E commerce flow ppt powerpoint presentation file slide portrait cpb
Presenting this set of slides with name - E Commerce Flow Ppt Powerpoint Presentation File Slide Portrait Cpb. This is an editable two stages graphic that deals with topics like E Commerce Flow to help convey your message better graphically. This product is a premium product available for immediate download, and is 100 percent editable in Powerpoint. Download this now and use it in your presentations to impress your audience.
-
 Fourth party logistic ppt powerpoint presentation gallery visuals cpb
Presenting this set of slides with name - Fourth Party Logistic Ppt Powerpoint Presentation Gallery Visuals Cpb. This is an editable two stages graphic that deals with topics like Fourth Party Logistic to help convey your message better graphically. This product is a premium product available for immediate download, and is 100 percent editable in Powerpoint. Download this now and use it in your presentations to impress your audience.
-
 Increase sales ppt powerpoint presentation gallery templates cpb
Presenting this set of slides with name - Increase Sales Ppt Powerpoint Presentation Gallery Templates Cpb. This is an editable three stages graphic that deals with topics like Increase Sales to help convey your message better graphically. This product is a premium product available for immediate download, and is 100 percent editable in Powerpoint. Download this now and use it in your presentations to impress your audience.
-
 Innovative marketing ppt powerpoint presentation gallery themes cpb
Presenting this set of slides with name - Innovative Marketing Ppt Powerpoint Presentation Gallery Themes Cpb. This is an editable three stages graphic that deals with topics like Innovative Marketing to help convey your message better graphically. This product is a premium product available for immediate download, and is 100 percent editable in Powerpoint. Download this now and use it in your presentations to impress your audience.
-
 Key achievement ppt powerpoint presentation gallery templates cpb
Presenting this set of slides with name - Key Achievement Ppt Powerpoint Presentation Gallery Templates Cpb. This is an editable two stages graphic that deals with topics like Key Achievement to help convey your message better graphically. This product is a premium product available for immediate download, and is 100 percent editable in Powerpoint. Download this now and use it in your presentations to impress your audience.
-
 Level achievement ppt powerpoint presentation gallery demonstration cpb
Presenting this set of slides with name - Level Achievement Ppt Powerpoint Presentation Gallery Demonstration Cpb. This is an editable two stages graphic that deals with topics like Level Achievement to help convey your message better graphically. This product is a premium product available for immediate download, and is 100 percent editable in Powerpoint. Download this now and use it in your presentations to impress your audience.
-
 Key business metrics dashboard ppt powerpoint presentation icon clipart
Presenting this set of slides with name Key Business Metrics Dashboard Ppt Powerpoint Presentation Icon Clipart. This is a five process. The stages in this process are Finance, Analysis, Business, Investment, Marketing. This is a completely editable PowerPoint presentation and is available for immediate download. Download now and impress your audience.
-
 Current scenario for sales and marketing alignment powerpoint slides
Presenting this set of slides with name Current Scenario For Sales And Marketing Alignment Powerpoint Slides. This is a four stage process. The stages in this process are Finance, Marketing, Management, Investment, Analysis. This is a completely editable PowerPoint presentation and is available for immediate download. Download now and impress your audience.
-
 Data driven 3d area chart for quantiative data powerpoint slides
Template formats are altogether impeccable with Google slides. Respectable and straightforward into practical setup. Templates can be downloaded and saved into JPEG and PDF report. Determination to implant business name, logo or sign as per the need. Adaptable to share in widescreen see as pixels don't break. Comparative diagrams open with different centers and stages as required. Simple to adjust shading, content, content style and even shape. Useful for business experts, strategists, and corporate organization trend-setters.
-
 Data driven 3d area chart for time based data powerpoint slides
We are proud to present our data driven 3d area chart for time based data powerpoint slides. You can illustrate your ideas and imprint them in the minds of your team with data driven PPT chart.This layout helps you to impress upon the audience how your strategy will carry all to the top of the corporate heap.
-
 Data driven 3d bar chart as research tool powerpoint slides
We are proud to present our data driven 3d bar chart as research tool powerpoint slides. Bar charts compare distinct items or show single items at distinct intervals.This PPT diagram is one of the easiest ways to compare numbers. Make your presenations more interesting than just talk or print
-
 Data driven 3d bar chart for analyzing survey data powerpoint slides
We are proud to present our data driven 3d bar chart for analyzing survey data powerpoint slides. This PowerPoint chart can be used to illustrate many types of data. It should be used to make facts clearer and more understandable. Quick way for the audience to visualize what you are saying numbers trends up or down .
-
 Data driven 3d bar chart for business information powerpoint slides
We are proud to present our data driven 3d bar chart for business information powerpoint slides. The above template shows data driven bar chart.This ppt diagram is simple and practical techniques that have helped the leading people in business, sport and public service reach the pinnacles of their careers.
-
 Data driven 3d bar chart for business statistics powerpoint slides
We are proud to present our data driven 3d bar chart for business statistics powerpoint slides. This Professionally designed PowerPoint template shows bar chart for business statistics. Using visual representations to present data and evaluation of activities makes audience easier to understand.
-
 Data driven 3d bar chart for business trends powerpoint slides
We are proud to present our data driven 3d bar chart for business trends powerpoint slides. This PowerPoint chart can be used to illustrate many types of data. It should be used to make facts clearer and more understandable. Quick way for the audience to visualize what you are saying numbers trends up or down .
-
 Data driven 3d bar chart for comparison of time series data powerpoint slides
We are proud to present our data driven 3d bar chart for comparison of time series data powerpoint slides. This PowerPoint chart can be used to illustrate many types of data. It should be used to make facts clearer and more understandable. it can be very helpful in training employees to perform the process according to standardized procedures
-
 Data driven 3d bar chart for data interpretation powerpoint slides
We are proud to present our data driven 3d bar chart for data interpretation powerpoint slides. This PowerPoint diagram condense large amounts of information into easy-to-understand formats that clearly and effectively communicate important points. It should be used to make facts clearer and more understandable.
-
 Data driven 3d bar chart for data modification powerpoint slides
We are proud to present our data driven 3d bar chart for data modification powerpoint slides. This slide is an excellent backdrop for you to enlighten your audience on the process you have gone through and the vision you have for the future. It helps to focus the thoughts of your listeners.
-
 Data driven 3d bar chart for financial data solutions powerpoint slides
We are proud to present our data driven 3d bar chart for financial data solutions powerpoint slides. Develop competitive advantage with our above template which enables users to create and present topics. This is an easy and effective way to present process. Use this chart to bring facts to life.
-
 Data driven 3d bar chart for market surveys powerpoint slides
We are proud to present our data driven 3d bar chart for market surveys powerpoint slides. This PowerPoint Layout can explain the relevance of the different stages in getting down to your core competence, ability and desired result. It educates your team with your thoughts and logic.
-
 Data driven 3d bar chart for research in statistics powerpoint slides
Presenting data driven 3d bar chart for research in statistics presentation slides. Effortlessly alterable template slide as stats in excel sheet styles are customizable. This presentation slide is entirely flexible with Google Slides. Easy to download this template and save into JPEG and PDF format. Application of the best graphics, color, and icons. Quick to insert organization image, name, signature, copyright and picture for personalization of slide. Graphics quality does not get harm when displayed on widescreen. Instructional slides are available for guidance.
-
 Data driven 3d bar chart to compare categories powerpoint slides
We are proud to present our data driven 3d bar chart to compare categories powerpoint slides. You can present your opinions using this impressive template. It helps your team to align their arrows to consistently be accurate. Use this slide to highlight your thought process.
-
 Data driven 3d bar chart to dispaly data powerpoint slides
We are proud to present our data driven 3d bar chart to dispaly data powerpoint slides. This PowerPoint diagram helps you to determine the number of activities to be studied and the number of people involved in the process.Transmit your thoughts via this slide and prods your team to action.
-
 Data driven 3d bar chart to put information powerpoint slides
We present to you this data driven 3D bar chart to put information PowerPoint slides. As the PPT presentation is fully editable you can change the font size, font style and the font color used in the pre-designed slides. You can save the presentation in JPG or PDF format. The slides can also be viewed in standard size display ratio of 4:3 or widescreen display ratio of 16:9. The template is compatible with Google slides, which makes it even easier to use.
-
 Data driven 3d business changes with time powerpoint slides
We are proud to present our data driven 3d business changes with time powerpoint slides. A bar graph is composed of discrete bars that represent different categories of data. The length or height of the bar is equal to the quantity within that category of data. Bar graphs are best used to compare values across categories.
-
 Data driven 3d business data on regular intervals powerpoint slides
We are proud to present our data driven 3d business data on regular intervals powerpoint slides. A bar graph is composed of discrete bars that represent different categories of data. The length or height of the bar is equal to the quantity within that category of data. Bar graphs are best used to compare values across categories.
-
 Data driven 3d business inspection procedure chart powerpoint slides
Presenting, data driven 3d business inspection procedure chart PowerPoint slides. High-resolution PPT slides to address the inspection procedure formation. The content is authoritative and ready to use. Modifiable background, color, layout, and font style and font type. Can be quickly converted into PDF and JPG format. The appealing layout for comparison and captivating figures to demonstrate the concept. Compatible with google slides and can be converted into pdf or jpeg format as per the need.
-
 Data driven 3d business intelligence and data analysis powerpoint slides
We are proud to present our data driven 3d business intelligence and data analysis powerpoint slides. A bar graph is composed of discrete bars that represent different categories of data. The length or height of the bar is equal to the quantity within that category of data. Bar graphs are best used to compare values across categories.
-
 Data driven 3d business trend series chart powerpoint slides
We are proud to present our data driven 3d business trend series chart powerpoint slides. A bar graph is composed of discrete bars that represent different categories of data. The length or height of the bar is equal to the quantity within that category of data. Bar graphs are best used to compare values across categories.
-
 Data driven 3d categories of data sets powerpoint slides
We are proud to present our data driven 3d categories of data sets powerpoint slides. A bar graph is composed of discrete bars that represent different categories of data. The length or height of the bar is equal to the quantity within that category of data. Bar graphs are best used to compare values across categories.
-
 Data driven 3d change in business process chart powerpoint slides
We are proud to present our data driven 3d change in business process chart powerpoint slides. A bar graph is composed of discrete bars that represent different categories of data. The length or height of the bar is equal to the quantity within that category of data. Bar graphs are best used to compare values across categories.
-
 Data driven 3d chart for business observation powerpoint slides
We are proud to present our data driven 3d chart for business observation powerpoint slides. A bar graph is composed of discrete bars that represent different categories of data. The length or height of the bar is equal to the quantity within that category of data. Bar graphs are best used to compare values across categories.
-
 Data driven 3d chart for interpretation of statistics powerpoint slides
We are proud to present our data driven 3d chart for interpretation of statistics powerpoint slides. A bar graph is composed of discrete bars that represent different categories of data. The length or height of the bar is equal to the quantity within that category of data. Bar graphs are best used to compare values across categories.
-
 Data driven 3d chart for quality characterstics powerpoint slides
We are proud to present our data driven 3d chart for quality characterstics powerpoint slides. A bar graph is composed of discrete bars that represent different categories of data. The length or height of the bar is equal to the quantity within that category of data. Bar graphs are best used to compare values across categories.
-
 Data driven 3d chart for statistical process powerpoint slides
Designed comes with professional approach as color and shape blend well. PowerPoint design can be viewed in standard and widescreen view. Easy to adjustable PPT slide as works well Google slides. Presentation template is easy to edit and amend elements like font, text, color etc. Top in picture and pixel quality. Harmonious with software options such as JPEG and PDF. PowerPoint graphic can be modified with corporate details as it comes with access to add business name
-
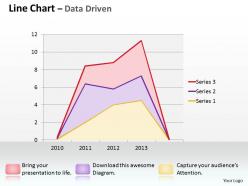 Data driven line chart shows revenue trends powerpoint slides
We are proud to present our data driven line chart shows revenue trends powerpoint slides. This PowerPoint diagram helps you chart the course of your presentation.This unique image makes your presentations professional and interactive. Deliver amazing presentations to mesmerize your audience.
-
 Data driven line chart to demonstrate data powerpoint slides
We are proud to present our data driven line chart to demonstrate data powerpoint slides. This line chart displays information as a series of data points connected by straight line segments.You can illustrate your ideas and imprint them in the minds of your team with this PPT diagram
-
 Data driven market analysis line chart powerpoint slides
We are proud to present our data driven market analysis line chart powerpoint slides. This Line chart is ideal for showing trends over time. A standard example would be how the stock value for a certain company develops over time. Impress upon audience with this PPT diagram
-
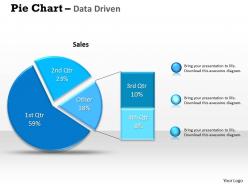 Data driven percentage breakdown pie chart powerpoint slides
We are proud to present our data driven percentage breakdown pie chart powerpoint slides. The above PowerPoint template contains a graphic of pie chart.This diagram can be used to represent the relationship and interconnectivity between various stages of a process.This diagram is wonderful tool to serve ypur purpopse.
-
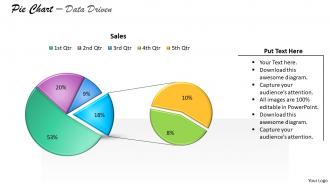 Data driven pie chart for business stratregy powerpoint slides
We are proud to present our data driven pie chart for business stratregy powerpoint slides. Use this diagram to show the steps as they actually occur in the process. Different color has been used in this diagram to represent each step which will help you to understand and depict the flow more accurately.
-
 Data driven pie chart for easy comparison powerpoint slides
We are proud to present our data driven pie chart for easy comparison powerpoint slides. This Pie charts is useful to compare different parts of a whole amount. It is often used to present financial information.Use this slide to transmit this clarity of purpose onto the eager minds of your team.
-
 Data driven pie chart for sales process powerpoint slides
We are proud to present our data driven pie chart for sales process powerpoint slides. This PowerPoint diagram can be used to compare sets of business data. You can see entire business processes at a glance using this diagram. You can clarify what works and what doesnt in your teams task and information flow, analyze problems, and identify areas for improvement
-
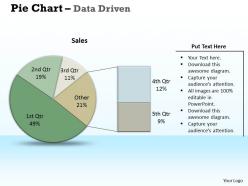 Data driven pie chart of market research powerpoint slides
We are proud to present our data driven pie chart of market research powerpoint slides. Use this data driven pie chart for market reasech. Pie charts are often used to compare data.Use this diagram to review factors that contribute to a specific situation. It helps you to take your team up to a higher level with your thoughts.
-
 Data driven plotting the business values powerpoint slides
We are proud to present our data driven plotting the business values powerpoint slides. This Radar chart is a very effective tool for comparing multiple entities based on different characteristics. This unique image makes your presentations professional and interactive. Deliver amazing presentations to mesmerize your audience.
-
 Data driven present data in scatter chart powerpoint slides
We are proud to present our data driven present data in scatter chart powerpoint slides. Use this Scatter chart to present business data in an effective way.This PPT diagram should be used to make facts clearer and more understandable.This is one of the easiest ways to compare facts and figures.
-
 Data driven radar chart displays multivariate data powerpoint slides
We are proud to present our data driven radar chart displays multivariate data powerpoint slides. There are a variety of different kinds of business data that you can use to display the information compiled in your reports. This ppt diagram making this process extremely easy to convert information into charts and graphs.
-
 Data driven radar chart to compare data powerpoint slides
We are proud to present our data driven radar chart to compare data powerpoint slides. This PowerPoint Diagram shows data driven rader chart this makes the business reporting process that much easier and meaningful. You can offer the information you have researched to your boss in a much more efficient manner .
-
 Data driven rader chart for rating items powerpoint slides
We are proud to present our data driven rader chart for rating items powerpoint slides. The purpose of this data driven radar chart is to compare options across parameters so that audience can be convinced. Your boss will appreciate the visual representation of the business components by this diagram.
-
 Data driven sales profit pie chart powerpoint slides
We are proud to present our data driven sales profit pie chart powerpoint slides. The above template displays data driven market trends scatter chart.Think outside the box and impress your boss by taking advantage of informative charts to support your recommendations.
-
 Data driven scatter chart for market trends powerpoint slides
We are proud to present our data driven scatter chart for market trends powerpoint slides. You should not waste all that time writing a report. Rather, you should spend your time analyzing the numbers and preparing a short presentation using this data driven chart.
-
 Data driven scatter chart mathematical diagram powerpoint slides
We are proud to present our data driven scatter chart mathematical diagram powerpoint slides. This data driven scatter graph is a popular chart style used to show the distribution and clustering of data. The scatter graph is best used when there are many data items which not evenly distributed in any dimension.
-
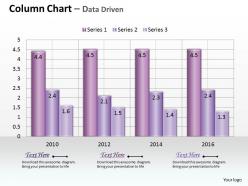 Data driven sets of business information powerpoint slides
We are proud to present our data driven sets of business information powerpoint slides. Use this PowerPoint chart to display business information. It gets easier to understand and interpret the data. This PowerPoint diagram allows you to present information in an intelligent and meaningful manner.
-
Illustrative design with editable content. Exceptional value for money. Highly pleased with the product.
-
Awesomely designed templates, Easy to understand.
-
Great quality product.
-
Excellent products for quick understanding.
-
Understandable and informative presentation.
-
Excellent design and quick turnaround.
-
Easily Understandable slides.
-
Topic best represented with attractive design.
-
Visually stunning presentation, love the content.
-
Helpful product design for delivering presentation.


