- Sub Categories
-
 1214 six staged tower diagram for representation powerpoint slide
We are proud to present our 1214 six staged tower diagram for representation powerpoint slide. Five staged tower diagram has been used to craft this power point template slide. This PPT slide contains the concept of data representation. Use this PPT slide for your business data related presentation.
-
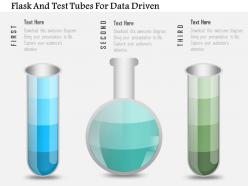 1214 flask and test tubes for data driven powerpoint slide
We are proud to present our 1214 flask and test tubes for data driven powerpoint slide. Graphic of flask and test tubes are used to craft this power point template slide. This PPT slide can be used for data driven measurement and analysis. Use this PPT slide for your science and math related presentation.
-
 1214 flask with data driven chart powerpoint slide
We are proud to present our 1214 flask with data driven chart powerpoint slide. This power point template slide has been designed with graphic of flask and data driven chart. This PPT slide contains the concept of data analysis for different measurement. Use this PPT and build quality presentation for your viewers.
-
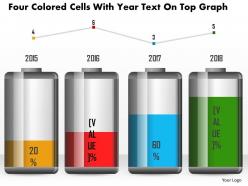 1214 four colored cells with year text on top graph powerpoint slide
We are proud to present our 1214 four colored cells with year text on top graph powerpoint slide. This Power Point template slide has been crafted with graphic of four colored cells and year text on top with graph. This PPT slide is usable for power technology and energy conservation related presentations.
-
 1214 Four Colored Pie Charts For Result Analysis Data Driven Powerpoint Slide
We are proud to present our 1214 four colored pie charts for result analysis data driven powerpoint slide. Four colored pie charts are used to craft this power point template slide. This PPT slide contains the concept of data driven result analysis. This PPT can be used for business and finance related presentations
-
 1214 four magnifying glasses with pie for data analysis powerpoint slide
We are proud to present our 1214 four magnifying glasses with pie for data analysis powerpoint slide. Four magnifying glasses are used to craft this power point template slide. This PPT slide also contains the graphic of pie graph. This PPT contains the concept of data driven search. This PPT can be used for business and finance related presentations
-
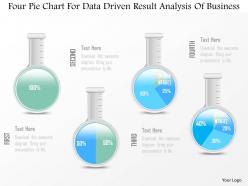 1214 four pie chart for data driven result analysis of business powerpoint slide
We are proud to present our 1214 four pie chart for data driven result analysis of business powerpoint slide. This Power Point template has been crafted with graphic of four pie charts. This PPT slide contains the concept of data driven result analysis. Use this PPT slide for your business and marketing related presentations.
-
 1214 green battery cell with full charging symbol powerpoint slide
We are proud to present our 1214 green battery cell with full charging symbol powerpoint slide. This power point template slide has been designed with graphic of green battery cell with full charging symbol. This PPT slide contains the concept of power technology and energy conservation. Use this PPT slide for your technology related presentations.
-
 1214 hour glass with 3d man and icons powerpoint slide
We are proud to present our 1214 hour glass with 3d man and icons powerpoint slide. Graphic of hour glass and 3d man with icons are used to craft this power point template slide. This PPT slide contains the concept of time management. Use this PPT slide for all your time related presentations.
-
 1214 human brain pie chart for business result analysis powerpoint slide
We are proud to present our 1214 human brain pie chart for business result analysis powerpoint slide. This power point template slide has been crafted with graphic of human brain and pie chart. This PPT slide also contains the concept of result analysis based on data. Use this PPT slide for your business intelligence related presentations.
-
 1214 human face with colored graph for data analysis powerpoint slide
We are proud to present our 1214 human face with colored graph for data analysis powerpoint slide. This power point template slide has been crafted with graphic of human face and colored graph. This PPT slide contains the concept data analysis for any business or financial data. Use this PPT slide and get good remarks from your viewers.
-
 1214 human icons with bubbles and different icons inside powerpoint slide
We are proud to present our 1214 human icons with bubbles and different icons inside powerpoint slide. This power point template slide has been crafted with graphic of human icons and bubbles. This PPT slide also contains the different icons. Use this PPT slide for your business development related presentations.
-
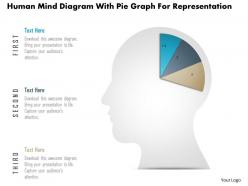 1214 human mind diagram with pie graph for representation powerpoint slide
We are proud to present our 1214 human mind diagram with pie graph for representation powerpoint slide. Human mind diagram with pie graph has been used to design this power point template slide. This PPT slide can be used for business data driven analysis and build an exclusive presentation for your viewers.
-
 1214 laptop with data driven area chart powerpoint slide
We are proud to present our 1214 laptop with data driven area chart powerpoint slide. Graphic of laptop and area chart has been used to craft this power point template slide. This PPT slide contains the concept of data analysis for any business process. This PPT slide can be used for any business presentation.
-
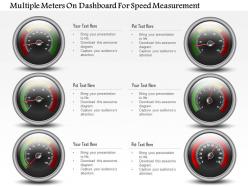 1214 Multiple Meters On Dashboard For Speed Measurement Powerpoint Slide
This template with speed meters is convenient to use. You can easily insert or remove any kind of figures or illustrations as per your requirements by simply following the instructions that have been given in the sample slides. The font size, font color and the font style that you use in the slides is 100% editable and can be changed easily as per your needs. You can get these slides in widescreen display with ratio of 16:9 by just a click. You can even upload these slides to Google Slides and they will work automatically. Also you can save the template in JPG or PDF format.
-
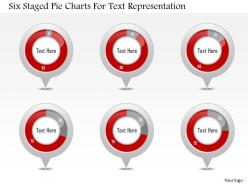 1214 six staged pie charts for text representation powerpoint slide
We are proud to present our 1214 six staged pie charts for text representation powerpoint slide. six staged pie charts are used to craft this power point template slide. This PPT slide contains the concept of process analysis. This analysis can be used for business and marketing related presentations.
-
 1214 tablet with pie and business bar graph for result analysis powerpoint slide
Exquisitely designed PowerPoint slide with great image quality. Editable images, icons, colors, text and layout as per the industry requisite. Alternative to add brand name and theme to customize. Presentation shape can be downloaded and save into JPG and PDF format. PPT design layout obtainable in standard and widescreen view. Fully flexible slide design with Google slides. Effortless to adjust and present when required. Innovatively designed to share the complex data in easy manner with graphs and charts. Easy to transmit any message effectively when shared even with large audience.
-
 1214 three heads with pie for data driven technology powerpoint slide
We are proud to present our 1214 three heads with pie for data driven technology powerpoint slide. This power point template slide has been crafted with graphic of three heads and pie chart. This chart is data driven and can be used for various kind of data analysis. Use this PPT for your business growth related presentations.
-
 1214 three staged pencil diagram for graph formation powerpoint slide
We are proud to present our 1214 three staged pencil diagram for graph formation powerpoint slide. Three staged pencil diagram has been used to craft this power point template slide. This PPT contains the concept of graph formation. This PPT slide is usable for education and business related presentations.
-
 1214 three step with 3d business man standing over it powerpoint slide
We are proud to present our 1214 three step with 3d business man standing over it powerpoint slide. Three step and 3d man are used to craft this power point template slide. This PPT slide contains the concept of data technology. This PPT slide can be used for data and business related presentation.
-
 1214 three test tubes with magnifier for data search powerpoint slide
We are proud to present our 1214 three test tubes with magnifier for data search powerpoint slide. Three test tubes and magnifier are used to craft this power point template slide. This PPT slide contains the concept of data search. This PPT slide can be used for data related presentation.
-
 1214 three text boxes for timer for time management powerpoint slide
We are proud to present our 1214 three text boxes for timer for time management powerpoint slide. This Power Point template slide has been designed with graphic of three text boxes. These text boxes are used for data representation. Use this PPT slide for your business and marketing data related presentations.
-
 1214 three trucks for data representation for business powerpoint slide
We are proud to present our 1214 three trucks for data representation for business powerpoint slide. This Power Point template slide has been designed with graphic of three trucks. These trucks are used as a data representation. Use this PPT slide for your business data related presentations.
-
 1214 thumb diagram with five stages for data representation powerpoint slide
We are proud to present our 1214 thumb diagram with five stages for data representation powerpoint slide. This power point template slide has been crafted with graphic of thumb diagram and five stages. This PPT slide contains the concept of data representation. Use this PPT slide and get good remarks from your viewers.
-
 1214 two tablets with growth bar grah data driven powerpoint slide
We are proud to present our 1214 two tablets with growth bar grah data driven powerpoint slide. This power point template slide has been crafted with graphic of two tablets and bar graph. This PPT slide contains the data driven analysis. Use this PPT slide and build presentation for your business growth and financial analysis.
-
 Alarm clock with data driven pie chart powerpoint slides
We are proud to present our alarm clock with data driven pie chart powerpoint slides. This power point template diagram has been designed with graphic of alarm clock and pie chart. This pie chart is data driven. Use this PPT diagram can be used for marketing and business related presentations.
-
 Bulb with process icons for data driven analysis powerpoint slides
Download in an instant in simple steps. Change orientation and sizes of PPT images to suit your need. High resolution PPT infographics that do not pixelate on wide screen projection. Modify color scheme and contrast as per need. No length constraints on fully modifiable text in titles and subtitles. Runs smoothly with Google slides and easily convertible to PDF or JPG.
-
 Business man with data driven growth chart powerpoint slides
Downloads instantaneously without unnecessary steps. High resolution PPT images with fully modifiable size and orientation. Fully editable text sans length constraints on titles and subtitles. Insert your company name, brand name, tagline or watermark. Convert easily into PDF or JPG formats and run with any software. Impressive addition to presentations by project managers, sales executives, marketers etc.
-
 Business peoples with data driven growth indication powerpoint slides
We are proud to present our business peoples with data driven growth indication powerpoint slides. This power point template diagram has been designed with graphic of business peoples. This pie chart is data driven. This PPT diagram can be used for data driven growth indication. Use this PPT diagram can be used for marketing and business related presentations.
-
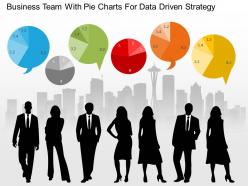 Business Team With Pie Charts For Data Driven Strategy Powerpoint Slides
Hassle free download in quick and easy steps. Change orientation and sizes of PPT images to suit your need. Insert company name, brand name, tagline, logo etc. and suitable text to personalize. Fully modifiable color scheme and contrast of PPT infographics. Easily convertible to JPG or PDF and runs smoothly with Google slides. No change in the high resolution post editing.
-
 Colored pencils for data driven education powerpoint slides
Simple and convenient instantaneous download. Absolutely editable text as per the context of your presentation. Change orientation and sizes of PPT images to your liking. Insert company name, logo, tagline, watermark etc. Totally modifiable color scheme and contrast. High resolution PPT infographics that do not pixelate on wide screen projection.
-
 Colored thermometer with analysis powerpoint slides
The incorporation of these images with your presentations creates a perfect looking presentation. Numerous icons are offered to include in the presentation. The appearance of these can be altered by changing the colours and the content. All the vital business aspects are very well covered in these slides. They have easy and error free downloading.
-
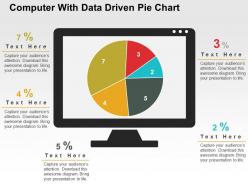 Computer with data driven pie chart powerpoint slides
Easy and swift to download. Fully modifiable color scheme, contrast, size and orientation of PPT infographics. Insert text without any length constraints. No change in the high resolution of PPT images after editing. Easily convertible to JPG or PDF formats and runs smoothly with any software. Perfectly suited for software designers, app developers, product engineers etc.
-
 Data driven bar graph made with pencils powerpoint slides
Easy proofing and editing is added on feature of presentation visual. Presentation slide is useful in business marketing, management and recourse disbursement. Basic theme yet it can modified with respect to font, color and layout. Attractive color scheme gives a professional look to PPT layout. Conversion into PDF or JPG formats is very easy and handy. PPT graphic offers font size which can be read from a distance. Shapes are in vector format and can be edited.
-
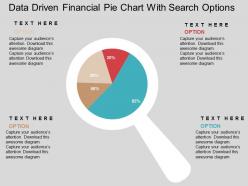 Data driven financial pie chart with search options powerpoint slides
We are proud to present our data driven financial pie chart with search options powerpoint slides. This power point template diagram has been designed with graphic of financial pie chart. This pie chart is data driven and can be used for financial data study with search options. Use this PPT diagram can be used for marketing and business related presentations.
-
 Data driven growth chart financial planning powerpoint slides
Basic theme yet it can modified with respect to font, color and layout. Attractive and professional color scheme. Presentation graphic offers font size which can be read from a distance. High resolution is offered by the presentation slide show. Easy to download and instant use of pre designed PPT layout adds to its advantage. High color resolution offered by PPT. Beneficial for businessmen, project managers for business and financial accounting purposes.
-
 Data driven human resource management powerpoint slides
All images are 100% editable in the presentation design. Good quality images can be used to compliment message. Works well in Windows 7, 8, 10, XP, Vista and Citrix. Editing in presentation slide show can be done from anywhere by any device. Students, teachers, businessmen or industrial managers can put to use the PPT layout as per their requirement. Compatibility with Google slides. PPT graphic offers font size which can be read from a distance. High resolution is offered by the presentation slide show.
-
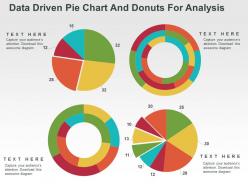 Data driven pie chart and donuts for analysis powerpoint slides
Presenting data driven pie chart and donuts for analysis PowerPoint template. High-resolution PowerPoint presentation backgrounds for better clarity of the information displayed. Offers wide variety of options and colors to alter the appearance. Allows adding of enterprise personal details such as brand name, logo and much more. Enough space available to enter text and its related points in the PPT table. This PPT Slide is available in both Standard and Widescreen slide size. Compatible with multiple formats like JPEG, PDF and Google slides.
-
 Donut chart with icons for data driven statistics powerpoint slides
Businessmen, micro, small and medium enterprises can use the PPT visual as a master slide. PowerPoint presentation supports filling background in a different color from the text. All images are 100% editable in the presentation slide. Text can be differentiated form the background by the handy features provided by PPT layout. There is no space constrain in the PowerPoint design, thus enabling easy addition or edition of data.
-
 Donut style pie chart for data driven analysis powerpoint slides
Organized slide pie diagram is totally variable. Downloading design in any configuration choices like JPEG, JPG or PDF is straightforward and lively. Provide a star point of view to your organization slides. Highly clear with Google slides. Symbols are in like way being joined. Editing of substance, portrayal, diagrams, and substance as showed up by your hurting and need. Visuals don't dark when exposed on widescreen.
-
 Educational chart data driven made with pencils powerpoint slides
Format slide pie outline is completely changeable. Downloading layout in any format decisions like JPEG, JPG or PDF is simple and brisk. Provide a pro perspective to your format slides. Highly apparent with Google slides. Symbols are in like way being joined. Customization of content, representation, outlines, and substance as appeared by your aching and need. Visuals don't obscure when opened on widescreen. Company logo, name and trademark can be effectively installed.
-
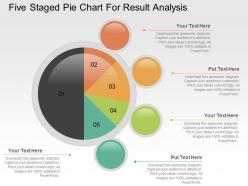 Five staged pie chart for result analysis powerpoint slides
Template slide pie chart is fully editable. Downloading template in any format choices like JPEG, JPG or PDF is easy and quick. Provide a specialist point of view to your template slides. Highly appreciable with Google slides. Symbols are in like manner being incorporated. Customization of text, graphics, designs, and content as showed by your longing and need. Visuals do not blur when opened on widescreen.
-
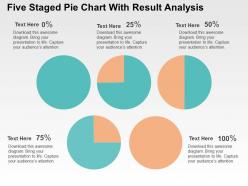 Five staged pie chart with result analysis powerpoint slides
Modifiable PPT Slide with pie diagrams with rate and symbols. Perfect with various arrangement alternatives like JPEG, JPG or PDF. Gives an expert standpoint to your PowerPoint introduction. Symbols are likewise being included. Customization of each PowerPoint realistic and content as indicated by your craving and need. Accessible in Widescreen slide estimate too. Opportunity to alter it with organization name and logo.
-
 Four forks style data driven bar graphs powerpoint slides
Work adequately with all thing alterations. Easy to embed association logo, trademark or name. Visuals quality don't pixelate when expected on wide screen. Well magnificent with Google slides. Basically snap to download. Free of space necessities to state titles and sub titles. Modify PPT manage, inventive style, substance, shading and plan as showed by your style. Can be effortlessly changed over into PDF or JPG gatherings. High declaration slides portrayals.
-
 Global market statistics pie chart with percentage powerpoint slides
We are proud to present our global market statistics pie chart with percentage powerpoint slides. Explain the global market statistics with this power point template diagram. This PPT diagram contains the graphic of pie chart and percentage. Use this PPT diagram for global marketing and business related presentations.
-
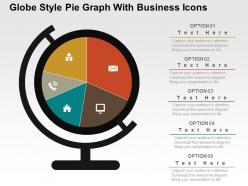 Globe style pie graph with business icons powerpoint slides
We are proud to present our globe style pie graph with business icons powerpoint slides. Graphic of globe style pie graph with business icons has been used to design this power point template diagram. This data driven bar graph can be used to show business data. Use this PPT diagram for business and marketing related presentations.
-
 Globe with bar graph data driven success indication powerpoint slides
We are proud to present our globe with bar graph data driven success indication powerpoint slides. Explain the global success indication with this power point template diagram. This PPT diagram contains the graphic of globe with bar graph. Use this PPT diagram for global marketing and business related presentations.
-
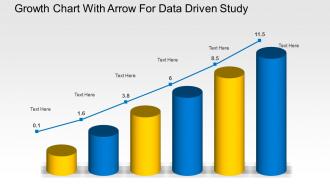 Growth chart with arrow for data driven study powerpoint slides
We are proud to present our growth chart with arrow for data driven study powerpoint slides. Graphic of growth chart with arrow has been used to design this power point template diagram. This PPT diagram contains the concept of data driven growth analysis. Use this PPT diagram for business and finance related presentations.
-
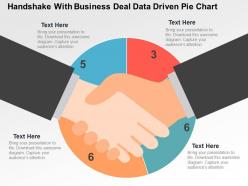 Handshake with business deal data driven pie chart powerpoint slides
We are proud to present our handshake with business deal data driven pie chart powerpoint slides. Graphic of handshake and pie chart has been used to design this power point template diagram. This PPT diagram contains the concept of data driven business deal and analysis. Use this PPT diagram for business and finance related presentations.
-
 Key design data driven pie chart powerpoint slides
Exquisitely crafted PowerPoint illustration. Easily alterable presentation slide into JPG and PDF. Perfect use of colors in the PPT visual. Access to incorporate company logo, icon and image as required. High determination with stunning picture quality. Alternative to demonstrate slide in widescreen view. Identical designs attainable with different nodes and stages. Appropriate for business administration team, decision making experts, corporate leaders and managers.
-
 Key design pie chart with idea generation process control powerpoint slides
Skillfully crafted Presentation layout. Completely modifiable PowerPoint visual as some elements are editable. Easiness of personalization with your company name and logo. PPT diagram can be downloaded easily and transform into JPG and PDF format. Choice to access similar designs with different stages. PowerPoint slide can be projected in standard and widescreen view. Awesome use of colors and innovatively designed.
-
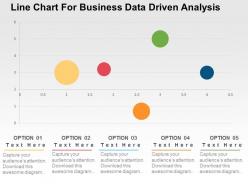 Line chart for business data driven analysis powerpoint slides
Visually stunning presentation infographics. Best quality of Presentation slide graphics. Picture quality don't pixelate when anticipated on wide screen. Effortlessly blend with other software’s such as JPG and PDF. Access to modify the content as color, text and layout can be edited. Adjust the substance at your simplicity. Presentation design compatible with Google slides. Alter the design with by inserting your company name and logo.
-
 Magnifier with data driven pie chart powerpoint slides
Remarkable Presentation design for business professionals. Incredible picture quality as pixels don’t break when shared in widescreen view. Blend well with online software tools i.e. JPG and PDF. Hundred percent compatible with Google slides. PowerPoint visual can be modified easily as access to change color, text accessible. Pre-designed PPT illustration saves you valuable time.
-
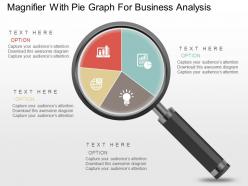 Magnifier with pie graph for business analysis powerpoint slides
Innovatively and expertly crafted PowerPoint slide. Impeccable quality of pictures and images used in the designing. Presentation can be exhibited in both standard and widescreen as pixels don’t break. Easily adjustable into other software programs such as JPG and PDF. Immediate download and easy to share with large set of people. Availability to edit the content as per the industry requirement. PPT slides completely compatible with Google slides.
-
 Pencil bar graph for data driven analysis powerpoint slides
Pre-designed PPT Template for marketing professionals, researchers, analysts, sales executives, etc. for data driven analysis. Colors, text and font can be easily changed as the PPT slide is completely editable. You can also add company logo, trademark or name. Easy and fast downloading process. Unaffected high resolution even after customization. This PPT Slide is available in both Standard and Widescreen slide size.
-
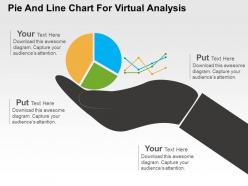 Pie and line chart for virtual analysis powerpoint slides
High resolution PPT example for pie and line chart for virtual analysis. Increase the level of personalization with your company logo and name. Compatible with all software and can be saved in any format. Useful tool for students, business analysts, sales people, sales managers and professionals of any industry. Precise and easy to comprehend information on PPT sample. Useful for marketing and business related presentations.
-
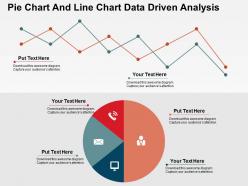 Pie chart and line chart data driven analysis powerpoint slides
PowerPoint Template for professionals for pie chart and line chart data driven analysis. Highly beneficial for professionals from diverse companies. Editable charts, colors and text. Adequate space available in each PowerPoint slide to insert text as desired. Manual option available to alter color or PowerPoint image. Simply click to add company logo, trademark or name.
-
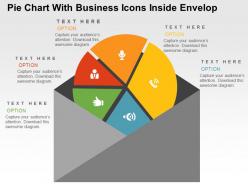 Pie chart with business icons inside envelop powerpoint slides
Pie chart with business icons inside envelop PPT Slide. Easy to use and edit. Colors, icons and layout can be easily changed as the PPT slide is completely editable. Simply click to add company logo, trademark or name. This PPT Slide is available in both Standard and Widescreen slide size. Quick and easy downloadable process. Flexible option for conversion in PDF or JPG formats. Can use with Google slides.
-
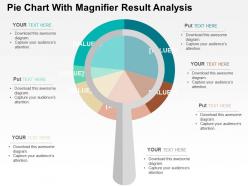 Pie chart with magnifier result analysis powerpoint slides
Readymade template pie chart with magnifier result analysis. Can be used for business people, sales executives and communication departments. Colors, charts and shapes can be easily changed as the PPT slide is completely editable. Simply click to add company logo, trademark or name. This PPT Slide is available in both Standard and Widescreen slide size. Easy and quick downloading process.
-
 Question mark with four text boxes and percentage powerpoint slides
Completely editable presentation design i.e. fonts, visuals, text and color. PPT slide goes well with Google slides. Excellence in picture quality. Presentation design can be displayed in standard and widescreen view. Personalize the presentation with individual company name and logo. PPT template is fully editable to allow customization. Simple to download and convert into PDF format.
-
Top Quality presentations that are easily editable.
-
Very well designed and informative templates.
-
Really like the color and design of the presentation.
-
Great product with effective design. Helped a lot in our corporate presentations. Easy to edit and stunning visuals.
-
Best Representation of topics, really appreciable.
-
Easily Understandable slides.
-
Innovative and attractive designs.
-
Informative presentations that are easily editable.
-
Great product with highly impressive and engaging designs.
-
Excellent design and quick turnaround.


