- Sub Categories
-
 Cash flow statement kpis ppt slides
Presenting this set of slides with name - Cash Flow Statement Kpis Ppt Slides. This is a four stage process. The stages in this process are Business, Operations, Financing Activities, Net Increase In Cash, Investing Activities.
-
 Column chart ppt infographic template
Presenting this set of slides with name - Column Chart Ppt Infographic Template. This is a two stage process. The stages in this process are Business, Years, Expenditure In, Marketing, Graph.
-
 Income statement overview good ppt example
Presenting this set of slides with name - Income Statement Overview Good Ppt Example. This is a five stage process. The stages in this process are Business, Marketing, Strategy, Graph, Finance.
-
 Line chart presentation graphics
Presenting this set of slides with name - Line Chart Presentation Graphics. This is a two stage process. The stages in this process are Business, Marketing, Finance, Profit, Percentage.
-
 Liquidity ratios ppt example file
Presenting this set of slides with name - Liquidity Ratios Ppt Example File. This is a two stage process. The stages in this process are Business, Marketing, Finance, Current Ratio, Quick Ratio.
-
 Liquidity ratios ppt slide
Presenting this set of slides with name - Liquidity Ratios Ppt Slide. This is a two stage process. The stages in this process are Business, Marketing, Finance, Graph.
-
 P and l kpis 2 powerpoint slides
Presenting this set of slides with name - P And L Kpis 2 Powerpoint Slides. This is a four stage process. The stages in this process are Business, Revenue, Cogs, Net Profit, Operating Profit.
-
 P and l kpis example ppt presentation
Presenting this set of slides with name - P And L Kpis Example Ppt Presentation. This is a four stage process. The stages in this process are Business, Revenue, Cogs, Net Profit, Operating Profit.
-
 Profitability ratios powerpoint show
Presenting this set of slides with name - Profitability Ratios Powerpoint Show. This is a two stage process. The stages in this process are Business, Roce Ratio, Roa Ratio, Marketing, Graph.
-
 Profitability ratios powerpoint slide designs
Presenting this set of slides with name - Profitability Ratios Powerpoint Slide Designs. This is a two stage process. The stages in this process are Business, Marketing, Graph, Net Profit Ratio, Gross Profit Ratio.
-
 Profitability ratios powerpoint slide graphics
Presenting this set of slides with name - Profitability Ratios Powerpoint Slide Graphics. This is a two stage process. The stages in this process are Business, Marketing, Graph, Strategy, Finance.
-
 Profitability ratios powerpoint slide presentation sample
Presenting this set of slides with name - Profitability Ratios Powerpoint Slide Presentation Sample. This is a two stage process. The stages in this process are Business, Marketing, Pe Ratio, Eps Ratio, Year.
-
 Profitability ratios ppt images
Presenting this set of slides with name - Profitability Ratios Ppt Images. This is a two stage process. The stages in this process are Business, Marketing, Graph, Strategy, Finance.
-
 Profitability ratios ppt infographic template
Presenting this set of slides with name - Profitability Ratios Ppt Infographic Template. This is a two stage process. The stages in this process are Business, Marketing, Graph, Strategy, Finance.
-
 Solvency ratios powerpoint templates download
Presenting this set of slides with name - Solvency Ratios Powerpoint Templates Download. This is a two stage process. The stages in this process are .
-
 Solvency ratios ppt background
Presenting this set of slides with name - Solvency Ratios Ppt Background. This is a two stage process. The stages in this process are Business, Marketing, Graph, Strategy, Finance.
-
 Stock chart powerpoint slide designs
Presenting this set of slides with name - Stock Chart Powerpoint Slide Designs. This is a two stage process. The stages in this process are Business, Marketing, Low, Volume, High.
-
 Vendor kpi dashboard showing defect rate on-time suppliers and lead time
Presenting this set of slides with name - Vendor Kpi Dashboard Showing Defect Rate On-Time Suppliers And Lead Time. This is a stage process. The stages in this process are Vendor, Supplier, Retailer.
-
 Vendor kpi dashboard showing gross sales earnings sold and sales report
Presenting this set of slides with name - Vendor Kpi Dashboard Showing Gross Sales Earnings Sold And Sales Report. This is a four stage process. The stages in this process are Vendor, Supplier, Retailer.
-
 Vendor kpi dashboard showing missing percentage unmatched serials and control percentage
Presenting this set of slides with name - Vendor Kpi Dashboard Showing Missing Percentage Unmatched Serials And Control Percentage. This is a five stage process. The stages in this process are Vendor, Supplier, Retailer.
-
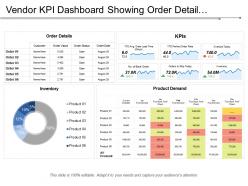 Vendor kpi dashboard showing order detail inventory and orders to ship today
Presenting this set of slides with name - Vendor Kpi Dashboard Showing Order Detail Inventory And Orders To Ship Today. This is a four stage process. The stages in this process are Vendor, Supplier, Retailer.
-
 Vendor kpi dashboard showing role holder alerts and specialization chart
Presenting Vendor KPI Dashboard Showing Role Holder Alerts And Specialization Chart Pictures PPT slide. This presentation design has been professionally designed, is fully editable in PowerPoint and is compatible with Google slides as well. The font type, font size, colors of the diagrams, background color are customizable and the company logo can be added too. High quality graphs, charts, tables and icons ensure that there is no deteriorating in quality on enlarging their size. Fast download at click of a button.
-
 Vendor kpi dashboard showing sales by day sales person analysis top 10 customers by order value
Presenting this set of slides with name - Vendor Kpi Dashboard Showing Sales By Day Sales Person Analysis Top 10 Customers By Order Value. This is a six stage process. The stages in this process are Vendor, Supplier, Retailer.
-
 Vendor kpi dashboard showing store analytics sales by product and product stats
Presenting this set of slides with name - Vendor Kpi Dashboard Showing Store Analytics Sales By Product And Product Stats. This is a four stage process. The stages in this process are Vendor, Supplier, Retailer.
-
 Vendor kpi dashboard showing supplier compliance stats and procurement cycle time
Presenting this set of slides with name - Vendor Kpi Dashboard Showing Supplier Compliance Stats And Procurement Cycle Time. This is a four stage process. The stages in this process are Vendor, Supplier, Retailer.
-
 Vendor kpi dashboard showing units per transaction percentage out of stock items
Presenting this set of slides with name - Vendor Kpi Dashboard Showing Units Per Transaction Percentage Out Of Stock Items. This is a four stage process. The stages in this process are Vendor, Supplier, Retailer.
-
 Area chart ppt example file
Presenting this set of slides with name - Area Chart Ppt Example File. This is a two stage process. The stages in this process are In Percentage, Business, Marketing, Finance, Graph.
-
 Bar graph powerpoint templates
Presenting this set of slides with name - Bar Graph Powerpoint Templates. This is a two stage process. The stages in this process are Business, Marketing, Finance, Financial Years, Sales In Percentage.
-
 Combo chart powerpoint ideas
Presenting this set of slides with name - Combo Chart Powerpoint Ideas. This is a three stage process. The stages in this process are Business, Marketing, Finance, Market Size, Growth Rate.
-
 Donut pie chart powerpoint slide information
Presenting this set of slides with name - Donut Pie Chart Powerpoint Slide Information. This is a three stage process. The stages in this process are Business, Marketing, Chart, Percentage, Strategy.
-
 Radar chart ppt examples professional
Presenting this set of slides with name - Radar Chart Ppt Examples Professional. This is a one stage process. The stages in this process are Business, Marketing, Radar Chart, Finance, Percentage.
-
 Activity ratios ppt examples slides
Presenting this set of slides with name - Activity Ratios Ppt Examples Slides. This is a two stage process. The stages in this process are Bar, Business, Marketing, Strategy, Planning.
-
 Balance sheet kpis powerpoint slide background image
Presenting this set of slides with name - Balance Sheet Kpis Powerpoint Slide Background Image. This is a four stage process. The stages in this process are Current Assets, Current Liabilities, Total Assets, Total Liabilities.
-
 Cash flow statement kpis powerpoint slide deck samples
Presenting this set of slides with name - Cash Flow Statement Kpis Powerpoint Slide Deck Samples. This is a four stage process. The stages in this process are Operations, Financing Activities, Investing Activities, Net Increase In Cash.
-
 Clustered column ppt diagrams
Presenting this set of slides with name - Clustered Column Ppt Diagrams. This is a two stage process. The stages in this process are Bar, Business, Marketing, Strategy, Planning.
-
 Customer satisfaction ppt background template
Presenting this set of slides with name - Customer Satisfaction Ppt Background Template. This is a three stage process. The stages in this process are Overall Satisfaction With Service, Satisfaction With Value For Money, Overall Satisfaction With Relationship.
-
 Donut pie chart ppt diagrams
Presenting this set of slides with name - Donut Pie Chart Ppt Diagrams. This is a four stage process. The stages in this process are Donut, Finance, Marketing, Planning, Analysis.
-
 Liquidity ratios powerpoint templates download
Presenting this set of slides with name - Liquidity Ratios Powerpoint Templates Download. This is a two stage process. The stages in this process are Bar, Business, Marketing, Strategy, Planning.
-
 Pandl kpis presentation design
Presenting this set of slides with name - Pandl Kpis Presentation Design. This is a four stage process. The stages in this process are Bar, Business, Marketing, Strategy, Planning.
-
 Profitability ratios powerpoint themes
Presenting this set of slides with name - Profitability Ratios Powerpoint Themes. This is a two stage process. The stages in this process are Bar, Business, Marketing, Strategy, Planning.
-
 Scatter chart presentation deck
Presenting this set of slides with name - Scatter Chart Presentation Deck. This is a two stage process. The stages in this process are Bubble, Business, Marketing, Strategy, Planning, Business, Marketing, Strategy, Planning.
-
 Solvency ratios powerpoint guide
Presenting this set of slides with name - Solvency Ratios Powerpoint Guide. This is a two stage process. The stages in this process are Bar, Business, Marketing, Strategy, Planning.
-
 Stacked bar ppt sample download
Presenting this set of slides with name - Stacked Bar Ppt Sample Download. This is a four stage process. The stages in this process are Slide Bars, Business, Marketing, Strategy, Planning.
-
 Stacked bar presentation portfolio
Presenting this set of slides with name - Stacked Bar Presentation Portfolio. This is a four stage process. The stages in this process are Slide Bars, Business, Marketing, Strategy, Planning.
-
 Stacked line with marker presentation layouts
Presenting this set of slides with name - Stacked Line With Marker Presentation Layouts. This is a two stage process. The stages in this process are Line Chart, Business, Marketing, Strategy, Planning.
-
 Audit kpi dashboard of operating systems manufacturer report and model report
Presenting this set of slides with name - Audit Kpi Dashboard Of Operating Systems Manufacturer Report And Model Report. This is a five stage process. The stages in this process are Audit, Examine, Survey.
-
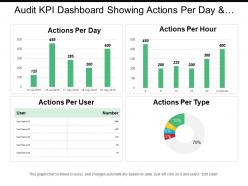 Audit kpi dashboard showing actions per day and actions per hour
Presenting this set of slides with name - Audit Kpi Dashboard Showing Actions Per Day And Actions Per Hour. This is a five stage process. The stages in this process are Audit, Examine, Survey.
-
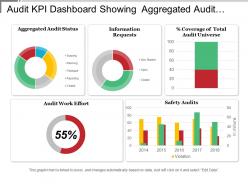 Audit kpi dashboard showing aggregated audit status and audit work effort
Presenting this set of slides with name - Audit Kpi Dashboard Showing Aggregated Audit Status And Audit Work Effort. This is a five stage process. The stages in this process are Audit, Examine, Survey.
-
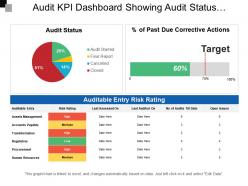 Audit kpi dashboard showing audit status auditable entry risk rating
Presenting this set of slides with name - Audit Kpi Dashboard Showing Audit Status Auditable Entry Risk Rating. This is a four stage process. The stages in this process are Audit, Examine, Survey.
-
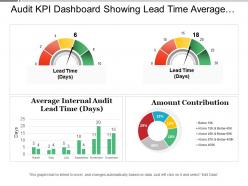 Audit kpi dashboard showing lead time average entry variance and amount contribution
Presenting this set of slides with name - Audit Kpi Dashboard Showing Lead Time Average Entry Variance And Amount Contribution. This is a four stage process. The stages in this process are Audit, Examine, Survey.
-
 Audit kpi dashboard showing overall assurance internal audit and results
Presenting audit kpi dashboard showing overall assurance internal audit and results presentation slide. The PPT layout is extremely easy to understand as it enables you to roll out various improvements to the editable slides. You can change the text dimension, textual style and furthermore the textual style shading according to your prerequisites. Layout slide can be downloaded rapidly and taxi be spared in configuration of PDF or JPG effectively. The format slide in the wake of being downloaded can be seen in extensive screen show proportion of 16:9 or standard size presentation proportion of 4:3.
-
 Audit kpi dashboard showing recurring audit finding instances and audit finding summary
Presenting this set of slides with name - Audit Kpi Dashboard Showing Recurring Audit Finding Instances And Audit Finding Summary. This is a four stage process. The stages in this process are Audit, Examine, Survey.
-
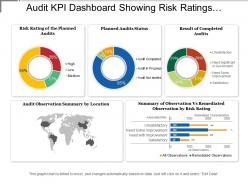 Audit kpi dashboard showing risk ratings planned audit status
Presenting this set of slides with name - Audit Kpi Dashboard Showing Risk Ratings Planned Audit Status. This is a five stage process. The stages in this process are Audit, Examine, Survey.
-
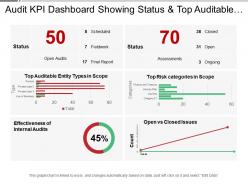 Audit kpi dashboard showing status and top auditable entity types
Presenting this set of slides with name - Audit Kpi Dashboard Showing Status And Top Auditable Entity Types. This is a six stage process. The stages in this process are Audit, Examine, Survey.
-
 Social media audit kpi dashboard showing followers activity summary and activity leads
This PPT template is very useful for your business PowerPoint presentation. It is fully editable and has editable features like editable font, font size, font color, etc. There are many shapes to choose from like squares, triangles, circles, rectangles, pentagon and many more shapes in order to edit this presentation in PowerPoint. All the images in this PPT are 100% editable. The excel-linked charts in this PPT template can also be edited with ease. It can be viewed and saved in JPG or PDF format. It is fully compatible with Google slides as well.
-
 Call center kpi dashboard showing abandon percentage total queue entries
PowerPoint shape easy to amend as color, text, font etc are amendable. Notable quality presentation template. Well-adjusted online software programs such as JPG and PDF. Extra-ordinary picture quality as pixels don’t break when viewed in widescreen view. PPT design goes well with Google slides. Matching designs available with different nodes and stages. Handy presentation design saves you valuable time. Show the PowerPoint diagram with your corporate sign and title. Easy to download and can be saved for future reference.
-
 Call center kpi dashboard showing abandoned calls group calls group statistics
Presenting this set of slides with name - Call Center Kpi Dashboard Showing Abandoned Calls Group Calls Group Statistics. This is a four stage process. The stages in this process are Call Center Agent, Customer Care, Client Support.
-
 Call center kpi dashboard showing agent talking longest call waiting call handling
Presenting this set of slides with name - Call Center Kpi Dashboard Showing Agent Talking Longest Call Waiting Call Handling. This is a five stage process. The stages in this process are Call Center Agent, Customer Care, Client Support.
-
 Call center kpi dashboard showing budget call volume agent costs percentage sales target
Presenting this set of slides with name - Call Center Kpi Dashboard Showing Budget Call Volume Agent Costs Percentage Sales Target. This is a four stage process. The stages in this process are Call Center Agent, Customer Care, Client Support.
-
 Call center kpi dashboard showing call resolution currently active and waiting
Presenting this set of slides with name - Call Center Kpi Dashboard Showing Call Resolution Currently Active And Waiting. This is a one stage process. The stages in this process are Call Center Agent, Customer Care, Client Support.
-
Helpful product design for delivering presentation.
-
Editable templates with innovative design and color combination.
-
Great quality slides in rapid time.
-
Unique research projects to present in meeting.
-
Editable templates with innovative design and color combination.
-
Easily Understandable slides.
-
Excellent design and quick turnaround.
-
Helpful product design for delivering presentation.
-
Very well designed and informative templates.
-
It saves your time and decrease your efforts in half.


