- Sub Categories
-
 Customer base analysis with pie chart
Presenting customer base analysis with pie chart. This is a customer base analysis with pie chart. This is a five stage process. The stages in this process are customer base, recurring customers, customer services.
-
 Area chart ppt design
Presenting area chart ppt design. This is a area chart ppt design. This is a two stage process. The stages in this process are product, in years, in percentage, percentage, finance.
-
 Bar chart ppt example file
Presenting bar chart ppt example file. This is a bar chart ppt example file. This is a four stage process. The stages in this process are product, in years, percentage, business, years.
-
 Column chart ppt images gallery
Presenting column chart ppt images gallery. This is a column chart ppt images gallery. This is a nine stage process. The stages in this process are product, expenditure, years, bar graph, growth.
-
 Combo chart ppt infographic template
Presenting combo chart ppt infographic template. This is a combo chart ppt infographic template. This is a eight stage process. The stages in this process are product, in years, bar graph, growth, in price.
-
 Comparison ppt infographics
Presenting comparison ppt infographics. This is a comparison ppt infographics. This is a two stage process. The stages in this process are comparison, business, marketing, management, percentage.
-
 Dashboard snapshot ppt slide design
Presenting dashboard snapshot ppt slide design. This is a dashboard ppt slide design. This is a three stage process. The stages in this process are low, medium, high, dashboard, measurement.
-
 Donut chart presentation ideas
Presenting donut chart presentation ideas. This is a donut chart presentation ideas. This is a six stage process. The stages in this process are percentage, finance, donut, business.
-
 Line chart presentation visuals
Presenting this set of slides with name - Line Chart Presentation Visuals. This is a two stage process. The stages in this process are Line Chart, Finance, Marketing, Strategy, Growth, Business.
-
 Pareto chart powerpoint slide images
Presenting pareto chart powerpoint slide images. This is a pareto chart powerpoint slide images. This is a seven stage process. The stages in this process are number of defects, observation, graph, finance, business.
-
 Quality control chart powerpoint topics
Presenting quality control chart powerpoint topics. This is a quality control chart powerpoint topics. This is a two stage process. The stages in this process are anatomy of control chart, upper control limit, defect rate, unstable trend, process change, lower control limit.
-
 Radar chart powerpoint slide deck samples
Presenting radar chart powerpoint slide deck samples. This is a radar chart powerpoint slide deck samples. This is a two stage process. The stages in this process are product, radar chart, shapes, years, business.
-
 Root cause analysis good ppt example
Presenting Root Cause Analysis Good PPT Example which is designed professionally for your convenience. Change the color, fonts, font size, and font types of the template as per the requirements. The model is readily available in both 4:3 and 16:9 aspect ratio. It is compatible with Google Slides which makes it accessible at once. Can be converted into formats like PDF, JPG, and PNG.
-
 Scatter chart powerpoint slide design ideas
Presenting scatter chart powerpoint slide design ideas. This is a scatter chart powerpoint slide design ideas. This is a nine stage process. The stages in this process are in dollars, in percentage, symbol, product, growth.
-
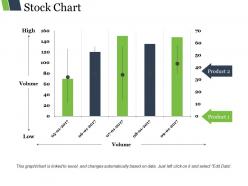 Stock chart ppt background template
Presenting stock chart ppt background template. This is a stock chart ppt background template. This is a five stage process. The stages in this process are high, volume, low, product, finance.
-
 Bar chart powerpoint slides
Presenting Bar Chart PowerPoint Slides. The slide can be modified as per your wants. Make alterations in the colors, background, and font type of the layout. Increase or decrease the size of the icon and transform it into formats like JPG, JPEG, and PDF. Goes well with Google Slides. It can be projected on a full screen in front of thousands of people. Also, the template is completely compatible with the major Microsoft versions and can be presented in front of a large segment because of its high-resolution graphics.
-
 Clustered bar presentation ideas
Presenting clustered bar presentation ideas. This is a clustered bar presentation ideas . This is a five stage process. The stages in this process are financial, clustered bar, marketing, strategy, business.
-
 Clustered column line presentation portfolio
Presenting clustered column line presentation portfolio. This is a clustered column line presentation portfolio . This is a four stage process. The stages in this process are financial, clustered column line, analysis, strategy, business.
-
 Clustered column presentation layouts
Presenting clustered column presentation layouts. This is a clustered column presentation layouts . This is a two stage process. The stages in this process are financial, clustered column, analysis, strategy, business.
-
 Dashboard snapshot presentation outline
Presenting dashboard presentation outline. This is a dashboard snapshot presentation outline . This is a one stage process. The stages in this process are high speed, low, medium, dashboard, strategy.
-
 Donut pie chart presentation powerpoint
Presenting Donut Pie Chart Presentation Powerpoint. Easy to download PPT layout and can be saved in different formats like JPG, PDF, and PNG. This PowerPoint slide is completely editable so you can modify, font type, font color, shape and image according to your requirements. This Google Slides compatible PPT is available in 4:3 and 16:9 aspect ratios.
-
 Filled area ppt inspiration
Presenting filled area ppt inspiration. This is a filled area ppt inspiration . This is a two stage process. The stages in this process are filled area, product, analysis, management, business.
-
 Financial ppt presentation examples
Presenting financial ppt presentation examples. This is a financial ppt presentation examples . This is a two stage process. The stages in this process are minimum, maximum.
-
 High low close chart sample ppt presentation
Presenting high low close chart sample ppt presentation. This is a high low close chart sample ppt presentation. This is a five stage process. The stages in this process are close, high, volume, low, open.
-
 Line chart ppt infographic template
Presenting line chart ppt infographic template. This is a line chart ppt infographic template . This is a two stage process. The stages in this process are line chart, finance, marketing, analysis, business.
-
 Magnifying glass ppt ideas
Presenting Magnifying Glass PPT Ideas. The slide can be customised as per the needs and wants. It completely works on your command. Change the font type, font size and the font color of the template and match it to your presentation theme. Convert it in various formats including JPG, PNG, JPEG and PDF. can be projected on a fullscreen and widescreen.
-
 Pie chart powerpoint slide inspiration
Presenting pie chart powerpoint slide inspiration. This is a pie chart powerpoint slide inspiration . This is a five stage process. The stages in this process are pie chart, finance, marketing, strategy, analysis, business.
-
 Scatter bubble chart presentation ideas
Presenting scatter bubble chart presentation ideas. This is a scatter bubble chart presentation ideas . This is a three stage process. The stages in this process are scatter bubble chart, finance, analysis, business, strategy.
-
 Silhouettes presentation pictures
Presenting silhouettes presentation pictures. This is a silhouettes presentation pictures . This is a two stage process. The stages in this process are silhouettes, pie chart, analysis, marketing, strategy, business.
-
 Stack area chart ppt background designs
Presenting stack area chart ppt background designs. This is a stack area chart ppt background designs . This is a two stage process. The stages in this process are stack area chart, analysis, marketing, strategy, business.
-
 Stacked bar ppt example file
Presenting stacked bar ppt example file. This is a stacked bar ppt example file . This is a four stage process. The stages in this process are stacked bar, analysis, marketing, strategy, business.
-
 Stacked line with markers powerpoint slides
Presenting stacked line with markers powerpoint slides. This is a stacked line with markers powerpoint slides. This is a one stage process. The stages in this process are in percentage, product, process, marketing, business.
-
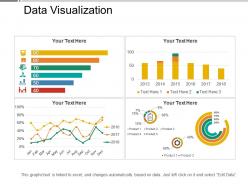 Data visualization
Presenting this Data Visualization PowerPoint slide. This PPT presentation is Google Slides compatible hence it is easily accessible. You can download and save this PowerPoint layout in different formats like PDF, PNG, and JPG. This PPT theme is available in both 4:3 and 16:9 aspect ratios. As this PowerPoint template is 100% editable, you can modify color, font size, font type, and shapes as per your requirements.
-
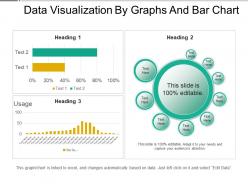 Data visualization by graphs and bar chart
Presenting Data Visualization By Graphs And Bar Chart PowerPoint slide. This PPT theme is available in both 4:3 and 16:9 aspect ratios. As this PowerPoint template is 100% editable, you can modify the color, font size, font type, and shapes as per your requirements. This PPT presentation is Google Slides compatible hence it is easily accessible. You can download and save this PowerPoint layout in different formats like PDF, PNG and JPG.
-
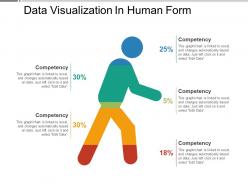 Data visualization in human form
Presenting Data Visualization In Human Form PPT template. This slide is available in standard screen and widescreen. You can easily save your presentation into formats like PDF, JPG and PNG. This slide completely works on your command. Alter the colors, background, font type, and font size and make it as per your needs. This slide is readily available in both 4:3 and 16:9 aspect ratio. It is adaptable with Google Slides, which makes it accessible at once.
-
 Big picture main idea magnifying glass bar graph pie chart details
Presenting big picture main idea magnifying glass bar graph pie chart details. This is a big picture main idea magnifying glass bar graph pie chart details. This is a four stage process. The stages in this process are big picture, main idea, central idea.
-
 Clustered bar example of ppt
Presenting clustered bar example of ppt. This is a clustered bar example of ppt. This is a four stage process. The stages in this process are business, clustered bar, finance, analysis, strategy.
-
 Clustered column sample of ppt
Presenting clustered column sample of ppt. This is a clustered column sample of ppt. This is a two stage process. The stages in this process are clustered column, finance, marketing, strategy, business.
-
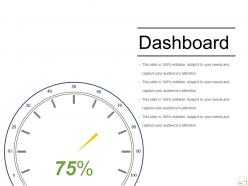 Dashboard snapshot sample of ppt presentation
Presenting dashboard sample of ppt presentation. This is a dashboard snapshot sample of ppt presentation. This is a one stage process. The stages in this process are dashboard, percentage, business, management, process.
-
 Donut pie chart example ppt presentation
Presenting donut pie chart example ppt presentation. This is a donut pie chart example ppt presentation. This is a four stage process. The stages in this process are donut pie chart, finance, marketing, strategy, analysis, business.
-
 Filled rader sample ppt presentation
Presenting filled rader sample ppt presentation. This is a filled rader sample ppt presentation. This is a two stage process. The stages in this process are filled rader, product.
-
 Line chart good ppt example
Presenting line chart good ppt example. This is a line chart good ppt example. This is a two stage process. The stages in this process are line chart, finance, growth, analysis, business.
-
 Pareto chart powerpoint templates
Presenting pareto chart powerpoint templates. This is a pareto chart powerpoint templates. This is a seven stage process. The stages in this process are pareto chart, business, growth, finance, analysis.
-
 Quality control chart powerpoint graphics
Presenting quality control chart powerpoint graphics. This is a quality control chart powerpoint graphics. This is a one stage process. The stages in this process are center line, lower control limit, unstable trend, process change.
-
 Root cause analysis ppt summary
Presenting Root Cause Analysis PPT Summary which is designed professionally for your convenience. You can change the color, fonts, font size, and font types of the template as per the requirements. The slide is readily available in both 4:3 and 16:9 aspect ratio. It is adaptable with Google Slides which makes it accessible at once. Can be converted into formats like PDF, JPG, and PNG.
-
 Scatter chart ppt slide templates
Presenting scatter chart ppt slide templates. This is a scatter chart ppt slide templates. This is a two stage process. The stages in this process are scatter chart, finance, marketing, strategy, analysis, business.
-
 Stacked column powerpoint guide
Presenting stacked column powerpoint guide. This is a stacked column powerpoint guide. This is a two stage process. The stages in this process are stacked column, finance, marketing, strategy, analysis, business.
-
 Stacked line with marker powerpoint ideas
Presenting stacked line with marker powerpoint ideas. This is a stacked line with marker powerpoint ideas. This is a one stage process. The stages in this process are stacked line, marketing, strategy, analysis, growth.
-
 Stock chart powerpoint images
Presenting stock chart powerpoint images. This is a stock chart powerpoint images. This is a five stage process. The stages in this process are stock chart, high, low, volume.
-
 Area chart sample ppt presentation
Presenting Area Chart Sample PPT Presentation. You can modify the slide as per your needs. The slide is having compatibility with Google Slides. The template can be saved into multiple image formats such as JPEG, PNG or document formats such as PDF without any problem. This presentation supports both widescreen(16:9) and standard screen(4:3) aspect ratios.
-
 Bar graph good ppt example
Presenting bar graph good ppt example. This is a bar graph good ppt example. This is a three stage process. The stages in this process are bar graph, finance, analysis, strategy, business.
-
 Clustered column line powerpoint images
Presenting clustered column line powerpoint images. This is a clustered column line powerpoint images. This is a three stage process. The stages in this process are clustered column line, finance, analysis, strategy, business.
-
 Column chart powerpoint layout
Presenting Column Chart PowerPoint Layout. This slide can be downloaded into formats like PDF, JPG, and PNG without any problem. It is adaptable with Google Slides which makes it accessible at once. You can modify the color, font, font size, and font types of the slides as per your requirement. This slide is available in both the standard and widescreen aspect ratio. High-quality graphics ensures that there is no room for deterioration.
-
 Combo chart powerpoint presentation
Presenting a Combo Chart PowerPoint Layout. This slide can be downloaded into formats like PDF, JPG, and PNG without any problem. It is adaptable with Google Slides which makes it accessible at once. You can modify the color, font, font size, and font types of the slides as per your requirement. This slide is available in both standard and widescreen aspect ratios. High-quality graphics ensure that there is no room for deterioration.
-
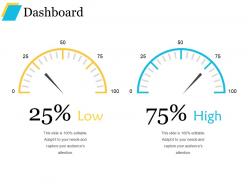 Dashboard powerpoint presentation templates
Presenting dashboard powerpoint presentation templates. This is a dashboard powerpoint presentation templates. This is a two stage process. The stages in this process are low, high, dashboard, technology, business.
-
 Donut pie chart powerpoint shapes
Presenting Donut Pie Chart PowerPoint Shapes. Get this completely customizable slide and make changes in it to match it to your presentation theme. Modify the colors, background, text, and the icon. The number of points can be increased or decreased as per your choice. Adjust the shape and size of the image. Transform and save it in various formats, including JPG and PDF file formats. It is compatible with the Google Slides, and the major Microsoft versions. Can be viewed clearly on full screen because of its splendid picture quality.
-
 High low close chart powerpoint slide background image
Presenting high low close chart powerpoint slide background image. This is a high low close chart powerpoint slide background image. This is a one stage process. The stages in this process are high, volume, low.
-
 Line chart powerpoint slide clipart
Presenting line chart powerpoint slide clipart. This is a line chart powerpoint slide clipart. This is a two stage process. The stages in this process are line chart, growth, analysis, business, marketing.
-
 Pie chart powerpoint slide ideas
Presenting pie chart powerpoint slide ideas. This is a pie chart powerpoint slide ideas. This is a four stage process. The stages in this process are pie chart, finance, marketing, strategy, finance, business.
-
 Radar chart powerpoint slide introduction
Presenting radar chart powerpoint slide introduction. This is a radar chart powerpoint slide introduction. This is a three stage process. The stages in this process are radar chart, finance, analysis, marketing, business.
-
The Designed Graphic are very professional and classic.
-
Easily Editable.
-
Out of the box and creative design.
-
It saves your time and decrease your efforts in half.
-
Very unique and reliable designs.
-
Colors used are bright and distinctive.
-
Informative presentations that are easily editable.
-
Content of slide is easy to understand and edit.
-
Innovative and attractive designs.
-
Graphics are very appealing to eyes.


