- Sub Categories
-
 Technology growth rate statistics powerpoint images
Presenting technology growth rate statistics powerpoint images. This is a technology growth rate statistics powerpoint images. This is a three stage process. The stages in this process are business, marketing, percentage, finance, success.
-
 Industry analysis framework pie chart powerpoint slide show
Presenting industry analysis framework pie chart powerpoint slide show. This is a industry analysis framework pie chart powerpoint slide show. This is a six stage process. The stages in this process are industry analysis framework pie chart,market analysis market share brand.
-
 Project cost feasibility study ppt example
Presenting project cost feasibility study ppt example. This is a project cost feasibility study ppt example. This is a two stage process. The stages in this process are project cost feasibility study,our cost.
-
 Site performance dashboard analytics ppt images gallery
Presenting site performance dashboard analytics ppt images gallery. This is a site performance dashboard analytics ppt images gallery. This is a four stage process. The stages in this process are site performance,dashboard,analytics,financial,product.
-
 Web performance dashboard snapshot ppt samples
This is a web performance dashboard snapshot ppt samples. This is a one stage process. The stages in this process are web performance,dashboard,presentation,analysis.
-
 Company sales review powerpoint slide show
Presenting company sales review powerpoint slide show. This is a company sales review powerpoint slide show. This is a five stage process. The stages in this process are business,strategy,chart and graph,time planning.
-
 Marketing data dashboard snapshot ppt background graphics
Presenting marketing data dashboard snapshot ppt background graphics. This is a marketing data dashboard ppt background graphics. This is a three stage process. The stages in this process are business, marketing, management, dashboard, finance.
-
 Measuring cost of quality ppt background template
Presenting measuring cost of quality ppt background template. This is a measuring cost of quality ppt background template. This is a four stage process. The stages in this process are external failure, internal failure, prevention, appraisal.
-
 5 years line graph trend comparison powerpoint presentation
Presenting 5 years line graph trend comparison powerpoint presentation. This is a 5 years line graph trend comparison powerpoint presentation. This is a three stage process. The stages in this process are year, planning, business, marketing, success.
-
 Performance evaluation dashboard excel charts powerpoint topics
Presenting performance evaluation dashboard excel charts powerpoint topics. This is a performance evaluation dashboard excel charts powerpoint topics. This is a four stage process. The stages in this process are graph, finance, dashboard, pie, business.
-
 Quarterly strategic performance review dashboard ppt icon
Presenting quarterly strategic performance review dashboard ppt icon. This is a quarterly strategic performance review dashboard ppt icon. This is a three stage process. The stages in this process are finance, business, marketing, dashboard, process.
-
 Target performance measurement of business goals ppt images
Presenting target performance measurement of business goals ppt images. This is a target performance measurement of business goals ppt images. This is a two stage process. The stages in this process are target, business, goals, finance, graph.
-
 Timeline of business performance snapshot ppt infographics
Presenting timeline of business performance snapshot ppt infographics. This is a timeline of business performance snapshot ppt infographics. This is a six stage process. The stages in this process are arrows, step, business, marketing, growth.
-
 Trend and performance review of kpis ppt infographics
Presenting trend and performance review of kpis ppt infographics. This is a trend and performance review of kpis ppt infographics. This is a nine stage process. The stages in this process are graph, finance, business, marketing, year.
-
 Business model assessment powerpoint graphics
Presenting business model assessment powerpoint graphics. This is a business model assessment powerpoint graphics. This is a three stage process. The stages in this process are business model, assessment, financial, presentation.
-
 Product sales comparison chart ppt presentation
Presenting product sales comparison chart ppt presentation. This is a product sales comparison chart ppt presentation. This is a four stage process. The stages in this process are product, sales, comparison chart, timeline, strategy.
-
 Sales activity dashboard snapshot ppt samples
Presenting sales activity dashboard snapshot ppt samples. This is a sales activity dashboard ppt samples. This is a four stage process. The stages in this process are sales, activity, dashboard, financial, strategy.
-
 Spending plan pie chart ppt slide examples
Presenting spending plan pie chart ppt slide examples. This is a spending plan pie chart ppt slide examples. This is a twelve stage process. The stages in this process are spending plan, pie chart, presentation, process, icons.
-
 Absenteeism rate in a company powerpoint graphics
Presenting absenteeism rate in a company powerpoint graphics. This is a absenteeism rate in a company powerpoint graphics. This is a two stage process. The stages in this process are absenteeism rate by days, days lost per employee per annum.
-
 Bar graph for rate of employee turnover example of ppt presentation
Presenting bar graph for rate of employee turnover example of ppt presentation. This is a bar graph for rate of employee turnover example of ppt presentation. This is a five stage process. The stages in this process are rate of turnover, voluntary, total.
-
 Competency rating of employees horizontal bar chart sample ppt presentation
Presenting competency rating of employees horizontal bar chart sample ppt presentation. This is a competency rating of employees horizontal bar chart sample ppt presentation. This is a eight stage process. The stages in this process are managerial efficiency, resource planning, develop and implements, financial accounting, financial analysis, financial planning, provides direction, directiveness.
-
 Cost per employee data driven line graph powerpoint templates
Presenting cost per employee data driven line graph powerpoint templates. This is a cost per employee data driven line graph powerpoint templates. This is a six stage process. The stages in this process are graph line, cost, employee, growth, success.
-
 Employee satisfaction survey results pie chart powerpoint presentation examples
Presenting employee satisfaction survey results pie chart powerpoint presentation examples. This is a employee satisfaction survey results pie chart powerpoint presentation examples. This is a four stage process. The stages in this process are employee satisfaction with workforce, satisfaction by income level.
-
 Employees hr metrics graph powerpoint images
Presenting employees hr metrics graph powerpoint images. This is a employees hr metrics graph powerpoint images. This is a five stage process. The stages in this process are below bachelor degree, bachelor degree, post graduate diploma, master degree, doctorate.
-
 Employees who leave within first 6 months powerpoint shapes
Presenting employees who leave within first 6 months powerpoint shapes. This is a employees who leave within first 6 months powerpoint shapes. This is a three stage process. The stages in this process are employees left job within the first 6 months, felt their boss was a jerk, work was different than they expected, changed their mind on work type.
-
 Horizontal bar chart for comparison powerpoint slide ideas
Presenting horizontal bar chart for comparison PPT slide. This presentation graph chart is fully editable in PowerPoint. You can customize the font type, font size, colors of the chart and background color as per your requirement. The slide is fully compatible with Google slides and can be saved in JPG or PDF format without any hassle. High quality graphics and icons ensure that there is no deteriorating in quality on enlarging their size. Have the tendency to boost the overall impression of your presentation.
-
 Hr dashboard editable powerpoint slide images
Stunning HR dashboard editable PPT slideshow. Loaded with incomparable benefits. Readymade PPT graphic helps in saving time and effort. Can be personalized by adding company trademark, logo, brand and symbols. Can be utilized for displaying both simple and complex information. Include or exclude slide content as per your individual need. Colors and text can be easily changed as the PPT slide is completely editable. Useful for every business leader and professional, project management team, business analysts, etc.
-
 Hr dashboard snapshot metrics powerpoint slide influencers
Presenting hr dashboard snapshot metrics powerpoint slide influencers. This is a hr dashboard metrics powerpoint slide influencers. This is a four stage process. The stages in this process are open positions by divisions, key metrics, total employees, employee churn.
-
 Managers training hours doughnut chart powerpoint slide
Presenting managers training hours doughnut chart powerpoint slide. This is a managers training hours doughnut chart powerpoint slide. This is a four stage process. The stages in this process are open positions by divisions, key metrics, total employees, employee churn.
-
 Profit per employee data driven line graph powerpoint slide background image
Presenting profit per employee data driven line graph powerpoint slide background image. This is a profit per employee data driven line graph powerpoint slide background image. This is a six stage process. The stages in this process are profit, employee, graph, line, growth.
-
 Revenue cost per employee comparison line graph powerpoint slide background picture
Presenting revenue cost per employee comparison line graph powerpoint slide background picture. This is a revenue cost per employee comparison line graph powerpoint slide background picture. This is a seven stage process. The stages in this process are company rpe, company ecpe.
-
 Revenue per employee ppt bar graph powerpoint slide background image
Presenting revenue per employee ppt bar graph powerpoint slide background image. This is a revenue per employee ppt bar graph powerpoint slide background image. This is a eight stage process. The stages in this process are annual revenue per employee, company revenue, revenue per employee, revenue, total number of employees.
-
 Speedometer dashboard for performance measurement powerpoint slide backgrounds
Presenting speedometer dashboard for performance measurement powerpoint slide backgrounds. This is a speedometer dashboard for performance measurement powerpoint slide backgrounds. This is a three stage process. The stages in this process are measure, meter, dashboard, speedometer, needle.
-
 Staff acquisition source horizontal bar chart powerpoint slide backgrounds
Presenting staff acquisition source horizontal bar chart powerpoint slide backgrounds. This is a staff acquisition source horizontal bar chart powerpoint slide backgrounds. This is a seven stage process. The stages in this process are campus interview, career fair, recruitment vendor, employee referral, web groups, job portals, print media.
-
 Training hours per employee powerpoint slide presentation tips
Presenting training hours per employee powerpoint slide presentation tips. This is a training hours per employee powerpoint slide presentation tips. This is a four stage process. The stages in this process are average training hours, sum of total training hours, total number of employees.
-
 Types of employee training provided doughnut chart powerpoint slide clipart
Presenting types of employee training provided doughnut chart powerpoint slide clipart. This is a types of employee training provided doughnut chart powerpoint slide clipart. This is a four stage process. The stages in this process are in person, hybrid, on-line, hands on.
-
 Why people leave an organization pie chart powerpoint slide deck samples
Presenting why people leave an organization pie chart powerpoint slide deck samples. This is a why people leave an organization pie chart powerpoint slide deck samples. This is a six stage process. The stages in this process are management general work environment, unsatisfied with pay and benefits, lack of fit to job, lack of job security, lack of flexibility scheduling, limited career advancement promotional opportunities.
-
 Workforce diversity by age group clustered bar chart powerpoint slide deck template
Presenting workforce diversity by age group clustered bar chart powerpoint slide deck template. This is a workforce diversity by age group clustered bar chart powerpoint slide deck template. This is a three stage process. The stages in this process are total workforce, male, female.
-
 Workforce diversity by gender powerpoint slide design ideas
Presenting workforce diversity by gender powerpoint slide design ideas. This is a workforce diversity by gender powerpoint slide design ideas. This is a two stage process. The stages in this process are male employees, female employees, new hires, left employment.
-
 Workforce diversity by region clustered bar graph powerpoint slide design templates
Presenting workforce diversity by region clustered bar graph powerpoint slide design templates. This is a workforce diversity by region clustered bar graph powerpoint slide design templates. This is a four stage process. The stages in this process are employees headcount, new employees hire, employees left job.
-
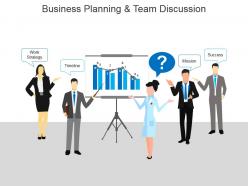 Business planning and team discussion powerpoint images
Presenting business planning and team discussion powerpoint images. This is a business planning and team discussion powerpoint images. This is a five stage process. The stages in this process are work strategy, timeline, mission, success.
-
 Market analysis dashboard powerpoint slide designs
Presenting market analysis dashboard powerpoint slide designs. This is a market analysis dashboard powerpoint slide designs. This is a two stage process. The stages in this process are stakeholders and market, business leverage, global contracts contract coverage, centralized resources, agility to execute, standard process to work globally, manage contract demand.
-
 Sales dashboard powerpoint slide show
Presenting sales dashboard powerpoint slide show. This is a sales dashboard powerpoint slide show. This is a two stage process. The stages in this process are customer retention, sales chart, yield from new and existing customers, business sales report.
-
 Value proposition in marketing powerpoint slides design
Presenting value proposition in marketing powerpoint slides design. This is a value proposition in marketing powerpoint slides design. This is a three stage process. The stages in this process are business relationships, competitors analysis, media marketing, category, series.
-
 Real estate mortgage rates ppt design templates
Presenting real estate mortgage rates ppt design templates. This is a real estate mortgage rates ppt design templates. This is a twelve stage process. The stages in this process are business, marketing, percentage, management, graph.
-
 Real estate new home loan applications ppt background
Presenting real estate new home loan applications ppt background. This is a real estate new home loan applications ppt background. This is a one stage process. The stages in this process are business, marketing, percentage, management, graph.
-
 Real estate prices projected appreciation ppt examples slides
Presenting real estate prices projected appreciation ppt examples slides. This is a real estate prices projected appreciation ppt examples slides. This is a four stage process. The stages in this process are business, marketing, price, management, decline.
-
 Real estate rents ppt sample download
Presenting real estate rents ppt sample download. This is a real estate rents ppt sample download. This is a one stage process. The stages in this process are business, marketing, rent, management, growth.
-
 Real estate reo and short sales ppt samples
Presenting real estate reo and short sales ppt samples. This is a real estate reo and short sales ppt samples. This is a one stage process. The stages in this process are business, marketing, sale, management, growth.
-
 Real estate sales and prices comparison ppt slide
Presenting real estate sales and prices comparison ppt slide. This is a real estate sales and prices comparison ppt slide. This is a two stage process. The stages in this process are prices, sales, existing, new.
-
 Real estate sales growth ppt templates
Presenting real estate sales growth ppt templates. This is a real estate sales growth ppt templates. This is a six stage process. The stages in this process are business, marketing, growth, management, sales.
-
 Most expensive metro areas example of ppt presentation
Presenting most expensive metro areas example of ppt presentation. This is a most expensive metro areas example of ppt presentation. This is a eight stage process. The stages in this process are honolulu, san jose, san francisco, anaheim, new york white plans, new york long island, san diego, ny nassau suffolk.
-
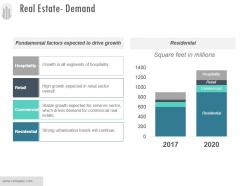 Real estate demand sample ppt presentation
Presenting real estate demand sample ppt presentation. This is a real estate demand sample ppt presentation. This is a four stage process. The stages in this process are hospitality, retail, commercial, residential.
-
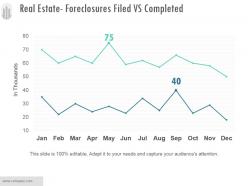 Real estate foreclosures filed vs completed sample of ppt
Presenting real estate foreclosures filed vs completed sample of ppt. This is a real estate foreclosures filed vs completed sample of ppt. This is a two stage process. The stages in this process are finance, business, marketing, graph, line.
-
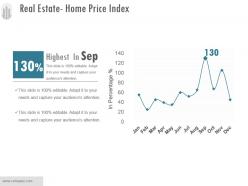 Real estate home price index powerpoint layout
Presenting real estate home price index powerpoint layout. This is a real estate home price index powerpoint layout. This is a one stage process. The stages in this process are marketing, graph, line, finance, business.
-
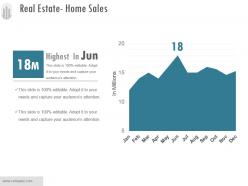 Real estate home sales powerpoint presentation examples
Presenting real estate home sales powerpoint presentation examples. This is a real estate home sales powerpoint presentation examples. This is a one stage process. The stages in this process are finance, business, marketing, graph, line.
-
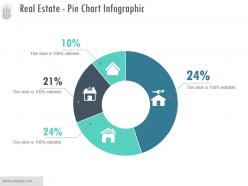 Real estate pie chart infographic sample of ppt presentation
Presenting real estate pie chart infographic sample of ppt presentation. This is a real estate pie chart infographic sample of ppt presentation. This is a four stage process. The stages in this process are icons, strategy, percentage, finance, business.
-
 4 metric dashboard of performance indicators example of ppt
Presenting 4 metric dashboard of performance indicators example of ppt. This is a 4 metric dashboard of performance indicators example of ppt. This is a four stage process. The stages in this process are dashboard, finance, percentage, business, marketing.
-
 Business progress growth dashboard powerpoint show
Presenting business progress growth dashboard powerpoint show. This is a business progress growth dashboard powerpoint show. This is a five stage process. The stages in this process are business, marketing, dashboard, measure, management.
-
 Improving team dynamics skills pie chart ppt background
Presenting improving team dynamics skills pie chart ppt background. This is a improving team dynamics skills pie chart ppt background. This is a four stage process. The stages in this process are noticing when the group avoid a topic, sensing individuals feelings, recognizing and understanding the stages of team development, managing dysfunctional behaviors, sufficient do more, do less.
-
Innovative and Colorful designs.
-
Awesome presentation, really professional and easy to edit.
-
Presentation Design is very nice, good work with the content as well.
-
Top Quality presentations that are easily editable.
-
Best Representation of topics, really appreciable.
-
Editable templates with innovative design and color combination.
-
Awesomely designed templates, Easy to understand.
-
Content of slide is easy to understand and edit.
-
Very well designed and informative templates.
-
Designs have enough space to add content.


