- Sub Categories
-
 Performance comparison powerpoint slides templates
Presenting performance comparison powerpoint slides templates. This is a performance comparison powerpoint slides templates. This is a two stage process. The stages in this process are customer focus, accountability, service excellence, problem solving, continuous improvement, collaborative conflict resolution.
-
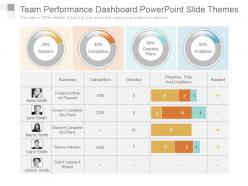 Team performance dashboard powerpoint slide themes
Presenting team performance dashboard powerpoint slide themes. This is a team performance dashboard powerpoint slide themes. This is a four stage process. The stages in this process are summary, completion, overdue, progress, plan and problems, reward, finished what he planned, doesnt complete his plans, doesnt complete his plans, shows initiative, didnt submit a report.
-
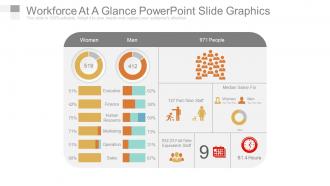 Workforce at a glance powerpoint slide graphics
Presenting this workforce analysis and planning PowerPoint presentation slide. The PPT slide is available in both widescreen size (16:9) and standard screen size (4:3). This template has been designed by our team of qualified designers and is editable in PowerPoint. You can change the font type, font size, font style, icons and background color of the slide as per your requirement. It is convenient to insert your company name and logo in the slide. You can remove the sample content in text placeholders and add your presentation’s content. The slide is fully compatible with Google slides and can be saved in JPG or PDF format easily. High resolution graphic image ensures that there is no deterioration in quality on enlarging the size of the image. You can download the slide quickly at the click of a button.
-
 Kpi dashboard ppt infographic template
Presenting kpi dashboard ppt infographic template. This is a Kpi Dashboard Ppt Infographic Template. This is a four stage. The Stages in this process are outcasts, successful adverts, earned revenue, sold products, operations.
-
 Management of team dynamics skills ppt images gallery
Presenting management of team dynamics skills ppt images gallery. This is a management of team dynamics skills ppt images gallery. This is a four stage. The Stages in this process are noticing when the group avoid a topic, sensing individuals feelings, recognizing and understanding the stages of team development, managing dysfunctional behaviors.
-
 Performance comparison ppt infographics
Presenting performance comparison ppt infographics. This is a performance comparison ppt infographics. This is a two stage. The Stages in this process are customer focus, accountability, service excellence, problem solving, continuous improvement, collaborative conflict resolution.
-
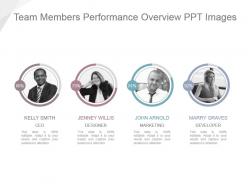 Team members performance overview ppt images
Presenting team members performance overview ppt images. This is a team members performance overview ppt images. This is a four stage. The Stages in this process are kelly smith, jenney willis, john arnold, marry graves, ceo, designer, marketing, developer.
-
 Team performance dashboard snapshot ppt icon
Presenting team performance dashboard ppt icon. This is a team performance dashboard snapshot ppt icon. This is a four stage. The Stages in this process are john smith, anita smith, carol smith, marry smith, peter smith, reward, completion, overdue plans, problems, summary, finished what he planned, doesn?t complete his plans, doesnt complete his plans, shows initiative, didnt submit a report, completion, overdue, progress, plan and problems, reward.
-
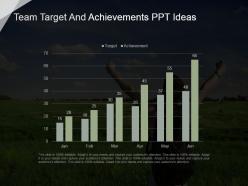 Team target and achievements ppt ideas
Presenting team target and achievements ppt ideas. This is a team target and achievements ppt ideas. This is a six stage. The Stages in this process are target, achievement, jan, feb, mar, apr, may, jun.
-
 Workforce at a glance ppt examples slides
Presenting workforce at a glance ppt examples slides. This is a workforce at a glance ppt examples slides. This is a two stage. The Stages in this process are executive, finance, human resource, marketing, operation, sales, people, part time staff, median salary for, full time equivalent staff.
-
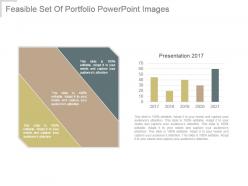 Feasible set of portfolio powerpoint images
Presenting feasible set of portfolio powerpoint images. This is a feasible set of portfolio powerpoint images. This is a two stage process. The stages in this process are years, planning, business, finance, marketing.
-
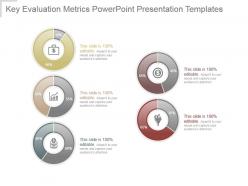 Key evaluation metrics powerpoint presentation templates
Presenting key evaluation metrics powerpoint presentation templates. This is a key evaluation metrics powerpoint presentation templates. This is a five stage process. The stages in this process are icons, planning, business, finance, marketing.
-
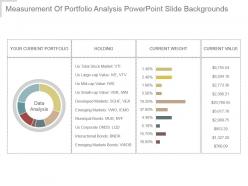 Measurement of portfolio analysis powerpoint slide backgrounds
Presenting measurement of portfolio analysis powerpoint slide backgrounds. This is a measurement of portfolio analysis powerpoint slide backgrounds. This is a seven stage process. The stages in this process are data analysis, your current portfolio, holding, current weight, current value.
-
 Portfolio evaluation example ppt presentation
Presenting portfolio evaluation example ppt presentation. This is a portfolio evaluation example ppt presentation. This is a two stage process. The stages in this process are peso govt debt securities, foreign govt debt securities, peso corporate debt securities, dollar corporate debt securities, equity.
-
 Portfolio return and performance powerpoint layout
Presenting portfolio return and performance powerpoint layout. This is a portfolio return and performance powerpoint layout. This is a nine stage process. The stages in this process are years, planning, business, finance, marketing.
-
 Portfolio return and performance powerpoint slide backgrounds
Presenting portfolio return and performance powerpoint slide backgrounds. This is a portfolio return and performance powerpoint slide backgrounds. This is a four stage process. The stages in this process are good, expected, poor, very poor, contributions only.
-
 Portfolio revision powerpoint slide background picture
Presenting portfolio revision powerpoint slide background picture. This is a portfolio revision powerpoint slide background picture. This is a two stage process. The stages in this process are stocks, current portfolio, new portfolio.
-
 Resource capacity planning powerpoint slide clipart
Presenting resource capacity planning powerpoint slide clipart. This is a resource capacity planning powerpoint slide clipart. This is a five stage process. The stages in this process are pie chart, planning, business, finance, marketing.
-
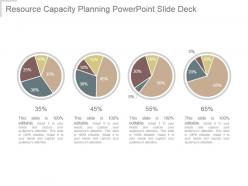 Resource capacity planning powerpoint slide deck
Presenting resource capacity planning powerpoint slide deck. This is a resource capacity planning powerpoint slide deck. This is a four stage process. The stages in this process are pie chart, planning, business, finance, marketing.
-
 Risk return plot powerpoint slide design templates
Presenting risk return plot powerpoint slide design templates. This is a risk return plot powerpoint slide design templates. This is a nine stage process. The stages in this process are risk return plot, annualized return, annualized standard deviation.
-
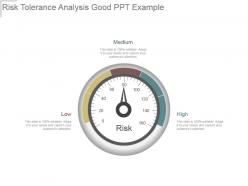 Risk tolerance analysis good ppt example
Presenting risk tolerance analysis good ppt example. This is a risk tolerance analysis good ppt example. This is a one stage process. The stages in this process are high, low, medium.
-
 Security analysis powerpoint slide designs
Presenting security analysis powerpoint slide designs. This is a security analysis powerpoint slide designs. This is a one stage process. The stages in this process are open, pt close, high, low.
-
 Feasible set of portfolio powerpoint slide backgrounds
Presenting feasible set of portfolio powerpoint slide backgrounds. This is a feasible set of portfolio powerpoint slide backgrounds. This is a five stage process. The stages in this process are years, planning, presentation, business, marketing.
-
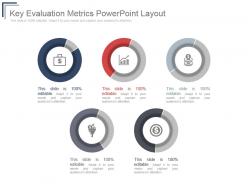 Key evaluation metrics powerpoint layout
Presenting key evaluation metrics powerpoint layout. This is a key evaluation metrics powerpoint layout. This is a five stage process. The stages in this process are icons, business, marketing, presentation, management.
-
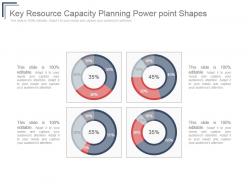 Key resource capacity planning power point shapes
Presenting key resource capacity planning power point shapes. This is a key resource capacity planning power point shapes. This is a four stage process. The stages in this process are success, business, marketing, presentation, management.
-
 Key resource capacity planning powerpoint presentation
Presenting key resource capacity planning powerpoint presentation. This is a key resource capacity planning powerpoint presentation. This is a five stage process. The stages in this process are success, business, marketing, presentation, management.
-
 Measurement of portfolio analysis powerpoint slide
Presenting measurement of portfolio analysis PowerPoint slide. This layout is Compatible with Google slides. Easy to put in company logo, trademark or name; accommodate words to support the key points. Images do no blur out even when they are projected on large screen.PPT template can be utilized by sales and marketing teams and business managers. Instantly downloadable slide and supports formats like JPEG and PDF. Adjust colors, text and fonts as per your business requirements.
-
 Portfolio evaluation powerpoint show
Presenting portfolio evaluation powerpoint show. This is a portfolio evaluation powerpoint show. This is a two stage process. The stages in this process are peso govt debt securities, foreign govt debt securities, peso corporate debt securities, dollar corporate debt securities, equity.
-
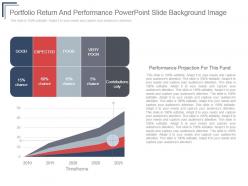 Portfolio return and performance powerpoint slide background image
Presenting portfolio return and performance powerpoint slide background image. This is a portfolio return and performance powerpoint slide background image. This is a five stage process. The stages in this process are good, expected, poor, very poor, contributions only.
-
 Portfolio return and performance powerpoint slide background picture
Presenting portfolio return and performance powerpoint slide background picture. This is a portfolio return and performance powerpoint slide background picture. This is a four stage process. The stages in this process are years, planning, presentation, business, marketing.
-
 Portfolio revision powerpoint slide background
Presenting portfolio revision powerpoint slide background. This is a portfolio revision powerpoint slide background. This is a two stage process. The stages in this process are current portfolio, new portfolio.
-
 Risk return plot powerpoint slide deck template
Presenting risk return plot powerpoint slide deck template. This is a risk return plot powerpoint slide deck template. This is a nine stage process. The stages in this process are annualized return, annualized standard deviation.
-
 Risk tolerance analysis powerpoint slide designs
Presenting risk tolerance analysis powerpoint slide designs. This is a risk tolerance analysis powerpoint slide designs. This is a one stage process. The stages in this process are middle, low, high.
-
 Security analysis powerpoint slide designs download
Presenting security analysis powerpoint slide designs download. This is a security analysis powerpoint slide designs download. This is a two stage process. The stages in this process are success, business, marketing, presentation, management.
-
 Selection of the optimal portfolio powerpoint slide backgrounds
Presenting selection of the optimal portfolio powerpoint slide backgrounds. This is a selection of the optimal portfolio powerpoint slide backgrounds. This is a three stage process. The stages in this process are success, business, marketing, presentation, management.
-
 Feasible set of portfolio powerpoint slide designs
Presenting feasible set of portfolio powerpoint slide designs. This is a feasible set of portfolio powerpoint slide designs. This is a two stage process. The stages in this process are arrow, business, marketing, success, strategy, management.
-
 Key evaluation metrics powerpoint slide background
Presenting key evaluation metrics powerpoint slide background. This is a key evaluation metrics powerpoint slide background. This is a five stage process. The stages in this process are business, process, marketing, strategy, success, analysis.
-
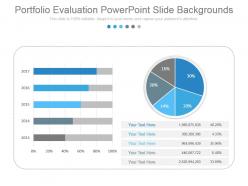 Portfolio evaluation powerpoint slide backgrounds
Presenting portfolio evaluation powerpoint slide backgrounds. This is a portfolio evaluation powerpoint slide backgrounds. This is a five stage process. The stages in this process are business, marketing, management, strategy, process.
-
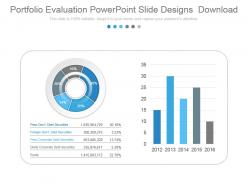 Portfolio evaluation powerpoint slide designs download
Presenting portfolio evaluation powerpoint slide designs download. This is a portfolio evaluation powerpoint slide designs download. This is a two stage process. The stages in this process are peso govt debt securities, foreign govt debt securities, peso corporate debt securities, dollar corporate debt securities, equity.
-
 Portfolio return and performance powerpoint presentation examples
Presenting portfolio return and performance powerpoint presentation examples. This is a portfolio return and performance powerpoint presentation examples. This is a two stage process. The stages in this process are business, management, success, strategy, marketing.
-
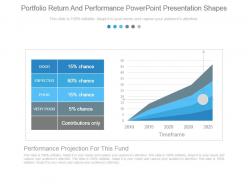 Portfolio return and performance powerpoint presentation shapes
Presenting portfolio return and performance powerpoint presentation shapes. This is a portfolio return and performance powerpoint presentation shapes. This is a two stage process. The stages in this process are good, expected, poor, very poor, contributions only, timeframe.
-
 Portfolio revision powerpoint shapes
Presenting portfolio revision powerpoint shapes. This is a portfolio revision powerpoint shapes. This is a two stage process. The stages in this process are current portfolio, new portfolio.
-
 Resource capacity planning powerpoint guide
Presenting resource capacity planning powerpoint guide. This is a resource capacity planning powerpoint guide. This is a five stage process. The stages in this process are business, process, marketing, management, strategy, success.
-
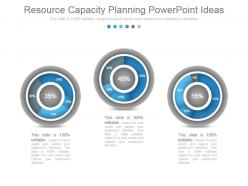 Resource capacity planning powerpoint ideas
Presenting resource capacity planning powerpoint ideas. This is a resource capacity planning powerpoint ideas. This is a three stage process. The stages in this process are percentage, business, process, marketing, management, strategy, success.
-
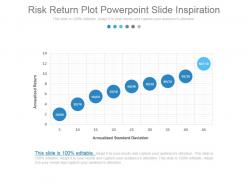 Risk return plot powerpoint slide inspiration
Presenting risk return plot powerpoint slide inspiration. This is a risk return plot powerpoint slide inspiration. This is a nine stage process. The stages in this process are annualized return , annualized standard deviation.
-
 Security analysis powerpoint slide download
Presenting security analysis powerpoint slide download. This is a security analysis powerpoint slide download. This is a one stage process. The stages in this process are open, port close, high, low.
-
 Selection of the optimal portfolio powerpoint slide designs
Presenting selection of the optimal portfolio powerpoint slide designs. This is a selection of the optimal portfolio powerpoint slide designs. This is a three stage process. The stages in this process are business, process, marketing, management, strategy, success.
-
 5s scoring result powerpoint presentation examples
Presenting 5s scoring result powerpoint presentation examples. This is a 5s scoring result powerpoint presentation examples. This is a five stage process. The stages in this process are scoring result, radar chart, step, sort, straighten, shine, standardize, sustain.
-
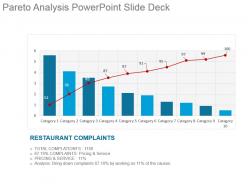 Pareto analysis powerpoint slide deck
Presenting pareto analysis powerpoint slide deck. This is a pareto analysis powerpoint slide deck. This is a ten stage process. The stages in this process are restaurant complaints, total complaints, complaints pricing and service, pricing and service, analysis bring down complaints, category.
-
 Pareto chart powerpoint slide clipart
Presenting pareto chart powerpoint slide clipart. This is a pareto chart powerpoint slide clipart. This is a eight stage process. The stages in this process are category, reason.
-
 Process capability measurement powerpoint guide
Presenting process capability measurement powerpoint guide. This is a process capability measurement powerpoint guide. This is a nine stage process. The stages in this process are lsl, usl, category, target.
-
 Process specification limits powerpoint slide background designs
Presenting process specification limits powerpoint slide background designs. This is a process specification limits powerpoint slide background designs. This is a four stage process. The stages in this process are lsl, usl, target, chart title.
-
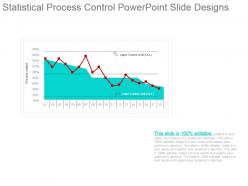 Statistical process control powerpoint slide designs
Presenting statistical process control powerpoint slide designs. This is a statistical process control powerpoint slide designs. This is a one stage process. The stages in this process are process output, upper control limit, lower control limit.
-
 The improvement pdca cycle powerpoint slide backgrounds
Presenting the improvement pdca cycle PPT template. Fully creative and editable PPT slide visual. Modify and personalize the presentation by including the company name and logo. Guidance for executing the changes has been provided for assistance. Useful for sales executives, marketers, business professionals, analysts, strategists, students, teachers, etc. Easily and effortlessly modifiable by any user at any time without even having any specialized knowledge. Compatible with Microsoft office software and the Google slides. Available to be saved in jpg or pdf format.
-
 Xbar and r chart powerpoint slide rules
Presenting xbar and r chart powerpoint slide rules. This is a xbar and r chart powerpoint slide rules. This is a two stage process. The stages in this process are option, subtitle, ucl, lcl.
-
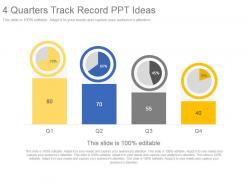 4 quarters track record ppt ideas
Presenting 4 quarters track record PPT template. Beneficial for the business managers, marketing professionals and the strategy designers. Access to convert the presentation design into JPG and PDF. Offer 100% access to change the size and style of the slides once downloaded and saved in the desired format. Choice to get presentation slide in standard or in widescreen view. Easy to convert in JPEG and PDF document. Compatible with Google slides. Easy and hassle-free downloading process.
-
 Channel kpis ppt images gallery
Presenting channel kpis ppt images gallery. This is a channel kpis ppt images gallery. This is a four stage process. The stages in this process are sales density, personnel cost, real estate cost, inventory turnover, supermarkets, soft discount, hard discount.
-
 Chart variations to compare quarterly performance ppt icon
Presenting chart variations to compare quarterly performance ppt icon. This is a chart variations to compare quarterly performance ppt icon. This is a two stage process. The stages in this process are series.
-
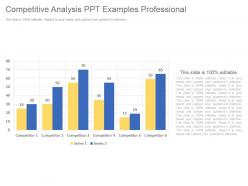 Competitive analysis ppt examples professional
Presenting competitive analysis ppt examples professional. This is a competitive analysis ppt examples professional. This is a six stage process. The stages in this process are competitor, series.
-
 Current quarter portfolio ppt images
Presenting current quarter portfolio ppt images. This is a current quarter portfolio ppt images. This is a six stage process. The stages in this process are pie, business, marketing, finance, management.
-
Really like the color and design of the presentation.
-
Commendable slides with attractive designs. Extremely pleased with the fact that they are easy to modify. Great work!
-
Great experience, I would definitely use your services further.
-
Designs have enough space to add content.
-
Excellent design and quick turnaround.
-
Unique design & color.
-
Best Representation of topics, really appreciable.
-
Top Quality presentations that are easily editable.
-
The Designed Graphic are very professional and classic.
-
Professional and unique presentations.


