Consumer Goods and FMCG Data Statistics PowerPoint Templates, PowerPoint Statistics Slides
- Sub Categories
-
- Agriculture
- Chemicals and Resources
- Construction
- Consumer Goods and FMCG
- E-Commerce
- Energy and Environmental Services
- Finance Insurance and Real Estate
- Health and Pharmaceuticals
- Internet
- Life
- Media and Advertising
- Metals and Electronics
- Retail and Trade
- Services
- Society
- Sports and Recreation
- Survey
- Technology and Telecommunications
- Transportation and Logistics
- Travel Tourism and Hospitality
- USA
-
 Mcdonalds corporation business model 2019
The information presented in this slide has been researched by our team of professional business analysts. This is part of our Company Profiles products selection, and you will need a Paid account to download the actual report with accurate data and sources. Downloaded report will be in Powerpoint and will contain the actual editable slides with the actual data and sources for each data. This slide gives a brief introduction in points about McDonalds Business Model. Download it immediately and use it for your business.
-
 Mcdonalds corporation business strategy 2018
The information presented in this slide has been researched by our team of professional business analysts. This is part of our Company Profiles products selection, and you will need a Paid account to download the actual report with accurate data and sources. Downloaded report will be in Powerpoint and will contain the actual editable slides with the actual data and sources for each data. This slide shows McDonalds Corporation Business Strategy and its Pillars for 2018. Download it immediately and use it for your business.
-
 Mcdonalds corporation highlights 2018
The information presented in this slide has been researched by our team of professional business analysts. This is part of our Company Profiles products selection, and you will need a Paid account to download the actual report with accurate data and sources. Downloaded report will be in Powerpoint and will contain the actual editable slides with the actual data and sources for each data. This slide shows some of the McDonalds Corporations Business Highlights like partnerships, new deals, shareholders dividend, new beverage introduced etc. in 2018. Download it immediately and use it for your business.
-
 Mcdonalds corporation history timeline
The information presented in this slide has been researched by our team of professional business analysts. This is part of our Company Profiles products selection, and you will need a Paid account to download the actual report with accurate data and sources. Downloaded report will be in Powerpoint and will contain the actual editable slides with the actual data and sources for each data. This slide shows McDonalds Historical Timeline and relevant events starting from the years 1940 to 1955. Download it immediately and use it for your business.
-
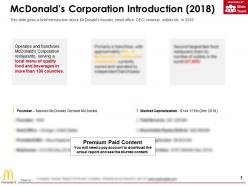 Mcdonalds corporation introduction 2018
The information presented in this slide has been researched by our team of professional business analysts. This is part of our Company Profiles products selection, and you will need a Paid account to download the actual report with accurate data and sources. Downloaded report will be in Powerpoint and will contain the actual editable slides with the actual data and sources for each data. This slide gives a brief introduction about McDonalds founder, head office, CEO, revenue, outlets etc. in 2018 . Download it immediately and use it for your business.
-
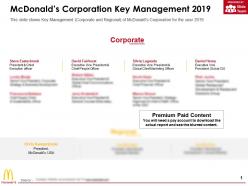 Mcdonalds corporation key management 2019
The information presented in this slide has been researched by our team of professional business analysts. This is part of our Company Profiles products selection, and you will need a Paid account to download the actual report with accurate data and sources. Downloaded report will be in Powerpoint and will contain the actual editable slides with the actual data and sources for each data.This slide shows Key Management Corporate and Regional of McDonalds Corporation for the year 2019. Download it immediately and use it for your business.
-
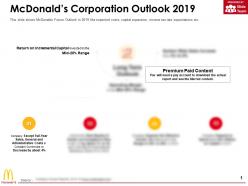 Mcdonalds corporation outlook 2019
The information presented in this slide has been researched by our team of professional business analysts. This is part of our Company Profiles products selection, and you will need a Paid account to download the actual report with accurate data and sources. Downloaded report will be in Powerpoint and will contain the actual editable slides with the actual data and sources for each data. This slide shows McDonalds Future Outlook in 2019 like expected costs, capital expansion, income tax rate expectations etc. Download it immediately and use it for your business.
-
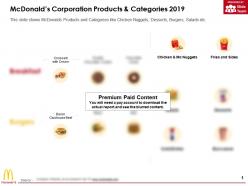 Mcdonalds corporation products and categories 2019
The information presented in this slide has been researched by our team of professional business analysts. This is part of our Company Profiles products selection, and you will need a Paid account to download the actual report with accurate data and sources. Downloaded report will be in Powerpoint and will contain the actual editable slides with the actual data and sources for each data. This slide shows McDonalds Products and Categories like Chicken Nuggets, Desserts, Burgers, Salads etc. Download it immediately and use it for your business.
-
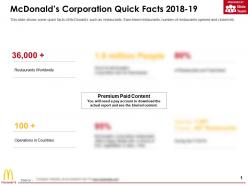 Mcdonalds corporation quick facts 2018-19
The information presented in this slide has been researched by our team of professional business analysts. This is part of our Company Profiles products selection, and you will need a Paid account to download the actual report with accurate data and sources. Downloaded report will be in Powerpoint and will contain the actual editable slides with the actual data and sources for each data. This slide shows some quick facts of McDonalds such as restaurants, franchised restaurants, number of restaurants opened and closed etc. Download it immediately and use it for your business.
-
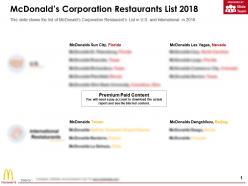 Mcdonalds corporation restaurants list 2018
The information presented in this slide has been researched by our team of professional business analysts. This is part of our Company Profiles products selection, and you will need a Paid account to download the actual report with accurate data and sources. Downloaded report will be in Powerpoint and will contain the actual editable slides with the actual data and sources for each data. This slide shows the list of McDonalds Corporation Restaurants List in U.S and International in 2018. Download it immediately and use it for your business.
-
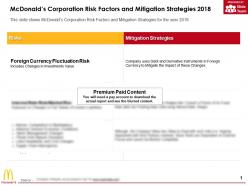 Mcdonalds corporation risk factors and mitigation strategies 2018
The information presented in this slide has been researched by our team of professional business analysts. This is part of our Company Profiles products selection, and you will need a Paid account to download the actual report with accurate data and sources. Downloaded report will be in Powerpoint and will contain the actual editable slides with the actual data and sources for each data. This slide shows McDonalds Corporation Risk Factors and Mitigation Strategies for the year 2018. Download it immediately and use it for your business.
-
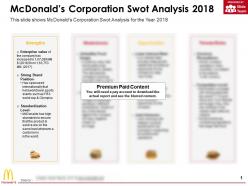 Mcdonalds corporation swot analysis 2018
The information presented in this slide has been researched by our team of professional business analysts. This is part of our Company Profiles products selection, and you will need a Paid account to download the actual report with accurate data and sources. Downloaded report will be in Powerpoint and will contain the actual editable slides with the actual data and sources for each data. This slide shows McDonalds Corporation Swot Analysis for the Year 2018. Download it immediately and use it for your business.
-
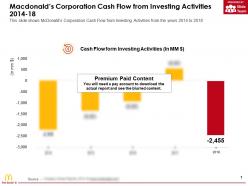 Macdonalds corporation cash flow from investing activities 2014-18
This is a professionally designed visual chart for Macdonalds Corporation Cash Flow From Investing Activities 2014-18. This is part of our Data and Statistics products selection, and you will need a Paid account to download the actual report with accurate data and sources. Downloaded report will contain the editable graph with accurate data, an excel table with the actual data, the exact source of the data and the release date. This slide shows McDonalds Corporation Cash Flow from Investing Activities from the years 2014 to 2018. Download it immediately and use it for your business.
-
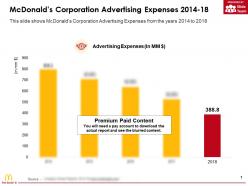 Mcdonalds corporation advertising expenses 2014-18
This is a professionally designed visual chart for Mcdonalds Corporation Advertising Expenses 2014-18. This is part of our Data and Statistics products selection, and you will need a Paid account to download the actual report with accurate data and sources. Downloaded report will contain the editable graph with accurate data, an excel table with the actual data, the exact source of the data and the release date. This slide shows McDonalds Corporation Advertising Expenses from the years 2014 to 2018. Download it immediately and use it for your business.
-
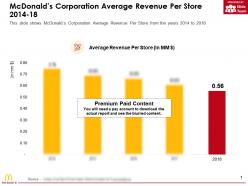 Mcdonalds corporation average revenue per store 2014-18
This is a professionally designed visual chart for Mcdonalds Corporation Average Revenue Per Store 2014-18. This is part of our Data and Statistics products selection, and you will need a Paid account to download the actual report with accurate data and sources. Downloaded report will contain the editable graph with accurate data, an excel table with the actual data, the exact source of the data and the release date. This slide shows McDonalds Corporation Average Revenue Per Store from the years 2014 to 2018. Download it immediately and use it for your business.
-
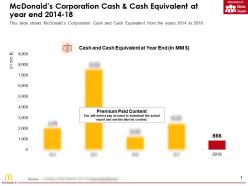 Mcdonalds corporation cash and cash equivalent at year end 2014-18
This is a professionally designed visual chart for Mcdonalds Corporation Cash And Cash Equivalent At Year End 2014-18. This is part of our Data and Statistics products selection, and you will need a Paid account to download the actual report with accurate data and sources. Downloaded report will contain the editable graph with accurate data, an excel table with the actual data, the exact source of the data and the release date. This slide shows McDonalds Corporation Cash and Cash Equivalent from the years 2014 to 2018. Download it immediately and use it for your business.
-
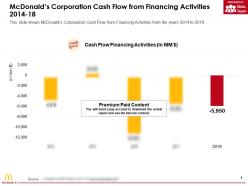 Mcdonalds corporation cash flow from financing activities 2014-18
This is a professionally designed visual chart for Mcdonalds Corporation Cash Flow From Financing Activities 2014-18. This is part of our Data and Statistics products selection, and you will need a Paid account to download the actual report with accurate data and sources. Downloaded report will contain the editable graph with accurate data, an excel table with the actual data, the exact source of the data and the release date. This slide shows McDonalds Corporation Cash Flow from Financing Activities from the years 2014 to 2018. Download it immediately and use it for your business.
-
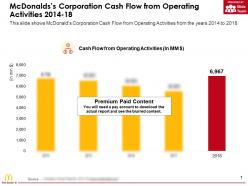 Mcdonalds corporation cash flow from operating activities 2014-18
This is a professionally designed visual chart for Mcdonalds Corporation Cash Flow From Operating Activities 2014-18. This is part of our Data and Statistics products selection, and you will need a Paid account to download the actual report with accurate data and sources. Downloaded report will contain the editable graph with accurate data, an excel table with the actual data, the exact source of the data and the release date. This slide shows McDonalds Corporation Cash Flow from Operating Activities from the years 2014 to 2018. Download it immediately and use it for your business.
-
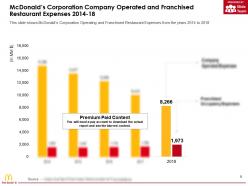 Mcdonalds corporation company operated and franchised restaurant expenses 2014-18
This is a professionally designed visual chart for Mcdonalds Corporation Company Operated And Franchised Restaurant Expenses 2014-18. This is part of our Data and Statistics products selection, and you will need a Paid account to download the actual report with accurate data and sources. Downloaded report will contain the editable graph with accurate data, an excel table with the actual data, the exact source of the data and the release date. This slide shows McDonalds Corporation Operating and Franchised Restaurant Expenses from the years 2014 to 2018. Download it immediately and use it for your business.
-
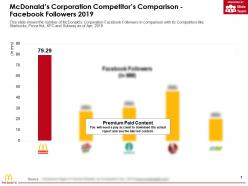 Mcdonalds corporation competitors comparison facebook followers 2019
This is a professionally designed visual chart for Mcdonalds Corporation Competitors Comparison Facebook Followers 2019. This is part of our Data and Statistics products selection, and you will need a Paid account to download the actual report with accurate data and sources. Downloaded report will contain the editable graph with accurate data, an excel table with the actual data, the exact source of the data and the release date. This slide shows the number of McDonalds Corporation Facebook Followers in comparison with its Competitors like Starbucks, Pizza Hut, KFC and Subway as of Apr, 2019 . Download it immediately and use it for your business.
-
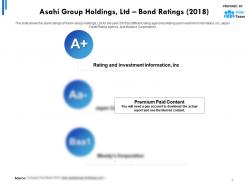 Asahi group holdings ltd bond ratings 2018
The information presented in this slide has been researched by our team of professional business analysts. This is part of our Company Profiles products selection, and you will need a Paid account to download the actual report with accurate data and sources. Downloaded report will be in Powerpoint and will contain the actual editable slides with the actual data and sources for each data. This slide shows the Bond ratings of Asahi Group Holdings, Ltd for the year 2018 by different rating agencies Rating and Investment Information, Inc, Japan Credit Rating Agency, and Moodys Corporation. Download it immediately and use it for your business.
-
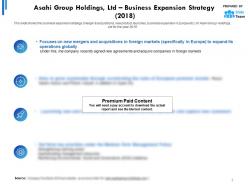 Asahi group holdings ltd business expansion strategy 2018
The information presented in this slide has been researched by our team of professional business analysts. This is part of our Company Profiles products selection, and you will need a Paid account to download the actual report with accurate data and sources. Downloaded report will be in Powerpoint and will contain the actual editable slides with the actual data and sources for each data. This slide shows the business expansion strategy merger and acquisitions, new product launches, business expansion in Europe etc. of Asahi Group Holdings, Ltd for the year 2018. Download it immediately and use it for your business.
-
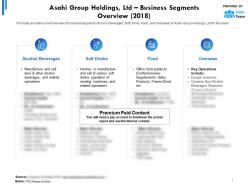 Asahi group holdings ltd business segments overview 2018
The information presented in this slide has been researched by our team of professional business analysts. This is part of our Company Profiles products selection, and you will need a Paid account to download the actual report with accurate data and sources. Downloaded report will be in Powerpoint and will contain the actual editable slides with the actual data and sources for each data. This slide provides a brief overview of business segments Alcohol beverages, Soft Drinks, Food, and Overseas of Asahi Group Holdings, Ltd for the years. Download it immediately and use it for your business.
-
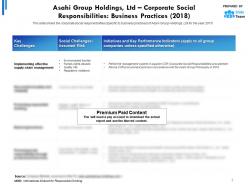 Asahi group holdings ltd corporate social responsibilities business practices 2018
The information presented in this slide has been researched by our team of professional business analysts. This is part of our Company Profiles products selection, and you will need a Paid account to download the actual report with accurate data and sources. Downloaded report will be in Powerpoint and will contain the actual editable slides with the actual data and sources for each data. This slide shows the corporate social responsibilities specific to business practices of Asahi Group Holdings, Ltd for the year 2018. Download it immediately and use it for your business.
-
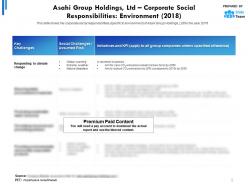 Asahi group holdings ltd corporate social responsibilities environment 2018
The information presented in this slide has been researched by our team of professional business analysts. This is part of our Company Profiles products selection, and you will need a Paid account to download the actual report with accurate data and sources. Downloaded report will be in Powerpoint and will contain the actual editable slides with the actual data and sources for each data. This slide shows the corporate social responsibilities specific to environment of Asahi Group Holdings, Ltd for the year 2018. Download it immediately and use it for your business.
-
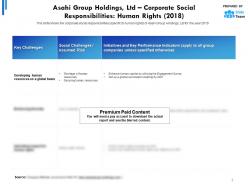 Asahi group holdings ltd corporate social responsibilities human rights 2018
The information presented in this slide has been researched by our team of professional business analysts. This is part of our Company Profiles products selection, and you will need a Paid account to download the actual report with accurate data and sources. Downloaded report will be in Powerpoint and will contain the actual editable slides with the actual data and sources for each data. This slide shows the corporate social responsibilities specific to human rights of Asahi Group Holdings, Ltd for the year 2018. Download it immediately and use it for your business.
-
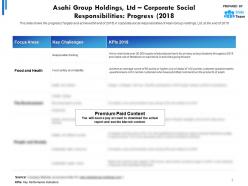 Asahi group holdings ltd corporate social responsibilities progress 2018
The information presented in this slide has been researched by our team of professional business analysts. This is part of our Company Profiles products selection, and you will need a Paid account to download the actual report with accurate data and sources. Downloaded report will be in Powerpoint and will contain the actual editable slides with the actual data and sources for each data. This slide shows the progress Targets and achieved till end of 2018 in corporate social responsibilities of Asahi Group Holdings, Ltd at the end of 2018. Download it immediately and use it for your business.
-
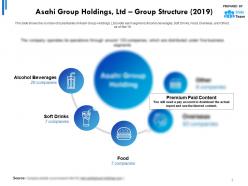 Asahi group holdings ltd group structure 2019
The information presented in this slide has been researched by our team of professional business analysts. This is part of our Company Profiles products selection, and you will need a Paid account to download the actual report with accurate data and sources. Downloaded report will be in Powerpoint and will contain the actual editable slides with the actual data and sources for each data. This slide shows the number of subsidiaries of Asahi Group Holdings, Ltd under each segment Alcohol beverages, Soft Drinks, Food, Overseas and Other as of Mar19. Download it immediately and use it for your business.
-
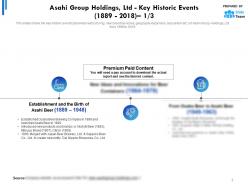 Asahi group holdings ltd key historic events 1889-2018
The information presented in this slide has been researched by our team of professional business analysts. This is part of our Company Profiles products selection, and you will need a Paid account to download the actual report with accurate data and sources. Downloaded report will be in Powerpoint and will contain the actual editable slides with the actual data and sources for each data. This slides shows the key historic events Business restructuring, new brand launches, geography expansion, acquisition etc. of Asahi Group Holdings, Ltd from 1889 to 2018. Download it immediately and use it for your business.
-
 Asahi group comparison with key competitors in domestic japan market 2017
This is a professionally designed visual chart for Asahi Group Comparison With Key Competitors In Domestic Japan Market 2017. This is part of our Data and Statistics products selection, and you will need a Paid account to download the actual report with accurate data and sources. Downloaded report will contain the editable graph with accurate data, an excel table with the actual data, the exact source of the data and the release date. This slide provides Asahi Group Holdings, Ltds comparison with Domestic Competitors Suntory, Kirin, and Sapporo on the basis of 2017 Financials Revenue, Operating Income and Margin, Employees, SGA Expenses etc. Download it immediately and use it for your business.
-
 Asahi group holdings ltd alcohol beverages business segment
This is a professionally designed visual chart for Asahi Group Holdings Ltd Alcohol Beverages Business Segment. This is part of our Data and Statistics products selection, and you will need a Paid account to download the actual report with accurate data and sources. Downloaded report will contain the editable graph with accurate data, an excel table with the actual data, the exact source of the data and the release date. This slide provides a revenue split of Alcohol Beverages Business Segment by marketing channel super market, convenience store, drugstore etc. of Asahi Group Holdings, Ltd for the years 2018. Download it immediately and use it for your business.
-
 Asahi group holdings ltd cash and cash equivalents at end of year 2014-2018
This is a professionally designed visual chart for Asahi Group Holdings Ltd Cash And Cash Equivalents At End Of Year 2014 to 2018. This is part of our Data and Statistics products selection, and you will need a Paid account to download the actual report with accurate data and sources. Downloaded report will contain the editable graph with accurate data, an excel table with the actual data, the exact source of the data and the release date. This slide provides a graph of Cash and Cash Equivalents in JPY Bn of Asahi Group Holdings, Ltd, for the years 2014 to 18 at the end of each year. Download it immediately and use it for your business.
-
 Asahi group holdings ltd cash flow from financing activities 2014-2018
This is a professionally designed visual chart for Asahi Group Holdings Ltd Cash Flow From Financing Activities 2014 to 2018. This is part of our Data and Statistics products selection, and you will need a Paid account to download the actual report with accurate data and sources. Downloaded report will contain the editable graph with accurate data, an excel table with the actual data, the exact source of the data and the release date. This slide provides a graph of cash flow from financing activities in JPY Bn of Asahi Group Holdings, Ltd, for the years 2014 to 18. Download it immediately and use it for your business.
-
 Asahi group holdings ltd statistic 1 alcohol beverages business segment
This is a professionally designed visual chart for Asahi Group Holdings Ltd Statistic 1 Alcohol Beverages Business Segment. This is part of our Data and Statistics products selection, and you will need a Paid account to download the actual report with accurate data and sources. Downloaded report will contain the editable graph with accurate data, an excel table with the actual data, the exact source of the data and the release date. This slide provides a graph of revenue split of Alcohol Beverages Business Segment by container type bottle, can, keg of Asahi Group Holdings, Ltd for the years 2014 to 18. Download it immediately and use it for your business.
-
 Asahi group holdings ltd statistic 1 food business segment
This is a professionally designed visual chart for Asahi Group Holdings Ltd Statistic 1 Food Business Segment. This is part of our Data and Statistics products selection, and you will need a Paid account to download the actual report with accurate data and sources. Downloaded report will contain the editable graph with accurate data, an excel table with the actual data, the exact source of the data and the release date. This slide provides the graph of market share candy tablet market, baby food market, instant miso soup of Asahi Group Holdings, Ltd in Japanese market for the year 2018. Download it immediately and use it for your business.
-
 Asahi group holdings ltd statistic 2 alcohol beverages business segment
This is a professionally designed visual chart for Asahi Group Holdings Ltd Statistic 2 Alcohol Beverages Business Segment. This is part of our Data and Statistics products selection, and you will need a Paid account to download the actual report with accurate data and sources. Downloaded report will contain the editable graph with accurate data, an excel table with the actual data, the exact source of the data and the release date. This slide provides a revenue split of Alcohol Beverages Business Segment by product category beer, wines, new genre etc. of Asahi Group Holdings, Ltd for the years 2014 to 18. Download it immediately and use it for your business.
-
 Asahi group holdings ltd statistic 2 food business segment
This is a professionally designed visual chart for Asahi Group Holdings Ltd Statistic 2 Food Business Segment. This is part of our Data and Statistics products selection, and you will need a Paid account to download the actual report with accurate data and sources. Downloaded report will contain the editable graph with accurate data, an excel table with the actual data, the exact source of the data and the release date. Asahi Group Holdings Ltd Statistic 3 Food Business Segment This slide provides the revenue split of Food Business Segment of Asahi Group Holdings, Ltd for the years 2018. Download it immediately and use it for your business.
-
 Asahi group holdings ltd statistic 3 alcohol beverages business segment
This is a professionally designed visual chart for Asahi Group Holdings Ltd Statistic 3 Alcohol Beverages Business Segment. This is part of our Data and Statistics products selection, and you will need a Paid account to download the actual report with accurate data and sources. Downloaded report will contain the editable graph with accurate data, an excel table with the actual data, the exact source of the data and the release date. This slide provides a graph of revenue in JPY Bn and core operating profit margin of Alcohol Beverages Business Segment of Asahi Group Holdings, Ltd for the years 2014 to 18. Download it immediately and use it for your business.
-
 Asahi group holdings ltd statistic 3 food business segment
This is a professionally designed visual chart for Asahi Group Holdings Ltd Statistic 3 Food Business Segment. This is part of our Data and Statistics products selection, and you will need a Paid account to download the actual report with accurate data and sources. Downloaded report will contain the editable graph with accurate data, an excel table with the actual data, the exact source of the data and the release date. This slide provides a graph of revenue in JPY Bn and core operating profit margin of Food Business Segment of Asahi Group Holdings, Ltd for the years 2014 to 18. Download it immediately and use it for your business.
-
 Mcdonalds corporation competitors employee comparison 2018
This is a professionally designed visual chart for Mcdonalds Corporation Competitors Employee Comparison 2018. This is part of our Data and Statistics products selection, and you will need a Paid account to download the actual report with accurate data and sources. Downloaded report will contain the editable graph with accurate data, an excel table with the actual data, the exact source of the data and the release date. This slide shows McDonalds Corporation Competitors Employee Count Comparison in 2018. Download it immediately and use it for your business.
-
 Mcdonalds corporation competitors operating income and margin comparison 2018
This is a professionally designed visual chart for Mcdonalds Corporation Competitors Operating Income And Margin Comparison 2018. This is part of our Data and Statistics products selection, and you will need a Paid account to download the actual report with accurate data and sources. Downloaded report will contain the editable graph with accurate data, an excel table with the actual data, the exact source of the data and the release date. This slide shows McDonalds Corporation Competitors Operating Income and Margin Comparison in 2018. Download it immediately and use it for your business.
-
 Mcdonalds corporation competitors revenue comparison 2018
This is a professionally designed visual chart for Mcdonalds Corporation Competitors Revenue Comparison 2018. This is part of our Data and Statistics products selection, and you will need a Paid account to download the actual report with accurate data and sources. Downloaded report will contain the editable graph with accurate data, an excel table with the actual data, the exact source of the data and the release date. This slide shows McDonalds Corporation Competitors Revenue Comparison in 2018. Download it immediately and use it for your business.
-
 Mcdonalds corporation competitors revenue per store comparison 2018
This is a professionally designed visual chart for Mcdonalds Corporation Competitors Revenue Per Store Comparison 2018. This is part of our Data and Statistics products selection, and you will need a Paid account to download the actual report with accurate data and sources. Downloaded report will contain the editable graph with accurate data, an excel table with the actual data, the exact source of the data and the release date. This slide shows McDonalds Corporation Competitors Revenue Per Store in 2018. Download it immediately and use it for your business.
-
 Mcdonalds corporation competitors store count comparison 2018
This is a professionally designed visual chart for Mcdonalds Corporation Competitors Store Count Comparison 2018. This is part of our Data and Statistics products selection, and you will need a Paid account to download the actual report with accurate data and sources. Downloaded report will contain the editable graph with accurate data, an excel table with the actual data, the exact source of the data and the release date. This slide shows McDonalds Corporation Competitors Store Count Comparison in 2018. Download it immediately and use it for your business.
-
 Mcdonalds corporation current assets 2014-18
This is a professionally designed visual chart for Mcdonalds Corporation Current Assets 2014-18. This is part of our Data and Statistics products selection, and you will need a Paid account to download the actual report with accurate data and sources. Downloaded report will contain the editable graph with accurate data, an excel table with the actual data, the exact source of the data and the release date. This slide shows McDonalds Corporation Current Assets from the years 2014 to 2018. Download it immediately and use it for your business.
-
 Mcdonalds corporation current liabilities 2014-18
This is a professionally designed visual chart for Mcdonalds Corporation Current Liabilities 2014-18. This is part of our Data and Statistics products selection, and you will need a Paid account to download the actual report with accurate data and sources. Downloaded report will contain the editable graph with accurate data, an excel table with the actual data, the exact source of the data and the release date. This slide shows McDonalds Corporation Current Liabilities from the years 2014 to 2018. Download it immediately and use it for your business.
-
 Mcdonalds corporation enterprise value 2014-2018
This is a professionally designed visual chart for Mcdonalds Corporation Enterprise Value 2014-2018. This is part of our Data and Statistics products selection, and you will need a Paid account to download the actual report with accurate data and sources. Downloaded report will contain the editable graph with accurate data, an excel table with the actual data, the exact source of the data and the release date. This slide shows McDonalds Corporation Enterprise Value from the years 2014 to 2018 As of December in each year. Download it immediately and use it for your business.
-
 Mcdonalds corporation financial overview canada company operated restaurant margin 2018
This is a professionally designed visual chart for Mcdonalds Corporation Financial Overview Canada Company Operated Restaurant Margin 2018. This is part of our Data and Statistics products selection, and you will need a Paid account to download the actual report with accurate data and sources. Downloaded report will contain the editable graph with accurate data, an excel table with the actual data, the exact source of the data and the release date. This slide shows McDonalds Corporation Company Operated Restaurant Margin for the Canada Region in 2018 . Download it immediately and use it for your business.
-
 Mcdonalds corporation financial overview canada company operating margin 2018
This is a professionally designed visual chart for Mcdonalds Corporation Financial Overview Canada Company Operating Margin 2018. This is part of our Data and Statistics products selection, and you will need a Paid account to download the actual report with accurate data and sources. Downloaded report will contain the editable graph with accurate data, an excel table with the actual data, the exact source of the data and the release date. This slide shows McDonalds Corporation Company Operating Margin for the Canada Region in 2018 . Download it immediately and use it for your business.
-
 Mcdonalds corporation financial overview canada comparable sales 2018
This is a professionally designed visual chart for Mcdonalds Corporation Financial Overview Canada Comparable Sales 2018. This is part of our Data and Statistics products selection, and you will need a Paid account to download the actual report with accurate data and sources. Downloaded report will contain the editable graph with accurate data, an excel table with the actual data, the exact source of the data and the release date. This slide shows McDonalds Corporation Comparable Sales for the Canada Region in 2018 . Download it immediately and use it for your business.
-
 Mcdonalds corporation financial overview canada development 2018
This is a professionally designed visual chart for Mcdonalds Corporation Financial Overview Canada Development 2018. This is part of our Data and Statistics products selection, and you will need a Paid account to download the actual report with accurate data and sources. Downloaded report will contain the editable graph with accurate data, an excel table with the actual data, the exact source of the data and the release date. This slide shows McDonalds Corporation Company Development in terms of Store Count, Network percentage and Store Class for the Canada Region in 2018 . Download it immediately and use it for your business.
-
 Mcdonalds corporation financial overview canada franchise margin 2018
This is a professionally designed visual chart for Mcdonalds Corporation Financial Overview Canada Franchise Margin 2018. This is part of our Data and Statistics products selection, and you will need a Paid account to download the actual report with accurate data and sources. Downloaded report will contain the editable graph with accurate data, an excel table with the actual data, the exact source of the data and the release date. This slide shows McDonalds Corporation Company Franchise Margin for the Canada Region in 2018 . Download it immediately and use it for your business.
-
 Mcdonalds corporation fixed assets 2014-18
This is a professionally designed visual chart for Mcdonalds Corporation Fixed Assets 2014-18. This is part of our Data and Statistics products selection, and you will need a Paid account to download the actual report with accurate data and sources. Downloaded report will contain the editable graph with accurate data, an excel table with the actual data, the exact source of the data and the release date. This slide shows McDonalds Corporation Fixed Assets from the years 2014 to 2018. Download it immediately and use it for your business.
-
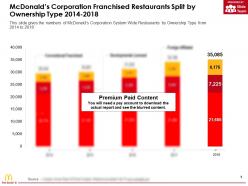 Mcdonalds corporation franchised restaurants split by ownership type 2014-2018
This is a professionally designed visual chart for Mcdonalds Corporation Franchised Restaurants Split By Ownership Type 2014-2018. This is part of our Data and Statistics products selection, and you will need a Paid account to download the actual report with accurate data and sources. Downloaded report will contain the editable graph with accurate data, an excel table with the actual data, the exact source of the data and the release date. This slide gives the numbers of McDonalds Corporation System Wide Restaurants by Ownership Type from 2014 to 2018. Download it immediately and use it for your business.
-
 Mcdonalds corporation investments in ppe 2014-18
This is a professionally designed visual chart for Mcdonalds Corporation Investments In PPE 2014-18. This is part of our Data and Statistics products selection, and you will need a Paid account to download the actual report with accurate data and sources. Downloaded report will contain the editable graph with accurate data, an excel table with the actual data, the exact source of the data and the release date. This slide shows McDonalds Corporation PPE Investments from the years 2014 to 2018. Download it immediately and use it for your business.
-
 Mcdonalds corporation key ratios 2014-18
This is a professionally designed visual chart for Mcdonalds Corporation Key Ratios 2014-18. This is part of our Data and Statistics products selection, and you will need a Paid account to download the actual report with accurate data and sources. Downloaded report will contain the editable graph with accurate data, an excel table with the actual data, the exact source of the data and the release date. This slide provides a table of key ratios Current ratio, interest coverage ratio, Return on Equity, Return on Assets, Asset Turnover Ratio etc. of McDonalds Corporation for the years 2014 to 18. Download it immediately and use it for your business.
-
 Mcdonalds corporation liabilities and shareholder equity 2014-18
This is a professionally designed visual chart for Mcdonalds Corporation Liabilities And Shareholder Equity 2014-18. This is part of our Data and Statistics products selection, and you will need a Paid account to download the actual report with accurate data and sources. Downloaded report will contain the editable graph with accurate data, an excel table with the actual data, the exact source of the data and the release date. This slide shows McDonalds Corporation Liabilities and Shareholder Equity from the years 2014 to 2018. Download it immediately and use it for your business.
-
 Mcdonalds corporation long term debt 2014-18
This is a professionally designed visual chart for Mcdonalds Corporation Long Term Debt 2014-18. This is part of our Data and Statistics products selection, and you will need a Paid account to download the actual report with accurate data and sources. Downloaded report will contain the editable graph with accurate data, an excel table with the actual data, the exact source of the data and the release date. This slide shows McDonalds Corporation Long Term Debts from the years 2014 to 2018. Download it immediately and use it for your business.
-
 Mcdonalds corporation major competitors comparison 2018
This is a professionally designed visual chart for Mcdonalds Corporation Major Competitors Comparison 2018. This is part of our Data and Statistics products selection, and you will need a Paid account to download the actual report with accurate data and sources. Downloaded report will contain the editable graph with accurate data, an excel table with the actual data, the exact source of the data and the release date. This slide provides McDonalds Corporation comparison with Key Competitors Yum Brand, Inc Papa Johns and Dominos Pizza, Inc on the basis of 2018 Financials, in JPY MM Revenue, Operating Income and Margin, Employees, store count etc. Download it immediately and use it for your business.
-
 Mcdonalds corporation market capitalization 2014-2018
This is a professionally designed visual chart for Mcdonalds Corporation Market Capitalization 2014-2018. This is part of our Data and Statistics products selection, and you will need a Paid account to download the actual report with accurate data and sources. Downloaded report will contain the editable graph with accurate data, an excel table with the actual data, the exact source of the data and the release date. This slide shows McDonalds Corporation Market Capitalization from the years 2014 to 2018 As of December in each year. Download it immediately and use it for your business.
No Reviews


