Consumer Goods and FMCG Data Statistics PowerPoint Templates, PowerPoint Statistics Slides
- Sub Categories
-
- Agriculture
- Chemicals and Resources
- Construction
- Consumer Goods and FMCG
- E-Commerce
- Energy and Environmental Services
- Finance Insurance and Real Estate
- Health and Pharmaceuticals
- Internet
- Life
- Media and Advertising
- Metals and Electronics
- Retail and Trade
- Services
- Society
- Sports and Recreation
- Survey
- Technology and Telecommunications
- Transportation and Logistics
- Travel Tourism and Hospitality
- USA
-
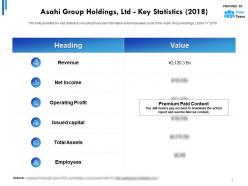 Asahi group holdings ltd key statistics 2018
The information presented in this slide has been researched by our team of professional business analysts. This is part of our Company Profiles products selection, and you will need a Paid account to download the actual report with accurate data and sources. Downloaded report will be in Powerpoint and will contain the actual editable slides with the actual data and sources for each data. This slide provides the Key Statistics including financials information and employees count of the Asahi Group Holdings, Ltd for FY 2018. Download it immediately and use it for your business.
-
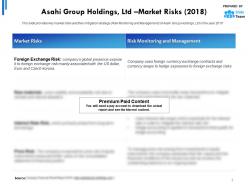 Asahi group holdings ltd market risks 2018
The information presented in this slide has been researched by our team of professional business analysts. This is part of our Company Profiles products selection, and you will need a Paid account to download the actual report with accurate data and sources. Downloaded report will be in Powerpoint and will contain the actual editable slides with the actual data and sources for each data. This slide provides key market risks and their mitigation strategy Risk Monitoring and Management of Asahi Group Holdings, Ltd in the year 2018. Download it immediately and use it for your business.
-
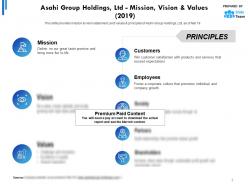 Asahi group holdings ltd mission vision and values 2019
The information presented in this slide has been researched by our team of professional business analysts. This is part of our Company Profiles products selection, and you will need a Paid account to download the actual report with accurate data and sources. Downloaded report will be in Powerpoint and will contain the actual editable slides with the actual data and sources for each data. This slide provides mission and vision statement and values and principles of Asahi Group Holdings, Ltd as of Mar19. Download it immediately and use it for your business.
-
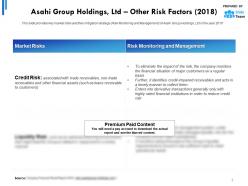 Asahi group holdings ltd other risk factors 2018
The information presented in this slide has been researched by our team of professional business analysts. This is part of our Company Profiles products selection, and you will need a Paid account to download the actual report with accurate data and sources. Downloaded report will be in Powerpoint and will contain the actual editable slides with the actual data and sources for each data. This slide provides key market risks and their mitigation strategy Risk Monitoring and Management of Asahi Group Holdings, Ltd in the year 2018. Download it immediately and use it for your business.
-
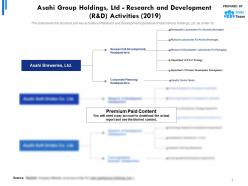 Asahi group holdings ltd research and development r and d activities 2019
The information presented in this slide has been researched by our team of professional business analysts. This is part of our Company Profiles products selection, and you will need a Paid account to download the actual report with accurate data and sources. Downloaded report will be in Powerpoint and will contain the actual editable slides with the actual data and sources for each data. This slide shows the structure and key activities of Research and Development operations of Asahi Group Holdings, Ltd as of Mar19. Download it immediately and use it for your business.
-
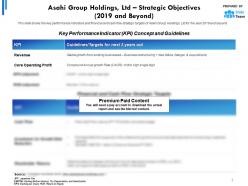 Asahi group holdings ltd strategic objectives 2019 and beyond
The information presented in this slide has been researched by our team of professional business analysts. This is part of our Company Profiles products selection, and you will need a Paid account to download the actual report with accurate data and sources. Downloaded report will be in Powerpoint and will contain the actual editable slides with the actual data and sources for each data. This slide shows the key performance indicators and financial and cash flow strategic targets of Asahi Group Holdings, Ltd for the year 2019 and beyond. Download it immediately and use it for your business.
-
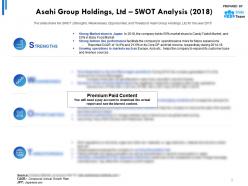 Asahi group holdings ltd swot analysis 2018
The information presented in this slide has been researched by our team of professional business analysts. This is part of our Company Profiles products selection, and you will need a Paid account to download the actual report with accurate data and sources. Downloaded report will be in Powerpoint and will contain the actual editable slides with the actual data and sources for each data. This slide shows the SWOT Strengths, Weaknesses, Opportunities, and Threats of Asahi Group Holdings, Ltd for the year 2018. Download it immediately and use it for your business.
-
 Pepsico brands 2018
The information presented in this slide has been researched by our team of professional business analysts. This is part of our Company Profiles products selection, and you will need a Paid account to download the actual report with accurate data and sources. Downloaded report will be in Powerpoint and will contain the actual editable slides with the actual data and sources for each data. This slide depicts the brands of PepsiCo and its subsidiaries in 2018. Download it immediately and use it for your business.
-
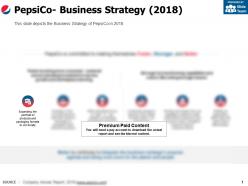 Pepsico business strategy 2018
The information presented in this slide has been researched by our team of professional business analysts. This is part of our Company Profiles products selection, and you will need a Paid account to download the actual report with accurate data and sources. Downloaded report will be in Powerpoint and will contain the actual editable slides with the actual data and sources for each data. This slide depicts the Business Strategy of PepsiCo in 2018. Download it immediately and use it for your business.
-
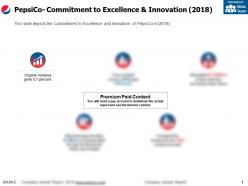 Pepsico commitment to excellence and innovation 2018
The information presented in this slide has been researched by our team of professional business analysts. This is part of our Company Profiles products selection, and you will need a Paid account to download the actual report with accurate data and sources. Downloaded report will be in Powerpoint and will contain the actual editable slides with the actual data and sources for each data. This slide depicts the Commitment to Excellence and Innovation of PepsiCo in 2018. Download it immediately and use it for your business.
-
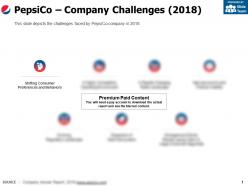 Pepsico company challenges 2018
The information presented in this slide has been researched by our team of professional business analysts. This is part of our Company Profiles products selection, and you will need a Paid account to download the actual report with accurate data and sources. Downloaded report will be in Powerpoint and will contain the actual editable slides with the actual data and sources for each data. This slide depicts the challenges faced by PepsiCo company in 2018. Download it immediately and use it for your business.
-
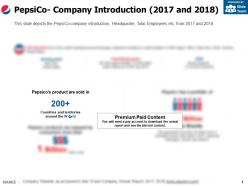 Pepsico company introduction 2017 and 2018
The information presented in this slide has been researched by our team of professional business analysts. This is part of our Company Profiles products selection, and you will need a Paid account to download the actual report with accurate data and sources. Downloaded report will be in Powerpoint and will contain the actual editable slides with the actual data and sources for each data. This slide depicts the PepsiCo company introduction, Headquarter, Total Employees etc. from 2017 to 2018. Download it immediately and use it for your business.
-
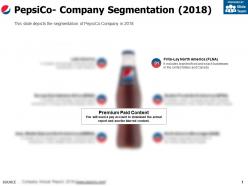 Pepsico company segmentation 2018
The information presented in this slide has been researched by our team of professional business analysts. This is part of our Company Profiles products selection, and you will need a Paid account to download the actual report with accurate data and sources. Downloaded report will be in Powerpoint and will contain the actual editable slides with the actual data and sources for each data. This slide depicts the segmentation of PepsiCo Company in 2018. Download it immediately and use it for your business.
-
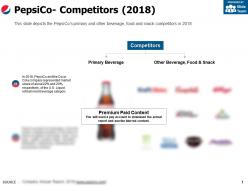 Pepsico competitors 2018
The information presented in this slide has been researched by our team of professional business analysts. This is part of our Company Profiles products selection, and you will need a Paid account to download the actual report with accurate data and sources. Downloaded report will be in Powerpoint and will contain the actual editable slides with the actual data and sources for each data. This slide depicts the PepsiCos primary and other beverage, food and snack competitors in 2018. Download it immediately and use it for your business.
-
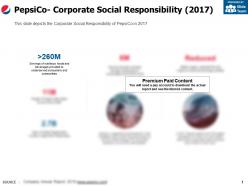 Pepsico corporate social responsibility 2017
The information presented in this slide has been researched by our team of professional business analysts. This is part of our Company Profiles products selection, and you will need a Paid account to download the actual report with accurate data and sources. Downloaded report will be in Powerpoint and will contain the actual editable slides with the actual data and sources for each data. This slide depicts the Corporate Social Responsibility of PepsiCo in 2017. Download it immediately and use it for your business.
-
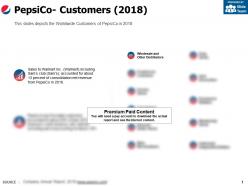 Pepsico customers 2018
The information presented in this slide has been researched by our team of professional business analysts. This is part of our Company Profiles products selection, and you will need a Paid account to download the actual report with accurate data and sources. Downloaded report will be in Powerpoint and will contain the actual editable slides with the actual data and sources for each data. This slides depicts the Worldwide Customers of PepsiCo in 2018. Download it immediately and use it for your business.
-
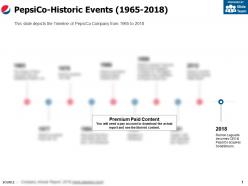 Pepsico historic events 1965-2018
The information presented in this slide has been researched by our team of professional business analysts. This is part of our Company Profiles products selection, and you will need a Paid account to download the actual report with accurate data and sources. Downloaded report will be in Powerpoint and will contain the actual editable slides with the actual data and sources for each data. This slide depicts the Timeline of PepsiCo Company from 1965 to 2018. Download it immediately and use it for your business.
-
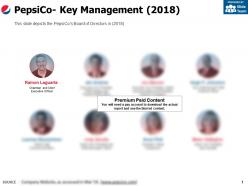 Pepsico key management 2018
The information presented in this slide has been researched by our team of professional business analysts. This is part of our Company Profiles products selection, and you will need a Paid account to download the actual report with accurate data and sources. Downloaded report will be in Powerpoint and will contain the actual editable slides with the actual data and sources for each data. This slide depicts the PepsiCos Board of Directors in 2018. Download it immediately and use it for your business.
-
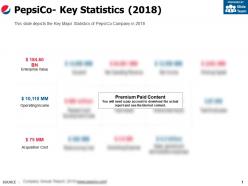 Pepsico key statistics 2018
The information presented in this slide has been researched by our team of professional business analysts. This is part of our Company Profiles products selection, and you will need a Paid account to download the actual report with accurate data and sources. Downloaded report will be in Powerpoint and will contain the actual editable slides with the actual data and sources for each data. This slide depicts the Key Major Statistics of PepsiCo Company in 2018. Download it immediately and use it for your business.
-
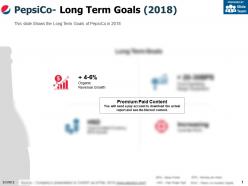 Pepsico long term goals 2018
The information presented in this slide has been researched by our team of professional business analysts. This is part of our Company Profiles products selection, and you will need a Paid account to download the actual report with accurate data and sources. Downloaded report will be in Powerpoint and will contain the actual editable slides with the actual data and sources for each data. This slide Shows the Long Term Goals of PepsiCo in 2018. Download it immediately and use it for your business.
-
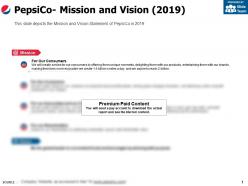 Pepsico mission and vision 2019
The information presented in this slide has been researched by our team of professional business analysts. This is part of our Company Profiles products selection, and you will need a Paid account to download the actual report with accurate data and sources. Downloaded report will be in Powerpoint and will contain the actual editable slides with the actual data and sources for each data. This slide depicts the Mission and Vision Statement of PepsiCo in 2019. Download it immediately and use it for your business.
-
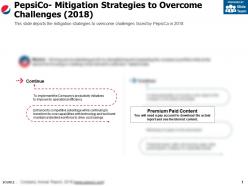 Pepsico mitigation strategies to overcome challenges 2018
The information presented in this slide has been researched by our team of professional business analysts. This is part of our Company Profiles products selection, and you will need a Paid account to download the actual report with accurate data and sources. Downloaded report will be in Powerpoint and will contain the actual editable slides with the actual data and sources for each data. This slide depicts the mitigation strategies to overcome challenges faced by PepsiCo in 2018. Download it immediately and use it for your business.
-
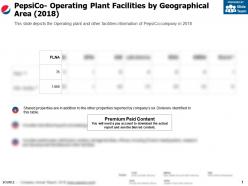 Pepsico operating plant facilities by geographical area 2018
The information presented in this slide has been researched by our team of professional business analysts. This is part of our Company Profiles products selection, and you will need a Paid account to download the actual report with accurate data and sources. Downloaded report will be in Powerpoint and will contain the actual editable slides with the actual data and sources for each data. This slide depicts the Operating plant and other facilities information of PepsiCo company in 2018. Download it immediately and use it for your business.
-
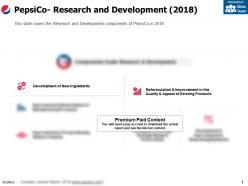 Pepsico research and development 2018
The information presented in this slide has been researched by our team of professional business analysts. This is part of our Company Profiles products selection, and you will need a Paid account to download the actual report with accurate data and sources. Downloaded report will be in Powerpoint and will contain the actual editable slides with the actual data and sources for each data. This slide covers the Research and Development components of PepsiCo in 2018. Download it immediately and use it for your business.
-
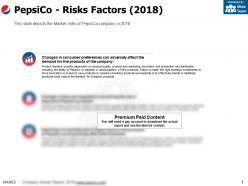 Pepsico risks factors 2018
The information presented in this slide has been researched by our team of professional business analysts. This is part of our Company Profiles products selection, and you will need a Paid account to download the actual report with accurate data and sources. Downloaded report will be in Powerpoint and will contain the actual editable slides with the actual data and sources for each data. This slide depicts the Market risks of PepsiCo company in 2018. Download it immediately and use it for your business.
-
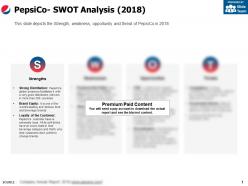 Pepsico swot analysis 2018
The information presented in this slide has been researched by our team of professional business analysts. This is part of our Company Profiles products selection, and you will need a Paid account to download the actual report with accurate data and sources. Downloaded report will be in Powerpoint and will contain the actual editable slides with the actual data and sources for each data. This slide depicts the Strength, weakness, opportunity and threat of PepsiCo in 2018. Download it immediately and use it for your business.
-
 Pepsico cash and cash equivalents 2014-2018
This is a professionally designed visual chart for Pepsico Cash And Cash Equivalents 2014 to 2018. This is part of our Data and Statistics products selection, and you will need a Paid account to download the actual report with accurate data and sources. Downloaded report will contain the editable graph with accurate data, an excel table with the actual data, the exact source of the data and the release date. This slide depicts the Net Cash and Cash Equivalents of PepsiCo Inc. and Subsidiaries at the end of year from 2014 to 2018 In Millions JPY. Download it immediately and use it for your business.
-
 Pepsico cash provided by operating activities 2014-2018
This is a professionally designed visual chart for Pepsico Cash Provided By Operating Activities 2014-2018. This is part of our Data and Statistics products selection, and you will need a Paid account to download the actual report with accurate data and sources. Downloaded report will contain the editable graph with accurate data, an excel table with the actual data, the exact source of the data and the release date. This slide depicts the Net Cash Provided by Operating Activities in PepsiCo Inc. and Subsidiaries from 2014 to 2018 In Millions JPY. Download it immediately and use it for your business.
-
 Pepsico cash used for financing activities 2014-2018
This is a professionally designed visual chart for Pepsico Cash Used For Financing Activities 2014 to 2018. This is part of our Data and Statistics products selection, and you will need a Paid account to download the actual report with accurate data and sources. Downloaded report will contain the editable graph with accurate data, an excel table with the actual data, the exact source of the data and the release date. This slide depicts the Net Cash Used for Financing Activities in PepsiCo Inc. and Subsidiaries from 2014 to 2018 In Millions JPY. Download it immediately and use it for your business.
-
 Pepsico cash used for investing activities 2014-2018
This is a professionally designed visual chart for Pepsico Cash Used For Investing Activities 2014 to 2018. This is part of our Data and Statistics products selection, and you will need a Paid account to download the actual report with accurate data and sources. Downloaded report will contain the editable graph with accurate data, an excel table with the actual data, the exact source of the data and the release date. This slide depicts the Cash Used for Investing Activities in PepsiCo Inc. and Subsidiaries from 2014 to 2018 In Millions JPY. Download it immediately and use it for your business.
-
 Pepsico common shareholders equity 2014-2018
This is a professionally designed visual chart for Pepsico Common Shareholders Equity 2014 to 2018. This is part of our Data and Statistics products selection, and you will need a Paid account to download the actual report with accurate data and sources. Downloaded report will contain the editable graph with accurate data, an excel table with the actual data, the exact source of the data and the release date. This slide Depicts the Total Common Shareholders Equity in PepsiCo from 2014 to 2018 In Millions JPY. Download it immediately and use it for your business.
-
 Pepsico comparison with key competitors 2018
This is a professionally designed visual chart for Pepsico Comparison With Key Competitors 2018. This is part of our Data and Statistics products selection, and you will need a Paid account to download the actual report with accurate data and sources. Downloaded report will contain the editable graph with accurate data, an excel table with the actual data, the exact source of the data and the release date. This slide covers the comparison between top beverage companys revenue, Operating Profit, Total employees, SGA in 2018. Download it immediately and use it for your business.
-
 Pepsico cost of sales 2014-2018
This is a professionally designed visual chart for Pepsico Cost Of Sales 2014 to 2018. This is part of our Data and Statistics products selection, and you will need a Paid account to download the actual report with accurate data and sources. Downloaded report will contain the editable graph with accurate data, an excel table with the actual data, the exact source of the data and the release date. This slide depicts the Cost of Sales of PepsiCo Inc. and Subsidiaries from 2014 to 2018 In Millions JPY. Download it immediately and use it for your business.
-
 Pepsico enterprise value 2015-2019
This is a professionally designed visual chart for Pepsico Enterprise Value 2015 to 2019. This is part of our Data and Statistics products selection, and you will need a Paid account to download the actual report with accurate data and sources. Downloaded report will contain the editable graph with accurate data, an excel table with the actual data, the exact source of the data and the release date. This slide depicts the Enterprise Value of PepsiCo from 2015 to 2019 in billions JPY. Download it immediately and use it for your business.
-
 Pepsico financial highlights 2018
This is a professionally designed visual chart for Pepsico Financial Highlights 2018. This is part of our Data and Statistics products selection, and you will need a Paid account to download the actual report with accurate data and sources. Downloaded report will contain the editable graph with accurate data, an excel table with the actual data, the exact source of the data and the release date. This slide depicts the Financial Highlights net revenue and Operating Profit by Division in 2018. Download it immediately and use it for your business.
-
 Pepsico fixed assets 2014-2018
This is a professionally designed visual chart for Pepsico Fixed Assets 2014 to 2018. This is part of our Data and Statistics products selection, and you will need a Paid account to download the actual report with accurate data and sources. Downloaded report will contain the editable graph with accurate data, an excel table with the actual data, the exact source of the data and the release date. This slide depicts the Fixed Assets of PepsiCo from 2014 to 2018 in millions JPY. Download it immediately and use it for your business.
-
 Pepsico gross profit 2014-2018
This is a professionally designed visual chart for Pepsico Gross Profit 2014 to 2018. This is part of our Data and Statistics products selection, and you will need a Paid account to download the actual report with accurate data and sources. Downloaded report will contain the editable graph with accurate data, an excel table with the actual data, the exact source of the data and the release date. This slide depicts the Gross Profit with margin of PepsiCo Inc. and Subsidiaries from 2014 to 2018 In Millions JPY. Download it immediately and use it for your business.
-
 Pepsico investment in property plant and equipment 2014-2018
This is a professionally designed visual chart for Pepsico Investment In Property Plant And Equipment 2014 to 2018. This is part of our Data and Statistics products selection, and you will need a Paid account to download the actual report with accurate data and sources. Downloaded report will contain the editable graph with accurate data, an excel table with the actual data, the exact source of the data and the release date. This slide depicts the Net Investment in Property Plant and Equipment of PepsiCo Inc. and Subsidiaries from 2014 to 2018 In Millions JPY. Download it immediately and use it for your business.
-
 Pepsico key ratios 2014-18
This is a professionally designed visual chart for Pepsico Key Ratios 2014 to 18. This is part of our Data and Statistics products selection, and you will need a Paid account to download the actual report with accurate data and sources. Downloaded report will contain the editable graph with accurate data, an excel table with the actual data, the exact source of the data and the release date. This slide provides a table of key ratios Current ratio, interest coverage ratio, Return on Assets, Asset Turnover Ratio etc. of PepsiCo company for the years 2014 to 18. Download it immediately and use it for your business.
-
 Pepsico long term liabilities 2014-2018
This is a professionally designed visual chart for Pepsico Long Term Liabilities 2014 to 2018. This is part of our Data and Statistics products selection, and you will need a Paid account to download the actual report with accurate data and sources. Downloaded report will contain the editable graph with accurate data, an excel table with the actual data, the exact source of the data and the release date. This slide depicts the Long Term Liabilities of PepsiCo from 2014 to 2018 in millions JPY. Download it immediately and use it for your business.
-
 Pepsico net income worldwide 2014-2018
This is a professionally designed visual chart for Pepsico Net Income Worldwide 2014 to 2018. This is part of our Data and Statistics products selection, and you will need a Paid account to download the actual report with accurate data and sources. Downloaded report will contain the editable graph with accurate data, an excel table with the actual data, the exact source of the data and the release date. This slide depicts the Worldwide Net Income with Margin of PepsiCo Inc. and Subsidiaries from 2014 to 2018 in million U.S dollars. Download it immediately and use it for your business.
-
 Pepsico net revenue 2014-2018
This is a professionally designed visual chart for Pepsico Net Revenue 2014 to 2018. This is part of our Data and Statistics products selection, and you will need a Paid account to download the actual report with accurate data and sources. Downloaded report will contain the editable graph with accurate data, an excel table with the actual data, the exact source of the data and the release date. This slide depicts the Worldwide Net Revenue of PepsiCo Company from 2014 to 2018 In million U.S dollars. Download it immediately and use it for your business.
-
 Pepsico net revenue and operating profit of amena division 2014-2018
This is a professionally designed visual chart for Pepsico Net Revenue And Operating Profit Of Amena Division 2014 to 2018. This is part of our Data and Statistics products selection, and you will need a Paid account to download the actual report with accurate data and sources. Downloaded report will contain the editable graph with accurate data, an excel table with the actual data, the exact source of the data and the release date. This slide depicts the Net Revenue and Operating Profit of AMENA Division Asia, Middle East and North Africa of PepsiCo from 2014 to 2018 In Millions JPY. Download it immediately and use it for your business.
-
 Pepsico net revenue and operating profit of essa division 2014-2018
This is a professionally designed visual chart for Pepsico Net Revenue And Operating Profit Of Essa Division 2014 to 2018. This is part of our Data and Statistics products selection, and you will need a Paid account to download the actual report with accurate data and sources. Downloaded report will contain the editable graph with accurate data, an excel table with the actual data, the exact source of the data and the release date. This slide depicts the Net Revenue and Operating Profit of ESSA Division Europe Sub-Saharan Africa in PepsiCo from 2014 to 2018 In Millions JPY. Download it immediately and use it for your business.
-
 Pepsico net revenue and operating profit of flna division 2014-2018
This is a professionally designed visual chart for Pepsico Net Revenue And Operating Profit Of Flna Division 2014 to 2018. This is part of our Data and Statistics products selection, and you will need a Paid account to download the actual report with accurate data and sources. Downloaded report will contain the editable graph with accurate data, an excel table with the actual data, the exact source of the data and the release date. This slide depicts the Net Revenue and Operating Profit of FLNA Division Frito-Lay North America in PepsiCo from 2014 to 2018 In Millions JPY. Download it immediately and use it for your business.
-
 Pepsico net revenue and operating profit of latin america division 2014-2018
This is a professionally designed visual chart for Pepsico Net Revenue And Operating Profit Of Latin America Division 2014 to 2018. This is part of our Data and Statistics products selection, and you will need a Paid account to download the actual report with accurate data and sources. Downloaded report will contain the editable graph with accurate data, an excel table with the actual data, the exact source of the data and the release date. This slide depicts the Net Revenue and Operating Profit of Latin America Division in PepsiCo from 2014 to 2018 In Millions JPY. Download it immediately and use it for your business.
-
 Pepsico net revenue and operating profit of nab division 2014-2018
This is a professionally designed visual chart for Pepsico Net Revenue And Operating Profit Of Nab Division 2014 to 2018. This is part of our Data and Statistics products selection, and you will need a Paid account to download the actual report with accurate data and sources. Downloaded report will contain the editable graph with accurate data, an excel table with the actual data, the exact source of the data and the release date. This slide depicts the Net Revenue and Operating Profit of NAB Division North America Beverages in PepsiCo from 2014 to 2018 In Millions JPY. Download it immediately and use it for your business.
-
 Pepsico net revenue and operating profit of qfna division 2014-2018
This is a professionally designed visual chart for Pepsico Net Revenue And Operating Profit Of Qfna Division 2014 to 2018. This is part of our Data and Statistics products selection, and you will need a Paid account to download the actual report with accurate data and sources. Downloaded report will contain the editable graph with accurate data, an excel table with the actual data, the exact source of the data and the release date. This slide depicts the Net Revenue and Operating Profit of QFNA Division Quaker Foods North America in PepsiCo from 2014 to 2018 In Millions JPY. Download it immediately and use it for your business.
-
 Pepsico net revenue by division 2014-2018
This is a professionally designed visual chart for Pepsico Net Revenue By Division 2014 to 2018. This is part of our Data and Statistics products selection, and you will need a Paid account to download the actual report with accurate data and sources. Downloaded report will contain the editable graph with accurate data, an excel table with the actual data, the exact source of the data and the release date. This slide depicts the Worldwide Net Revenue of PepsiCo Company by Division from 2014 to 2018 In billion JPY. Download it immediately and use it for your business.
-
 Pepsico operating profit share by division 2018
This is a professionally designed visual chart for Pepsico Operating Profit Share By Division 2018. This is part of our Data and Statistics products selection, and you will need a Paid account to download the actual report with accurate data and sources. Downloaded report will contain the editable graph with accurate data, an excel table with the actual data, the exact source of the data and the release date. This slide depicts the Operating Profit share of PepsiCo company Worldwide by Division in 2018. Download it immediately and use it for your business.
-
 Pepsico operating profit worldwide 2014-2018
This is a professionally designed visual chart for Pepsico Operating Profit Worldwide 2014 to 2018. This is part of our Data and Statistics products selection, and you will need a Paid account to download the actual report with accurate data and sources. Downloaded report will contain the editable graph with accurate data, an excel table with the actual data, the exact source of the data and the release date. This slide depicts the Operating Profit with margin of PepsiCo Worldwide from 2014 to 2018 in millions JPY. Download it immediately and use it for your business.
-
 Pepsico research and development cost 2014-2018
This is a professionally designed visual chart for Pepsico Research And Development Cost 2014 to 2018. This is part of our Data and Statistics products selection, and you will need a Paid account to download the actual report with accurate data and sources. Downloaded report will contain the editable graph with accurate data, an excel table with the actual data, the exact source of the data and the release date. This slide depicts the PepsiCos Research and Development costs Worldwide from 2014 to 2018 in million U.S dollars. Download it immediately and use it for your business.
-
 Pepsico sga and advertising expenses worldwide 2014-2018
This is a professionally designed visual chart for Pepsico Sga And Advertising Expenses Worldwide 2014 to 2018. This is part of our Data and Statistics products selection, and you will need a Paid account to download the actual report with accurate data and sources. Downloaded report will contain the editable graph with accurate data, an excel table with the actual data, the exact source of the data and the release date. This slide depicts the PepsiCos Selling, general and administrative expenses and advertising expenses worldwide from 2014 to 2018 in billion U.S dollars. Download it immediately and use it for your business.
-
 Pepsico top beverage companies operating income comparison 2018
This is a professionally designed visual chart for Pepsico Top Beverage Companies Operating Income Comparison 2018. This is part of our Data and Statistics products selection, and you will need a Paid account to download the actual report with accurate data and sources. Downloaded report will contain the editable graph with accurate data, an excel table with the actual data, the exact source of the data and the release date. This slide depicts the Operating income comparison of top beverage companies in 2018 in millions JPY. Download it immediately and use it for your business.
-
 Pepsico top beverage companies revenue comparison 2018
This is a professionally designed visual chart forPepsico Top Beverage Companies Revenue Comparison 2018. This is part of our Data and Statistics products selection, and you will need a Paid account to download the actual report with accurate data and sources. Downloaded report will contain the editable graph with accurate data, an excel table with the actual data, the exact source of the data and the release date. This slide depicts the Total Revenue of beverage companies in 2018. Download it immediately and use it for your business.
-
 Pepsico top beverage companies sga expenses comparison 2018
This is a professionally designed visual chart for Pepsico Top Beverage Companies SGA Expenses Comparison 2018. This is part of our Data and Statistics products selection, and you will need a Paid account to download the actual report with accurate data and sources. Downloaded report will contain the editable graph with accurate data, an excel table with the actual data, the exact source of the data and the release date. This slide covers the Selling, General and Administrative Expenses comparison of top beverage companies in 2018 in millions JPY. Download it immediately and use it for your business.
-
 Pepsico total assets 2014-2018
This is a professionally designed visual chart for Pepsico Total Assets 2014 to 2018. This is part of our Data and Statistics products selection, and you will need a Paid account to download the actual report with accurate data and sources. Downloaded report will contain the editable graph with accurate data, an excel table with the actual data, the exact source of the data and the release date. This slide depicts the Total Assets of PepsiCo from 2014 to 2018 In Millions JPY. Download it immediately and use it for your business.
-
 Pepsico total current assets 2014-2018
This is a professionally designed visual chart for Pepsico Total Current Assets 2014 to 2018. This is part of our Data and Statistics products selection, and you will need a Paid account to download the actual report with accurate data and sources. Downloaded report will contain the editable graph with accurate data, an excel table with the actual data, the exact source of the data and the release date. This slide depicts the Total Current Assets of PepsiCo from 2014 to 2018 In Millions JPY. Download it immediately and use it for your business.
-
 Pepsico total current liabilities 2014-2018
This is a professionally designed visual chart for Pepsico Total Current Liabilities 2014 to 2018. This is part of our Data and Statistics products selection, and you will need a Paid account to download the actual report with accurate data and sources. Downloaded report will contain the editable graph with accurate data, an excel table with the actual data, the exact source of the data and the release date. This slide depicts the Total Current Liabilities of PepsiCo from 2014 to 2018 In Millions JPY. Download it immediately and use it for your business.
-
 Pepsico total liabilities 2014-2018
This is a professionally designed visual chart for Pepsico Total Liabilities 2014 to 2018. This is part of our Data and Statistics products selection, and you will need a Paid account to download the actual report with accurate data and sources. Downloaded report will contain the editable graph with accurate data, an excel table with the actual data, the exact source of the data and the release date. This Slide depicts the Total Liabilities of PepsiCo from 2014 to 2018 In Millions JPY. Download it immediately and use it for your business.
No Reviews


