Powerpoint Templates and Google slides for Visualizing Data
Save Your Time and attract your audience with our fully editable PPT Templates and Slides.
-
 Data Visualization Powerpoint Presentation Slides
Enthrall your audience with this Data Visualization Powerpoint Presentation Slides. Increase your presentation threshold by deploying this well-crafted template. It acts as a great communication tool due to its well-researched content. It also contains stylized icons, graphics, visuals etc, which make it an immediate attention-grabber. Comprising fourty seven slides, this complete deck is all you need to get noticed. All the slides and their content can be altered to suit your unique business setting. Not only that, other components and graphics can also be modified to add personal touches to this prefabricated set.
-
 Data Visualizations Playbook Powerpoint Presentation Slides
This complete presentation has PPT slides on wide range of topics highlighting the core areas of your business needs. It has professionally designed templates with relevant visuals and subject driven content. This presentation deck has total of fourty slides. Get access to the customizable templates. Our designers have created editable templates for your convenience. You can edit the color, text and font size as per your need. You can add or delete the content if required. You are just a click to away to have this ready-made presentation. Click the download button now.
-
 Data Visualizations Playbook Report Sample Example Document
This is a complete deck titled Data Visualizations Playbook Report Sample Example Document. It is crafted using high-quality visuals that can be readjusted in PowerPoint and Google Slides. This template comes in an editable format and is available in A4 size format for immediate download.
-
 Data Tools Processing Model Visualization Layer Security Segment
Deliver a lucid presentation by utilizing this Data Tools Processing Model Visualization Layer Security Segment. Use it to present an overview of the topic with the right visuals, themes, shapes, and graphics. This is an expertly designed complete deck that reinforces positive thoughts and actions. Use it to provide visual cues to your audience and help them make informed decisions. A wide variety of discussion topics can be covered with this creative bundle such as Processing Model, Visualization Layer, Security Segment. All the twenty nine slides are available for immediate download and use. They can be edited and modified to add a personal touch to the presentation. This helps in creating a unique presentation every time. Not only that, with a host of editable features, this presentation can be used by any industry or business vertical depending on their needs and requirements. The compatibility with Google Slides is another feature to look out for in the PPT slideshow.
-
 Data Visualization Powerpoint Ppt Template Bundles
Introduce your topic and host expert discussion sessions with this Data Visualization Powerpoint Ppt Template Bundles. This template is designed using high-quality visuals, images, graphics, etc, that can be used to showcase your expertise. Different topics can be tackled using the twenty slides included in this template. You can present each topic on a different slide to help your audience interpret the information more effectively. Apart from this, this PPT slideshow is available in two screen sizes, standard and widescreen making its delivery more impactful. This will not only help in presenting a birds-eye view of the topic but also keep your audience engaged. Since this PPT slideshow utilizes well-researched content, it induces strategic thinking and helps you convey your message in the best possible manner. The biggest feature of this design is that it comes with a host of editable features like color, font, background, etc. So, grab it now to deliver a unique presentation every time.
-
 IOT Data Visualization Powerpoint Ppt Template Bundles
Engage buyer personas and boost brand awareness by pitching yourself using this prefabricated set. This IOT Data Visualization Powerpoint Ppt Template Bundles is a great tool to connect with your audience as it contains high-quality content and graphics. This helps in conveying your thoughts in a well-structured manner. It also helps you attain a competitive advantage because of its unique design and aesthetics. In addition to this, you can use this PPT design to portray information and educate your audience on various topics. With Twelve slides, this is a great design to use for your upcoming presentations. Not only is it cost-effective but also easily pliable depending on your needs and requirements. As such color, font, or any other design component can be altered. It is also available for immediate download in different formats such as PNG, JPG, etc. So, without any further ado, download it now.
-
 Bigdata analytics visualization techniques technologies sources monitoring data
It has PPT slides covering wide range of topics showcasing all the core areas of your business needs. This complete deck focuses on Bigdata Analytics Visualization Techniques Technologies Sources Monitoring Data and consists of professionally designed templates with suitable graphics and appropriate content. This deck has total of twelve slides. Our designers have created customizable templates for your convenience. You can make the required changes in the templates like colour, text and font size. Other than this, content can be added or deleted from the slide as per the requirement. Get access to this professionally designed complete deck PPT presentation by clicking the download button below.
-
 Data Analysis Business Evaluation Process Visualization Presentation
Deliver a credible and compelling presentation by deploying this Data Analysis Business Evaluation Process Visualization Presentation. Intensify your message with the right graphics, images, icons, etc. presented in this complete deck. This PPT template is a great starting point to convey your messages and build a good collaboration. The twelve slides added to this PowerPoint slideshow helps you present a thorough explanation of the topic. You can use it to study and present various kinds of information in the form of stats, figures, data charts, and many more. This Data Analysis Business Evaluation Process Visualization Presentation PPT slideshow is available for use in standard and widescreen aspects ratios. So, you can use it as per your convenience. Apart from this, it can be downloaded in PNG, JPG, and PDF formats, all completely editable and modifiable. The most profound feature of this PPT design is that it is fully compatible with Google Slides making it suitable for every industry and business domain.
-
 Business process flow chart example visualization of data analysis 6 stages powerpoint slides
We are proud to present our business process flow chart example visualization of data analysis 6 stages powerpoint slides. The above PowerPoint diagram demonstrates distribution of data. Use this diagram for business activity results, financial report, and demographic analysis. Our PPTs offer you the needful to organize your thoughts. Use them to list out your views in a logical sequence.
-
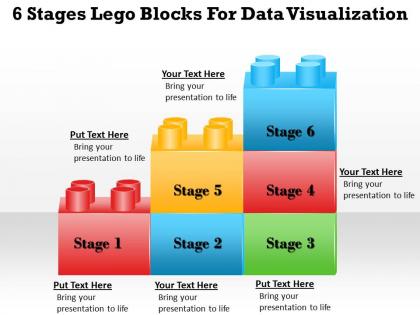 1013 business ppt diagram 6 stages lego blocks for data visualization powerpoint template
We are proud to present our 1013 business ppt diagram 6 stages lego blocks for data visualization powerpoint template. You Have All The Ingredients To Create The Taste Of Success. Garnish Your Recipe With Our Concepts Power Point Templates And Enhance Its Flavor. Our Shapes Power Point Templates Are Created By Innovative Young Minds. Guaranteed To Fit Presentations Of All Kinds.
-
 Percentage circle visual for financial data analysis infographic template
This is our Percentage Circle Visual For Financial Data Analysis Infographic Template designed in PowerPoint, however, you can also access it in Google Slides. It comes in two aspect ratios standard and widescreen, with fully editable visual content.
-
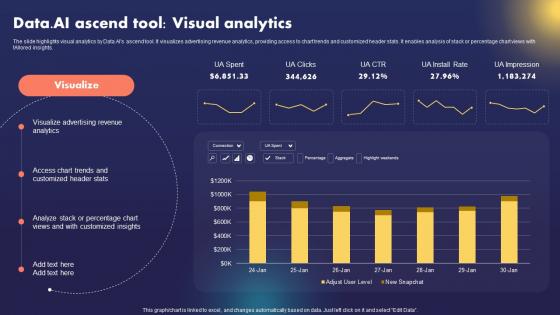 Data AI Artificial Intelligence Business Platform Data AI Ascend Tool Visual Analytics AI SS
The slide highlights visual analytics by Data.AIs ascend tool. It visualizes advertising revenue analytics, providing access to chart trends and customized header stats. It enables analysis of stack or percentage chart views with tAIlored insights. Deliver an outstanding presentation on the topic using this Data AI Artificial Intelligence Business Platform Data AI Ascend Tool Visual Analytics AI SS. Dispense information and present a thorough explanation of Visual Analytics By Data AI, Visualizes Advertising, Revenue Analytics, Customized Header Stats using the slides given. This template can be altered and personalized to fit your needs. It is also available for immediate download. So grab it now.
-
 Key Indicator Dashboard For IOT Data Visualization
This slide represents IOT data visualization key indicator dashboard. This slide includes traffic loops, speed of cars average, patterns as per weekly and hourly and date wise traffic density low or high. Introducing our Key Indicator Dashboard For IOT Data Visualization set of slides. The topics discussed in these slides are Key Benefits With Data Visualization In IOT. This is an immediately available PowerPoint presentation that can be conveniently customized. Download it and convince your audience.
-
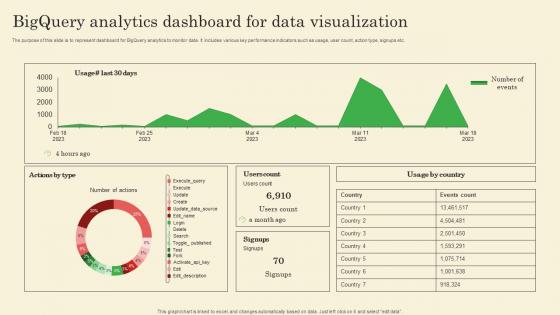 Bigquery Analytics Dashboard For Data Visualization
The purpose of this slide is to represent dashboard for BigQuery analytics to monitor data. It includes various key performance indicators such as usage, user count, action type, signups etc. Introducing our Bigquery Analytics Dashboard For Data Visualization set of slides. The topics discussed in these slides are Users Count, Usage By Country. This is an immediately available PowerPoint presentation that can be conveniently customized. Download it and convince your audience.
-
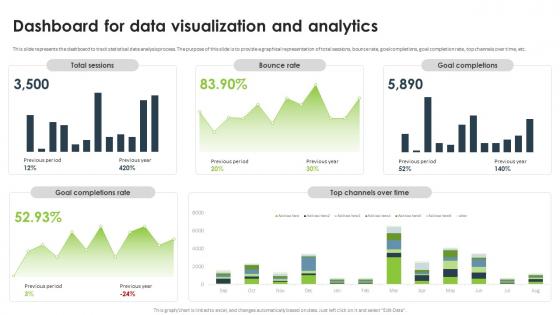 Statistical Analysis For Data Driven Dashboard For Data Visualization And Analytics
This slide represents the dashboard to track statistical data analysis process. The purpose of this slide is to provide a graphical representation of total sessions, bounce rate, goal completions, goal completion rate, top channels over time, etc. Present the topic in a bit more detail with this Statistical Analysis For Data Driven Dashboard For Data Visualization And Analytics. Use it as a tool for discussion and navigation on Data Visualization And Analytics, Bounce Rate, Goal Completions, Goal Completion Rate. This template is free to edit as deemed fit for your organization. Therefore download it now.
-
 Digital Marketing Data Visualization Dashboard
This slide depicts data visualization KPI dashboard on digital marketing to help big data understand patterns, trends, and correlations that might be undetected in text-based data. It includes elements such as conversions, cost per conversion, etc. Introducing our Digital Marketing Data Visualization Dashboard set of slides. The topics discussed in these slides are Digital Marketing, Data Visualization Dashboard.This is an immediately available PowerPoint presentation that can be conveniently customized. Download it and convince your audience.
-
 Global Market Size Graph Of Data Visualization Tools
This slide depicts data visualization market size tools to provide details about interpreting information in visual format. It includes bases such as key drivers, key players, and restraining factors. Presenting our well structured Global Market Size Graph Of Data Visualization Tools. The topics discussed in this slide are Global Data Visualization Tools, Market Size, Key Drivers, Key Players, Restraining Factors. This is an instantly available PowerPoint presentation that can be edited conveniently. Download it right away and captivate your audience.
-
 Statistics Showcasing Benefits Of Data Visualization
This slide showcases the statistics representing benefits of data visualization which helps an organization to provide deeper insights of conditions occurring within different information sets. It include details such as provides actionable items, etc. Introducing our Statistics Showcasing Benefits Of Data Visualization set of slides. The topics discussed in these slides are Data Visualization, Statistics Showcasing, Actionable ItemsThis is an immediately available PowerPoint presentation that can be conveniently customized. Download it and convince your audience.
-
 Dashboard To Evaluate Training Program Effectiveness Data Visualization DTE SS
This slide showcases dashboard that can help organization to evaluate the training program implemented in organization. Its key components are training cost, number of participants, hours of training, cost per participant and occupancy rate. Present the topic in a bit more detail with this Dashboard To Evaluate Training Program Effectiveness Data Visualization DTE SS. Use it as a tool for discussion and navigation on Total Complete Training, Total Hours Training, Total Participant. This template is free to edit as deemed fit for your organization. Therefore download it now.
-
 Delays In Sales Forecasting And Increasing Error Rates Data Visualization DTE SS
The following slide on increased error rate visually presents the impact on efficiency, aiding managers in crafting targeted training interventions to minimize errors. The error rates have increased due to lack of employee knowledge, inability to predict data etc. Present the topic in a bit more detail with this Delays In Sales Forecasting And Increasing Error Rates Data Visualization DTE SS. Use it as a tool for discussion and navigation on Error Rates, Delay Rates, Delays Arising. This template is free to edit as deemed fit for your organization. Therefore download it now.
-
 Improved IT Performance After Training Data Visualization DTE SS
This slide highlights the enhanced cross-departmental performance resulting from training, providing managers with insights to assess trainings impact on organizational efficiency and effectiveness. The positive results in IT department were due to an increase in analytical skills, etc. Present the topic in a bit more detail with this Improved IT Performance After Training Data Visualization DTE SS. Use it as a tool for discussion and navigation on IT Department Performance, Application Analytical, Skills Employees. This template is free to edit as deemed fit for your organization. Therefore download it now.
-
 Monthly Performance Assessment Across Departments Data Visualization DTE SS
The following slide highlights the performance of all departments over the months that will guide management in the development of targeted interventions and strategies. The slide shows the performance of the marketing, IT, finance and operations department. Present the topic in a bit more detail with this Monthly Performance Assessment Across Departments Data Visualization DTE SS. Use it as a tool for discussion and navigation on Department Performance, Usage Outdated Technology, Lack Skilled Professionals. This template is free to edit as deemed fit for your organization. Therefore download it now.
-
 Post Training Employee Satisfaction Tracking Dashboard Data Visualization DTE SS
This dashboard provides a comprehensive overview of post-training employee satisfaction metrics, equipping managers with real-time insights to assess the effectiveness of training programs and enhance overall employee contentment and engagement. Present the topic in a bit more detail with this Post Training Employee Satisfaction Tracking Dashboard Data Visualization DTE SS. Use it as a tool for discussion and navigation on Training Delivery Effectiveness, Learning Retention Rate, Learner Engagement Rate. This template is free to edit as deemed fit for your organization. Therefore download it now.
-
 Reduced Errors And Delays Post Training Data Visualization DTE SS
This slide contains information on the significant reduction in errors and delays in business analytics post-training, aiding managers in gauging the trainings effectiveness in optimizing analytical processes and overall operational efficiency. Present the topic in a bit more detail with this Reduced Errors And Delays Post Training Data Visualization DTE SS. Use it as a tool for discussion and navigation on Error Rate, Delay Rates, Error Rates Decreased. This template is free to edit as deemed fit for your organization. Therefore download it now.
-
 1113 business ppt diagram 5 steps of data visualization powerpoint template
We are proud to present our 1113 business ppt diagram 5 steps of data visualization powerpoint template. Dig in to our vast array of Arrows Powerpoint Templates. Be sure to come with many that fit your need perfectly. Unleash the value of your experience with our Advertising Powerpoint Templates. Educate your team with the knowledge you have gained.
-
 Data visualization business analyst ppt powerpoint presentation styles sample cpb
Presenting our Data Visualization Business Analyst Ppt Powerpoint Presentation Styles Sample Cpb PowerPoint template design. This PowerPoint slide showcases four stages. It is useful to share insightful information on Data Visualization Business Analyst This PPT slide can be easily accessed in standard screen and widescreen aspect ratios. It is also available in various formats like PDF, PNG, and JPG. Not only this, the PowerPoint slideshow is completely editable and you can effortlessly modify the font size, font type, and shapes according to your wish. Our PPT layout is compatible with Google Slides as well, so download and edit it as per your knowledge.
-
 Data security it post it notes ppt slides visual aids ppt slides picture
Increase audience engagement and knowledge by dispensing information using Data Security IT Post IT Notes Ppt Slides Visual Aids Ppt Slides Picture. This template helps you present information on three stages. You can also present information on Post IT Notes using this PPT design. This layout is completely editable so personaize it now to meet your audiences expectations.
-
 Advanced Data Analytics Visualization Tool Comparison Matrix
This slide highlights the comparative analysis among several advanced data analytics visualization tools. The purpose of this template is to help businesses make informed decisions regarding purchases. It includes parameters such as pricing, number of downloads, ratings, etc.Presenting our well structured Advanced Data Analytics Visualization Tool Comparison Matrix. The topics discussed in this slide are Facilitates Communicating, Researchers Understand, Predictive Analysis. This is an instantly available PowerPoint presentation that can be edited conveniently. Download it right away and captivate your audience.
-
 Advanced Data Analytics Visualization Tools Icon
Introducing our Advanced Data Analytics Visualization Tools Icon set of slides. The topics discussed in these slides are Advanced Data Analytics, Visualization Tools Icon. This is an immediately available PowerPoint presentation that can be conveniently customized. Download it and convince your audience.
-
 Organizing Feature Map Geospatial Data Visualization Illustration
This coloured PowerPoint icon is a great visual aid for organizing feature maps. It is a simple, easy to use template with a bright, colourful design that will help you organize your ideas in a clear and concise way.
-
 Data Visualization Leaders In Powerpoint And Google Slides Cpb
Presenting our Data Visualization Leaders In Powerpoint And Google Slides Cpb PowerPoint template design. This PowerPoint slide showcases two stages. It is useful to share insightful information on Data Visualization Leaders This PPT slide can be easily accessed in standard screen and widescreen aspect ratios. It is also available in various formats like PDF, PNG, and JPG. Not only this, the PowerPoint slideshow is completely editable and you can effortlessly modify the font size, font type, and shapes according to your wish. Our PPT layout is compatible with Google Slides as well, so download and edit it as per your knowledge.
-
 Data Visualization Mining Colored Icon In Powerpoint Pptx Png And Editable Eps Format
This coloured PowerPoint icon is an ideal visual aid for presentations on data mining. It is a simple, eye-catching graphic that conveys the concept of data mining in a clear and concise way. Perfect for slideshows, reports, and other documents.
-
 Data Visualization Mining Monotone Icon In Powerpoint Pptx Png And Editable Eps Format
This monotone PowerPoint icon is perfect for presentations on data mining. It features a magnifying glass with a data symbol in the center, symbolizing the process of searching for valuable information. It is a great way to illustrate the power of data mining.
-
 Data Visualization Filtration Colored Icon In Powerpoint Pptx Png And Editable Eps Format
This coloured PowerPoint icon is perfect for illustrating data filtration processes. It features a funnel with a filter symbol, representing the process of sorting and refining data. A great visual aid for presentations and reports.
-
 Data Visualization Filtration Monotone Icon In Powerpoint Pptx Png And Editable Eps Format
This Monotone Powerpoint Icon is an ideal illustration for data filtration. It features a funnel-shaped design with a series of concentric circles that represent the filtering process. It is a great visual aid for presentations, reports, and other documents.
-
 Data Visualization Processing Colored Icon In Powerpoint Pptx Png And Editable Eps Format
This coloured powerpoint icon depicts data processing. It features a laptop with a graph and a magnifying glass, representing the analysis and research involved in data processing. Use this icon to illustrate data processing in your presentations.
-
 Data Visualization Processing Monotone Icon In Powerpoint Pptx Png And Editable Eps Format
This Monotone PowerPoint Icon is perfect for representing data processing in presentations. It features a simple, black and white design that is sure to draw attention to the data processing topic. It is ideal for illustrating data flow and other related concepts.
-
 Visualization Data Science In Powerpoint And Google Slides Cpb
Presenting Visualization Data Science In Powerpoint And Google Slides Cpb slide which is completely adaptable. The graphics in this PowerPoint slide showcase four stages that will help you succinctly convey the information. In addition, you can alternate the color, font size, font type, and shapes of this PPT layout according to your content. This PPT presentation can be accessed with Google Slides and is available in both standard screen and widescreen aspect ratios. It is also a useful set to elucidate topics like Visualization Data Science. This well structured design can be downloaded in different formats like PDF, JPG, and PNG. So, without any delay, click on the download button now.
-
 Data Visualization Intelligence Colored Icon In Powerpoint Pptx Png And Editable Eps Format
This colored PowerPoint icon is a perfect representation of Data Intelligence. It is a great visual aid to help explain the concept of data analysis and how it can be used to make informed decisions. It is a great tool to help visualize the power of data and its potential.
-
 Data Visualization Intelligence Monotone Icon In Powerpoint Pptx Png And Editable Eps Format
This Monotone Powerpoint Icon on Data Intelligence is perfect for presentations. It features a black and white image of a brain with a graph and a magnifying glass to represent data analysis. Its a great visual to illustrate the concept of data intelligence.
-
 Data Visualization Bot Technology Colored Icon In Powerpoint Pptx Png And Editable Eps Format
This colourful PowerPoint icon depicts a friendly robot, perfect for adding a modern tech touch to any presentation. The icon is bright and inviting, ideal for creating a positive atmosphere.
-
 Data Visualization Bot Technology Monotone Icon In Powerpoint Pptx Png And Editable Eps Format
This monotone PowerPoint icon depicts a robotic figure with a circular head, two arms, and two legs. It is a perfect choice for presentations about robots, automation, and artificial intelligence.
-
 Data Visualization Portfolio Examples In Powerpoint And Google Slides Cpb
Presenting our Data Visualization Portfolio Examples In Powerpoint And Google Slides Cpb PowerPoint template design. This PowerPoint slide showcases three stages. It is useful to share insightful information on Data Visualization Portfolio Examples. This PPT slide can be easily accessed in standard screen and widescreen aspect ratios. It is also available in various formats like PDF, PNG, and JPG. Not only this, the PowerPoint slideshow is completely editable and you can effortlessly modify the font size, font type, and shapes according to your wish. Our PPT layout is compatible with Google Slides as well, so download and edit it as per your knowledge.
-
 Big Data Visualization Uses For HR Analytics
This slide represents the major uses and applications of big data visualization for HR analytics. It further includes areas of use of data visualization such as recruiting, retention, turnover, productivity, workforce planning, etc. Introducing our premium set of slides with Big Data Visualization Uses For HR Analytics. Ellicudate the six stages and present information using this PPT slide. This is a completely adaptable PowerPoint template design that can be used to interpret topics like Recruiting, Turnover, Planning. So download instantly and tailor it with your information.
-
 Data Mining A Complete Guide Data Mining Techniques Visualization Method AI SS
This slide showcases visualization of data mining technique to help data experts prepare data for reporting it to stakeholders and present meaningful insights. It provides details about compare data, part to whole, data distribution, KPIs, Gauges, Geospatial data, etc. Deliver an outstanding presentation on the topic using this Data Mining A Complete Guide Data Mining Techniques Visualization Method AI SS. Dispense information and present a thorough explanation of Compare Data, Data Mining Techniques, Visualization Method, Data Distribution, Geospatial Data using the slides given. This template can be altered and personalized to fit your needs. It is also available for immediate download. So grab it now.
-
 Data Mining A Complete Guide Data Mining Types Of Data Ppt Ideas Visuals AI SS
This slide showcases various types of data which is potentially mined during data mining process, can be referred by various industrial experts. It provides details about data such as multimedia, text, web, spatiotemporal, etc. Introducing Data Mining A Complete Guide Data Mining Types Of Data Ppt Ideas Visuals AI SS to increase your presentation threshold. Encompassed with four stages, this template is a great option to educate and entice your audience. Dispence information on Sentiment Analysis, Text Categorization, Weather Services, Spatiotemporal Data, using this template. Grab it now to reap its full benefits.
-
 Data Visualization Solutions For Dealing With Dark Data Dark Data And Its Utilization
This slide suggests a solution for managing dark data using data visualization techniques. By using data visualization tools, organizations can analyze large amounts of unstructured data and uncover hidden insights that were previously unknown. Present the topic in a bit more detail with this Data Visualization Solutions For Dealing With Dark Data Dark Data And Its Utilization. Use it as a tool for discussion and navigation on Network Diagrams, Geographic Maps, Interactive Dashboards. This template is free to edit as deemed fit for your organization. Therefore download it now.
-
 Distinguish Infographic Visualization Data Representation Illustration
This coloured PowerPoint icon is perfect for creating professional-looking infographics. It has a modern design and is easy to use, allowing you to quickly create stunning visuals for presentations and reports.
-
 Data Visualization Data Science In Powerpoint And Google Slides Cpb
Presenting Data Visualization Data Science In Powerpoint And Google Slides Cpb slide which is completely adaptable. The graphics in this PowerPoint slide showcase three stages that will help you succinctly convey the information. In addition, you can alternate the color, font size, font type, and shapes of this PPT layout according to your content. This PPT presentation can be accessed with Google Slides and is available in both standard screen and widescreen aspect ratios. It is also a useful set to elucidate topics like Data Visualization Data Science. This well-structured design can be downloaded in different formats like PDF, JPG, and PNG. So, without any delay, click on the download button now.
-
 Best Practices In IOT Data Visualization
This slide highlights IOT data visualization best practices. This slide includes customized dashboard, real-time parameter adjustment and give visual simplicity a high priority and further includes monitor yield and uptime to monitor performance. Presenting our set of slides with Best Practices In IOT Data Visualization. This exhibits information on Three stages of the process. This is an easy to edit and innovatively designed PowerPoint template. So download immediately and highlight information on Customize Dashboards, Realtime Parameter Adjustment
-
 Data Statistic Report Icon For IOT Visualization
Introducing our premium set of slides withData Statistic Report Icon For IOT Visualization. Ellicudate the Three stages and present information using this PPT slide. This is a completely adaptable PowerPoint template design that can be used to interpret topics like Data Statistic Report, Icon For IOT Visualization. So download instantly and tailor it with your information.
-
 Data Visualization Platform For IOT
Presenting our set of slides with Data Visualization Platform For IOT. This exhibits information on Four stages of the process. This is an easy to edit and innovatively designed PowerPoint template. So download immediately and highlight information on Connectivity Platform, Management Platform, Enablement Platform.
-
 Industry 4 0 In IOT Data Visualization
This slide showcases IOT data visualization in industry 4.0. This slide includes enable energy efficiency, improves business return and improved production quality and further includes reduce problems by reducing need of inspections. Introducing our premium set of slides with Industry 4 0 In IOT Data Visualization. Ellicudate the Three stages and present information using this PPT slide. This is a completely adaptable PowerPoint template design that can be used to interpret topics like Enables Energy Efficiency, Improves Business Return, Improved Production Quality. So download instantly and tailor it with your information.
-
 Key Benefits With Data Visualization In IOT
This slide showcases IOT data visualization key benefits. This slide includes unlocking key values, identify patterns and display complex relationship and further includes makes key values of data clear and visible. Presenting our set of slides with Key Benefits With Data Visualization In IOT. This exhibits information on Three stages of the process. This is an easy to edit and innovatively designed PowerPoint template. So download immediately and highlight information on Display Complex Relationship, Identify Patterns.
-
 Status Tracking Icon For Data Visualization
Presenting our set of slides withStatus Tracking Icon For Data Visualization. This exhibits information on Three stages of the process. This is an easy to edit and innovatively designed PowerPoint template. So download immediately and highlight information onStatus Tracking Icon For Data Visualization
-
 Tools For Data Visualization In IOT Applications
This slide represents IOT data visualization application tools. This slide includes tools, free trials, price, reviews and features such as offer time series analytics, colourful data with different patterns and analyse static and streaming data. Introducing our Tools For Data Visualization In IOT Applications set of slides. The topics discussed in these slides are Features, Free Trial, Price. This is an immediately available PowerPoint presentation that can be conveniently customized. Download it and convince your audience.
-
 Use Cases For Data Visualization In IOT
This slide highlights IOT data visualization use cases. This slide includes monitor electricity consumption, business productivity management and bookings in Cafe and further includes aid in revenue growth and business expansion. Introducing our premium set of slides with Use Cases For Data Visualization In IOT. Ellicudate the Three stages and present information using this PPT slide. This is a completely adaptable PowerPoint template design that can be used to interpret topics like Monitor Electricity Consumption, Business Productivity Management. So download instantly and tailor it with your information.
-
 Use Of Big Data For IOT Visualization
This slide highlights big data IOT visualization uses. This slide includes transportation sector, financial sector and travel sector and further includes terminal distance calculation and live passenger movement. Presenting our set of slides with Use Of Big Data For IOT Visualization. This exhibits information on Three stages of the process. This is an easy to edit and innovatively designed PowerPoint template. So download immediately and highlight information on Transportation Sector, Financial Sector, Travel Sector.
-
 Augmented Reality Used For Real Time Data Visualization IoT Supply Chain Management IoT SS
This slide provides an overview of the AR technology used to optimize the warehouse. The slide further includes benefits that are providing real time details, accurate inventory information, effective training and enhance safety.Introducing Augmented Reality Used For Real Time Data Visualization IoT Supply Chain Management IoT SS to increase your presentation threshold. Encompassed with one stage, this template is a great option to educate and entice your audience. Dispence information on Streamline Operations, Optimize Inventory, Onboarding Process, using this template. Grab it now to reap its full benefits.
-
 Data Driven Processing Tools For Reporting And Visualization
This slide displays data driven software for data analysis and extracting valuable insights. It includes tools such as business intelligence, CRM software, market research, attribution modelling and website analytics. Presenting our set of slides with Data Driven Processing Tools For Reporting And Visualization. This exhibits information on three stages of the process. This is an easy to edit and innovatively designed PowerPoint template. So download immediately and highlight information on Business Intelligence Tools, Market Research.


