Powerpoint Templates and Google slides for Reports Dashboards
Save Your Time and attract your audience with our fully editable PPT Templates and Slides.
-
 Human Resource Management Using Business Intelligence Report Dashboard
The following slide highlights dashboard for human resource business intelligence report to enhance organizational revenue, improve operational efficiency etc. It includes overall labour effectiveness, department wise overall labour effectiveness, target, marketing, sales etc. Presenting our well structured Human Resource Management Using Business Intelligence Report Dashboard. The topics discussed in this slide are Avg Yearly Absenteeism, Overall Labor Effectiveness, Absenteeism. This is an instantly available PowerPoint presentation that can be edited conveniently. Download it right away and captivate your audience.
-
 Dashboard To Track Reporting And Billing Strategic Guide To Develop Customer Billing System
Following slide exhibits billing system dashboard that assure efficient time tracking and bills management. It include elements such as total invoices, customers, suppliers, products etc. Present the topic in a bit more detail with this Dashboard To Track Reporting And Billing Strategic Guide To Develop Customer Billing System. Use it as a tool for discussion and navigation on Overview Report, Sell Report, Purchase Report. This template is free to edit as deemed fit for your organization. Therefore download it now.
-
 Medical Lab Surgery Reporting Dashboard
Following slide presents a dashboard which reports the status of surgery patients that can be used by medical lab practitioners to make the adjustments. The key metrics covered are active patients, active injections, ongoing surgeries etc. Introducing our Medical Lab Surgery Reporting Dashboard set of slides. The topics discussed in these slides are Active Patients, Department. This is an immediately available PowerPoint presentation that can be conveniently customized. Download it and convince your audience.
-
 Hyperautomation Bot Status Reporting Dashboard
Following slide presents hyperautomation bot status reporting dashboard to be used by managers for monitoring hyperautomation tool status. Key performance indicators are robot status, energy consumption, time to charging stakeholders Introducing our Hyperautomation Bot Status Reporting Dashboard set of slides. The topics discussed in these slides are Bots Overview, Tasks Overview, Bot Status. This is an immediately available PowerPoint presentation that can be conveniently customized. Download it and convince your audience.
-
 Dashboard To Track CPA Advertiser Performance Report Best Practices To Deploy CPA Marketing
This slide present the kpi dashboard to monitor the performance of CPA advertiser. It includes metrics such as sales number, commission, sales amount, CTR, number of clicks, sessions, CTC, advertiser performance report, etc. Deliver an outstanding presentation on the topic using this Dashboard To Track CPA Advertiser Performance Report Best Practices To Deploy CPA Marketing. Dispense information and present a thorough explanation of Sale Amount, Commission, CTR using the slides given. This template can be altered and personalized to fit your needs. It is also available for immediate download. So grab it now.
-
 SAP Analytics Cloud Dashboard For Financial Reporting Action Plan For Implementing BI
This slide illustrates the SAP Analytics Cloud dashboard for financial reporting in terms of net revenue, operating profit, cost of goods sold, profitability trend and net revenue by country. It also provides details of net worth of incoming order and order distribution by country. Deliver an outstanding presentation on the topic using this SAP Analytics Cloud Dashboard For Financial Reporting Action Plan For Implementing BI. Dispense information and present a thorough explanation of Profitability Trend, SAP Analytics, Cloud Dashboard, Financial Reporting using the slides given. This template can be altered and personalized to fit your needs. It is also available for immediate download. So grab it now.
-
 Procurement Dashboard Report With Sourcing Details
This slide illustrate the report that enable managers to track, evaluate and optimize all acquisition process occurring in a organization. It includes kpis like supplier discount rate, avg. Procurement cycle, total expense and savings etc. Introducing our Procurement Dashboard Report With Sourcing Details set of slides. The topics discussed in these slides are Procurement Manager, Sourcing Category, Supplier Compliance Stats. This is an immediately available PowerPoint presentation that can be conveniently customized. Download it and convince your audience.
-
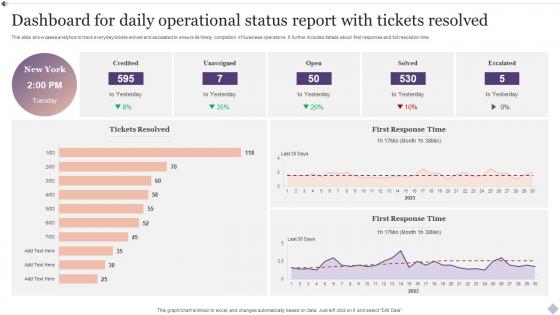 Dashboard For Daily Operational Status Report With Tickets Resolved
This slide showcases analytics to track everyday tickets solved and escalated to ensure its timely completion of business operations. It further includes details about first response and full resolution time. Presenting our well structured Dashboard For Daily Operational Status Report With Tickets Resolved. The topics discussed in this slide are Tickets Resolved, Solved, Response Time. This is an instantly available PowerPoint presentation that can be edited conveniently. Download it right away and captivate your audience.
-
 Contact Center Reporting And Analytics Metrics Dashboard
This slide covers contact center reporting and analytics metrics dashboard. It involves metrics such as total unsuccessful calls, competence, activity, agent details and quality rate. Introducing our Contact Center Reporting And Analytics Metrics Dashboard set of slides. The topics discussed in these slides are Unsuccessful Inbound, Talk Time Brackets, Answer Time Brackets This is an immediately available PowerPoint presentation that can be conveniently customized. Download it and convince your audience.
-
 Overview Of CPA Marketing Dashboard To Track CPA Advertiser Performance Report MKT SS V
This slide present the kpi dashboard to monitor the performance of CPA advertiser. It includes metrics such as sales number, commission, sales amount, CTR, number of clicks, sessions, CTC, advertiser performance report, etc. Present the topic in a bit more detail with this Overview Of CPA Marketing Dashboard To Track CPA Advertiser Performance Report MKT SS V. Use it as a tool for discussion and navigation on Dashboard, Track CPA, Advertiser, Performance Report. This template is free to edit as deemed fit for your organization. Therefore download it now.
-
 Customer Segmentation Dashboard For Business Intelligence Reporting
This slide presents a customer segmentation dashboard for reporting real time data. It includes key components such as delighted NPS score, standard customers, growth rate, CA customer location, net income vs. projection, customer distribution, etc. Introducing our Customer Segmentation Dashboard For Business Intelligence Reporting set of slides. The topics discussed in these slides are Sales By Representative, Customer Locations, Inbound Leads, Customer Distribution. This is an immediately available PowerPoint presentation that can be conveniently customized. Download it and convince your audience.
-
 Dashboard For Effective Retail Logistics Reporting
The following slide exhibits dashboard which allows monitoring and reporting on KPIs related to warehouse operations and overall supply chain management. It presents information related to average delivery time, costs, revenue, etc. Presenting our well structured Dashboard For Effective Retail Logistics Reporting. The topics discussed in this slide are Fleet Status, Shipment Status, Delivery By Countries. This is an instantly available PowerPoint presentation that can be edited conveniently. Download it right away and captivate your audience.
-
 Dashboard To Track CPA Advertiser Performance Report Implementing CPA Marketing To Enhance Mkt SS V
This slide present the kpi dashboard to monitor the performance of CPA advertiser. It includes metrics such as sales number, commission, sales amount, CTR, number of clicks, sessions, CTC, advertiser performance report, etc.Deliver an outstanding presentation on the topic using this Dashboard To Track CPA Advertiser Performance Report Implementing CPA Marketing To Enhance Mkt SS V. Dispense information and present a thorough explanation of Advertiser Performance, Transaction Report, Commission Status using the slides given. This template can be altered and personalized to fit your needs. It is also available for immediate download. So grab it now.
-
 Artificial Intelligence Dashboard Showing Hyperautomation Industry Report
The following dashboard shows key AI metrics such as Cloud infrastructure, application Health and User Experience. Deliver an outstanding presentation on the topic using this Artificial Intelligence Dashboard Showing Hyperautomation Industry Report. Dispense information and present a thorough explanation of Quick Overview, Cloud And Infrastructure, Application Health using the slides given. This template can be altered and personalized to fit your needs. It is also available for immediate download. So grab it now.
-
 RPA And Hyperautoamtion Impact Dashboard For Logistics Hyperautomation Industry Report
The following slide provides an overview of the impact of RPA and Hyperautomation on Supply Chain Industry, the provided highlights reduction in cost, supplier cost reduction etc. Deliver an outstanding presentation on the topic using this RPA And Hyperautoamtion Impact Dashboard For Logistics Hyperautomation Industry Report. Dispense information and present a thorough explanation of Cost Reduction, Cost Avoidance, Cost Saving using the slides given. This template can be altered and personalized to fit your needs. It is also available for immediate download. So grab it now.
-
 RPA And Hyperautomation Impact Dashboard For Healthcare Hyperautomation Industry Report
The following slide provides an overview of the impact of RPA and Hyperautomation on healthcare, the provided highlights patients in and out time, patient data. Present the topic in a bit more detail with this RPA And Hyperautomation Impact Dashboard For Healthcare Hyperautomation Industry Report. Use it as a tool for discussion and navigation on Total Patients, Available Staff, Patients By Division. This template is free to edit as deemed fit for your organization. Therefore download it now.
-
 RPA And Hyperautomation Impact Dashboard For Manufacturing Hyperautomation Industry Report
The following slide provides an overview of the impact of RPA and Hyperautomation on manufacturing, the provided highlights plant productivity, machine productivity. Deliver an outstanding presentation on the topic using this RPA And Hyperautomation Impact Dashboard For Manufacturing Hyperautomation Industry Report. Dispense information and present a thorough explanation of Production Rate, Operators Available, Productivity By Machine using the slides given. This template can be altered and personalized to fit your needs. It is also available for immediate download. So grab it now.
-
 RPA Dashboard With Automated Process And Productivity Hyperautomation Industry Report
The following dashboard highlights key metrics of robotic process automation such as success rate, robot utilization and robot productivity. Present the topic in a bit more detail with this RPA Dashboard With Automated Process And Productivity Hyperautomation Industry Report. Use it as a tool for discussion and navigation on Processes Automated, Robot Utilization, Robot Productivity. This template is free to edit as deemed fit for your organization. Therefore download it now.
-
 Strategic KPI Dashboard To Report Project Progress
Following slide demonstrates strategic plan progress tracking dashboard to determine business performance. It includes strategy progress such as pending, on track, disruption, major problems, discontinued strategy and completed strategy Introducing our Strategic KPI Dashboard To Report Project Progress set of slides. The topics discussed in these slides are Strategic, Report, Project. This is an immediately available PowerPoint presentation that can be conveniently customized. Download it and convince your audience.
-
 Dashboard For Weekly Progress Report With Open Risks And Issues
This slide displays dashboard to analyze overall project health and keep a track of weekly progress. It includes details such as schedule, task, budget and resource. Presenting our well structured Dashboard For Weekly Progress Report With Open Risks And Issues. The topics discussed in this slide are Progress, Report, Issues. This is an instantly available PowerPoint presentation that can be edited conveniently. Download it right away and captivate your audience.
-
 Weekly Progress Dashboard With Project Report And Timeline
This slide showcases progress dashboard to track overall pace of operations in organization on weekly basis. It includes details about task status, budget, risks, issues, timeline, etc. Introducing our Weekly Progress Dashboard With Project Report And Timeline set of slides. The topics discussed in these slides are Progress, Report, Timeline. This is an immediately available PowerPoint presentation that can be conveniently customized. Download it and convince your audience.
-
 ESG Data Reporting And Management Dashboard Global Green Technology And Sustainability
The following slide showcases a dashboard for tracking and managing data of economic, social and global goals. It provides information about ESG score breakdown by region, MV weight and MTD return by sector, fund vs. sector ESG score, lowest rated companies with MV weight over 1, etc. Present the topic in a bit more detail with this ESG Data Reporting And Management Dashboard Global Green Technology And Sustainability Use it as a tool for discussion and navigation on Score Breakdown By Region, Return By Sector This template is free to edit as deemed fit for your organization. Therefore download it now.
-
 Dashboard For Monitoring And Reporting Financial Budgets
This slide brings forth dashboard for monitoring and reporting the financial budgets of various branches of an enterprise emphasis on income and expenditure by each branch. The key performing indicators are actual vs budgeted revenue, revenue distribution by branches etc. Introducing our Dashboard For Monitoring And Reporting Financial Budgets set of slides. The topics discussed in these slides are Current Revenue, Current Operating Income This is an immediately available PowerPoint presentation that can be conveniently customized. Download it and convince your audience.
-
 Financial Kpi Dashboard To Report Cash Flow Of Company
This slide presents a financial dashboard of an enterprise which is being used to report the total spending power of a company. Key performing indicators include cash burn rate, monthly expenses, solvency etc. Presenting our well structured Financial Kpi Dashboard To Report Cash Flow Of Company The topics discussed in this slide are Cash Burn Rate, Monthly ExpensesThis is an instantly available PowerPoint presentation that can be edited conveniently. Download it right away and captivate your audience.
-
 Farm Planning And Budgeting Based On Dashboard Report
Following slide presents a dashboard that will assist farmers in planning and budgeting based on the key performance indicators. The key performance indicators are crop name, area, last production, current temperature, etc. Introducing our Farm Planning And Budgeting Based On Dashboard Report set of slides. The topics discussed in these slides are Planning, Budgeting, Report. This is an immediately available PowerPoint presentation that can be conveniently customized. Download it and convince your audience.
-
 SAP Analytics Cloud Dashboard For Financial Reporting Strategic Business Planning
This slide illustrates the SAP Analytics Cloud dashboard for financial reporting in terms of net revenue, operating profit, cost of goods sold, profitability trend and net revenue by country. It also provides details of net worth of incoming order and order distribution by country. Deliver an outstanding presentation on the topic using this SAP Analytics Cloud Dashboard For Financial Reporting Strategic Business Planning. Dispense information and present a thorough explanation of SAP Analytics, Cloud Dashboard, Financial Reporting, Operating Pro using the slides given. This template can be altered and personalized to fit your needs. It is also available for immediate download. So grab it now.
-
 Dashboard For Monitoring Social Media Platforms Marketing Report
This slide provides marketing report for various social media platforms aimed at displaying data insights in one place using relevant key performance indicators. It covers four platforms with key insights on marketing performance measured by metrics. Introducing our Dashboard For Monitoring Social Media Platforms Marketing Report set of slides. The topics discussed in these slides are Dashboard, Marketing, Performance. This is an immediately available PowerPoint presentation that can be conveniently customized. Download it and convince your audience.
-
 Facebook Ad Reporting Strategy Tools Dashboard
This slide showcases reporting instruments designed to be intuitive and easy to understand clients level of technical expertise. It helps business get more visibility for content. It involves information related to number of clicks, conversions, costs, etc. Introducing our Facebook Ad Reporting Strategy Tools Dashboard set of slides. The topics discussed in these slides are Website Conversions, Cost Per Conversi, Tools Dashboard. This is an immediately available PowerPoint presentation that can be conveniently customized. Download it and convince your audience.
-
 E Commerce Platforms Deposit Reporting Dashboard
The slide showcases a dashboard that provides the e commerce team with a clear overview of key financial and website KPIs at any time. The elements include data range, end date, start date, deposit order details, etc. with their key insights. Introducing our E Commerce Platforms Deposit Reporting Dashboard set of slides. The topics discussed in these slides are E Commerce, Platforms Deposit, Reporting Dashboard. This is an immediately available PowerPoint presentation that can be conveniently customized. Download it and convince your audience.
-
 Email Marketing Growth Report Dashboard
This slide dashboard is helpful for managers, executives, and stakeholders to display the effectiveness of an email marketing strategy. It includes active accounts, deleted accounts, and unsubscribed accounts in a month and a year. Presenting our well structured Email Marketing Growth Report Dashboard. The topics discussed in this slide are Email Marketing Growth, Report Dashboard. This is an instantly available PowerPoint presentation that can be edited conveniently. Download it right away and captivate your audience.
-
 Business Travel Management Reporting Dashboard
The following slide showcases dashboard for business travel management. It includes components such as global revenue market, largest application segment, fastest growing segment, growth revenue contributor, global revenue, market share etc. Presenting our well structured Business Travel Management Reporting Dashboard. The topics discussed in this slide are Global Market Snapshot, Largest Application Segment. This is an instantly available PowerPoint presentation that can be edited conveniently. Download it right away and captivate your audience.
-
 Evaluating Employee Training Plan KPI Dashboard Report
Following slide shows KPI dashboard for tracking employee training plans which help in analyzing where the organization lagging behind in skill development program. It includes the KPI such as training status, budget allocation, monthly cost incurred, etc.Introducing our Evaluating Employee Training Plan KPI Dashboard Report set of slides. The topics discussed in these slides are Voluntary Employee, Employee Performance, Employee Engagement. This is an immediately available PowerPoint presentation that can be conveniently customized. Download it and convince your audience.
-
 Corporate Fraud Risk Analysis Report Dashboard
Following slides show the report dashboard on corporate fraud risk which will assist in creating fraud prevention strategies .It includes KPI such as risk matrix, transaction split , transaction alert, etc. Present the topic in a bit more detail with this Corporate Fraud Risk Analysis Report Dashboard. Use it as a tool for discussion and navigation on Transaction Type, Transaction Split, Risk Matrix. This template is free to edit as deemed fit for your organization. Therefore download it now.
-
 Income Expense Analysis Report Dashboard
This slide exhibits an income and expense analysis dashboard which gives information on business financial performance. It includes key elements such as total expenses, expenses by type, total income, total net income, etc.Presenting our well structured Income Expense Analysis Report Dashboard. The topics discussed in this slide are Income Expense, Analysis Report Dashboard. This is an instantly available PowerPoint presentation that can be edited conveniently. Download it right away and captivate your audience.
-
 Quality control kpi dashboard showing reported issues and priority
Presenting this set of slides with name - Quality Control Kpi Dashboard Showing Reported Issues And Priority. This is a four stage process. The stages in this process are Quality Management, Quality Control, Quality Assurance.
-
 Audit kpi dashboard of operating systems manufacturer report and model report
Presenting this set of slides with name - Audit Kpi Dashboard Of Operating Systems Manufacturer Report And Model Report. This is a five stage process. The stages in this process are Audit, Examine, Survey.
-
 Vendor kpi dashboard showing gross sales earnings sold and sales report
Presenting this set of slides with name - Vendor Kpi Dashboard Showing Gross Sales Earnings Sold And Sales Report. This is a four stage process. The stages in this process are Vendor, Supplier, Retailer.
-
 Executing reporting kpi dashboard showing expenses customer by income
Presenting this set of slides with name - Executing Reporting Kpi Dashboard Showing Expenses Customer By Income. This is a five stage process. The stages in this process are Executive Reporting, Executive Analysis, Executive Performance.
-
 Executing reporting kpi dashboard snapshot showing income sales by product vendor expenses
Presenting this set of slides with name - Executing Reporting Kpi Dashboard Snapshot Showing Income Sales By Product Vendor Expenses. This is a four stage process. The stages in this process are Executive Reporting, Executive Analysis, Executive Performance.
-
 Executing reporting kpi dashboard showing net profit expenses contracts per category
Presenting this set of slides with name - Executing Reporting Kpi Dashboard Showing Net Profit Expenses Contracts Per Category. This is a six stage process. The stages in this process are Executive Reporting, Executive Analysis, Executive Performance.
-
 Executing reporting kpi dashboard showing revenue net profit margin debt to equity
Presenting this set of slides with name - Executing Reporting Kpi Dashboard Showing Revenue Net Profit Margin Debt To Equity. This is a five stage process. The stages in this process are Executive Reporting, Executive Analysis, Executive Performance.
-
 Executing reporting kpi dashboard showing sales opportunity and sales booking
Presenting this set of slides with name - Executing Reporting Kpi Dashboard Showing Sales Opportunity And Sales Booking. This is a four stage process. The stages in this process are Executive Reporting, Executive Analysis, Executive Performance.
-
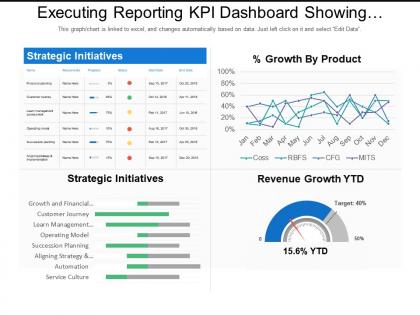 Executing reporting kpi dashboard showing strategic initiatives and percentage growth by product
Presenting this set of slides with name - Executing Reporting Kpi Dashboard Showing Strategic Initiatives And Percentage Growth By Product. This is a four stage process. The stages in this process are Executive Reporting, Executive Analysis, Executive Performance.
-
 Executing reporting kpi dashboard showing total accounts marketing sales finance
Presenting this set of slides with name - Executing Reporting Kpi Dashboard Showing Total Accounts Marketing Sales Finance. This is a four stage process. The stages in this process are Executive Reporting, Executive Analysis, Executive Performance.
-
 Executing reporting kpi dashboard showing trading summary performance summary and sales ratio
Presenting this set of slides with name - Executing Reporting Kpi Dashboard Showing Trading Summary Performance Summary And Sales Ratio. This is a four stage process. The stages in this process are Executive Reporting, Executive Analysis, Executive Performance.
-
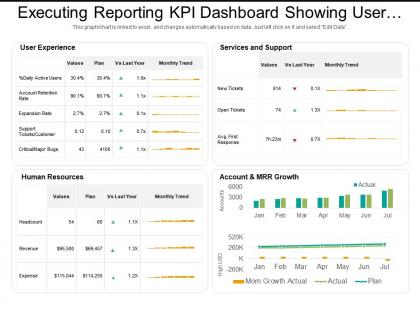 Executing reporting kpi dashboard showing user experience and human resources
Presenting this set of slides with name - Executing Reporting Kpi Dashboard Showing User Experience And Human Resources. This is a five stage process. The stages in this process are Executive Reporting, Executive Analysis, Executive Performance.
-
 Project management timeline task report dashboard snapshot
Introducing project management timeline task report dashboard snapshot PPT template. An easy access to make the desired changes or edit it anyways. Wide screen view of the slides. Easy conversion into Jpeg or Pdf format. The PPT images offer compatibility with Google Slides. High resolution icons for clear message delivery. Unique and informational content. Valuable for business professionals, sales representatives, marketing professionals, students and selling investigators. High quality charts and visuals used in the designing process. They enhance the performance of the presentation.
-
 Consultant analyzing dashboard for monthly reporting
Presenting our set of slides with Consultant Analyzing Dashboard For Monthly Reporting. This exhibits information on three stages of the process. This is an easy to edit and innovatively designed PowerPoint template. So download immediately and highlight information on Consultant Analyzing Dashboard For Monthly Reporting.
-
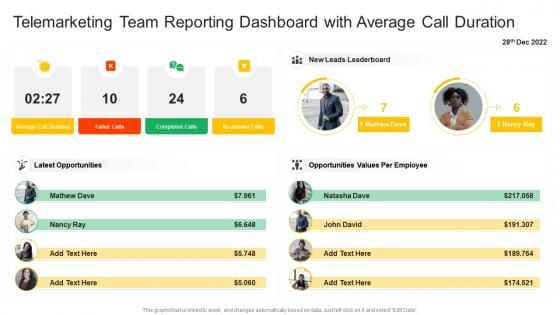 Telemarketing team reporting dashboard with average call duration
Introducing our premium set of slides with Telemarketing Team Reporting Dashboard With Average Call Duration. Ellicudate the two stages and present information using this PPT slide. This is a completely adaptable PowerPoint template design that can be used to interpret topics like Telemarketing Team Reporting Dashboard With Average Call Duration. So download instantly and tailor it with your information.
-
 Google data studio to build real time reporting dashboards digital marketing playbook
This template covers tools to measure marketing analytics such as google analytics for all web tracking, google data studio to build real time reporting dashboards and google data studio reports. Deliver an outstanding presentation on the topic using this Google Data Studio To Build Real Time Reporting Dashboards Digital Marketing Playbook. Dispense information and present a thorough explanation of Mobile System Operating Breakdown, Mobile Geographic Report, Mobile Sessions By Medium, Mobile Goal Analysis using the slides given. This template can be altered and personalized to fit your needs. It is also available for immediate download. So grab it now.
-
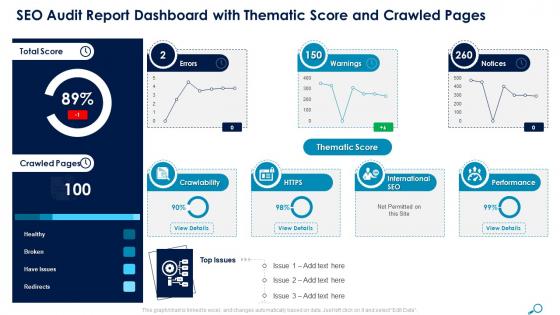 Seo audit report dashboard with thematic score and crawled pages ppt infographics skills
The slide shows the SEO Audit Report factors and descriptions that must be kept in mind in order to resolve issues and improve organic results such as dead end pages, long URLs, page not found and duplicate content along with the relevant action plan of each description. Deliver an outstanding presentation on the topic using this Seo Audit Report Dashboard With Thematic Score And Crawled Pages Ppt Infographics Skills. Dispense information and present a thorough explanation of SEO Audit Report Descriptions Of The Company using the slides given. This template can be altered and personalized to fit your needs. It is also available for immediate download. So grab it now.
-
 Maintenance Dashboard For Monitoring And Reporting Operations
This slide focuses on dashboard to digitize production planning which includes order status, current status, advance warning, last backup, maintenance summary, invalid order with pending notifications, orders and redbox. Introducing our Maintenance Dashboard For Monitoring And Reporting Operations set of slides. The topics discussed in these slides are Dashboard, Advance Warning, Maintenance Technicians. This is an immediately available PowerPoint presentation that can be conveniently customized. Download it and convince your audience.
-
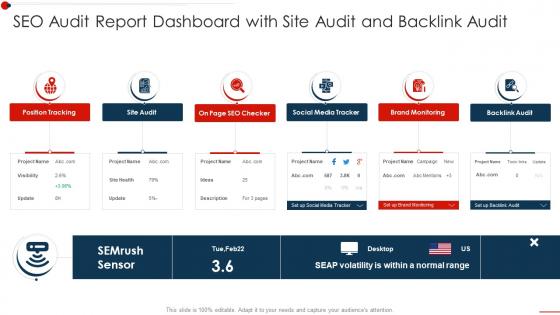 Report Dashboard With Site Audit Backlink Audit Seo Audit Report To Improve Organic Search
Present the topic in a bit more detail with this Report Dashboard With Site Audit Backlink Audit Seo Audit Report To Improve Organic Search. Use it as a tool for discussion and navigation on Dashboard, Backlink,Brand Monitoring. This template is free to edit as deemed fit for your organization. Therefore download it now.
-
 SEO Audit Report Dashboard With Site Audit And Backlink Audit
Present the topic in a bit more detail with this SEO Audit Report Dashboard With Site Audit And Backlink Audit. Use it as a tool for discussion and navigation on Social Media Tracker, Brand Monitoring, Backlink Audit. This template is free to edit as deemed fit for your organization. Therefore download it now.
-
 Human Resources Monthly Report Dashboard Colored Icon In Powerpoint Pptx Png And Editable Eps Format
Make your presentation profoundly eye-catching leveraging our easily customizable Human resources monthly report dashboard colored icon in powerpoint pptx png and editable eps format. It is designed to draw the attention of your audience. Available in all editable formats, including PPTx, png, and eps, you can tweak it to deliver your message with ease.
-
 Human Resources Monthly Report Dashboard Monotone Icon In Powerpoint Pptx Png And Editable Eps Format
Give your next presentation a sophisticated, yet modern look with this 100 percent editable Human resources monthly report dashboard monotone icon in powerpoint pptx png and editable eps format. Choose from a variety of customizable formats such as PPTx, png, eps. You can use these icons for your presentations, banners, templates, One-pagers that suit your business needs.
-
 SEO Audit Report Dashboard With Site Audit Evaluate The Current State Of Clients Website Traffic
Deliver an outstanding presentation on the topic using this SEO Audit Report Dashboard With Site Audit Evaluate The Current State Of Clients Website Traffic. Dispense information and present a thorough explanation of Social Media Tracker, Position Tracking, Brand Monitoring using the slides given. This template can be altered and personalized to fit your needs. It is also available for immediate download. So grab it now.
-
 SLA Dashboard Snapshot With Sales And Product Report
Introducing our SLA Dashboard Snapshot With Sales And Product Report set of slides. The topics discussed in these slides are Marketing, Finance, Service And Supports. This is an immediately available PowerPoint presentation that can be conveniently customized. Download it and convince your audience.
-
 Dashboard Report Colored Icon In Powerpoint Pptx Png And Editable Eps Format
Give your next presentation a sophisticated, yet modern look with this 100 percent editable Dashboard report colored icon in powerpoint pptx png and editable eps format. Choose from a variety of customizable formats such as PPTx, png, eps. You can use these icons for your presentations, banners, templates, One-pagers that suit your business needs.
-
 Dashboard Report Monotone Icon In Powerpoint Pptx Png And Editable Eps Format
Make your presentation profoundly eye-catching leveraging our easily customizable Dashboard report monotone icon in powerpoint pptx png and editable eps format. It is designed to draw the attention of your audience. Available in all editable formats, including PPTx, png, and eps, you can tweak it to deliver your message with ease.


