Powerpoint Templates and Google slides for Reports Dashboards
Save Your Time and attract your audience with our fully editable PPT Templates and Slides.
-
 Market Procurement Cost Report Dashboard With Top Suppliers
The following slide highlights the procurement cost dashboard which showcase the purchase order cost, cost savings and cost avoidance. Presenting our well-structured Market Procurement Cost Report Dashboard With Top Suppliers. The topics discussed in this slide are Procurement, Dashboard, Avoidance. This is an instantly available PowerPoint presentation that can be edited conveniently. Download it right away and captivate your audience.
-
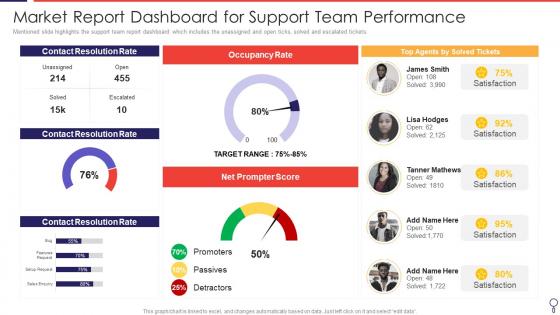 Market Report Dashboard Snapshot For Support Team Performance
Mentioned slide highlights the support team report dashboard which includes the unassigned and open ticks, solved and escalated tickets. Presenting our well-structured Market Report Dashboard Snapshot For Support Team Performance. The topics discussed in this slide are Dashboard, Performance, Escalated. This is an instantly available PowerPoint presentation that can be edited conveniently. Download it right away and captivate your audience.
-
 Market Research Report Dashboard Snapshot Of Fmcg Industry
The following slide highlights the market research report of FMCG which includes the sales by location, units per transaction and products sold. Presenting our well-structured Market Research Report Dashboard Of Fmcg Industry. The topics discussed in this slide are Market Research Report Dashboard Snapshot Of FMCG Industry. This is an instantly available PowerPoint presentation that can be edited conveniently. Download it right away and captivate your audience.
-
 Project Status And Tasks Report Dashboards Documenting List Specific Project
This slide shows the dashboards related to project details such as tasks, progress, time, costs, workloads, etc. Deliver an outstanding presentation on the topic using this Project Status And Tasks Report Dashboards Documenting List Specific Project. Dispense information and present a thorough explanation of Project Status And Tasks Report Dashboards using the slides given. This template can be altered and personalized to fit your needs. It is also available for immediate download. So grab it now.
-
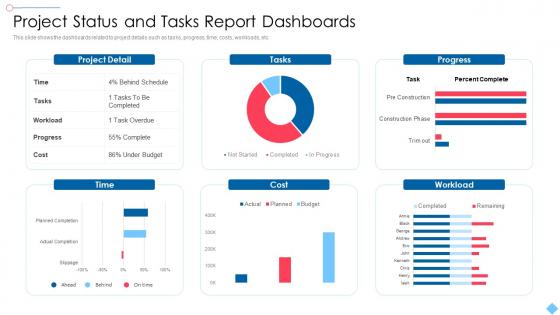 Project Scoping To Meet Customers Needs Product Status And Tasks Report Dashboards
This slide shows the dashboards related to project details such as tasks, progress, time, costs, workloads, etc. Deliver an outstanding presentation on the topic using this Project Scoping To Meet Customers Needs Product Status And Tasks Report Dashboards. Dispense information and present a thorough explanation of Project Status And Tasks Report Dashboards using the slides given. This template can be altered and personalized to fit your needs. It is also available for immediate download. So grab it now.
-
 Data Lake It Centralized Repository Data Lake Reporting Dashboard Snapshot
This slide represents the data lake reporting dashboard by covering the total number of users, total lake size, trusted zone size, conversion rate, and retention. Present the topic in a bit more detail with this Data Lake It Centralized Repository Data Lake Reporting Dashboard Snapshot. Use it as a tool for discussion and navigation on Centralized, Repository, Dashboard. This template is free to edit as deemed fit for your organization. Therefore download it now.
-
 Content Marketing Playbook Google Data Studio To Build Real Time Reporting Dashboards
This template covers tools to measure marketing analytics such as google analytics for all web tracking, google data studio to build real time reporting dashboards and google data studio reports. Deliver an outstanding presentation on the topic using this Content Marketing Playbook Google Data Studio To Build Real Time Reporting Dashboards. Dispense information and present a thorough explanation of Google Data Studio To Build Real Time Reporting Dashboards using the slides given. This template can be altered and personalized to fit your needs. It is also available for immediate download. So grab it now.
-
 Threat management for organization critical incident reporting dashboard
The firm will track the various incidents issues faced and resolved in the firm. Present the topic in a bit more detail with this Threat Management For Organization Critical Incident Reporting Dashboard. Use it as a tool for discussion and navigation on Incident Reporting Dashboard. This template is free to edit as deemed fit for your organization. Therefore download it now.
-
 Manage the project scoping to describe the major deliverables status and tasks report dashboards
This slide shows the dashboards related to project details such as tasks, progress, time, costs, workloads, etc. Deliver an outstanding presentation on the topic using this Manage The Project Scoping To Describe The Major Deliverables Status And Tasks Report Dashboards. Dispense information and present a thorough explanation of Project Status And Tasks Report Dashboards using the slides given. This template can be altered and personalized to fit your needs. It is also available for immediate download. So grab it now.
-
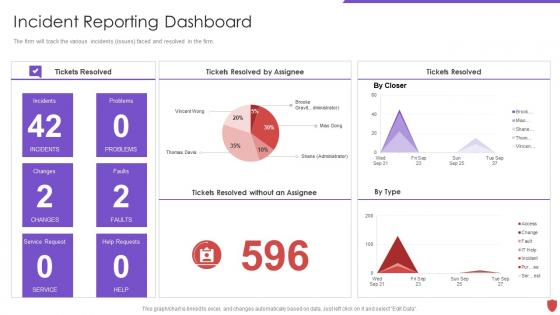 Cyber security risk management incident reporting dashboard
The firm will track the various incidents issues faced and resolved in the firm. Present the topic in a bit more detail with this Cyber Security Risk Management Incident Reporting Dashboard. Use it as a tool for discussion and navigation on Tickets Resolved, Tickets Resolved By Assignee, Tickets Resolved, Tickets Resolved Assignee. This template is free to edit as deemed fit for your organization. Therefore download it now.
-
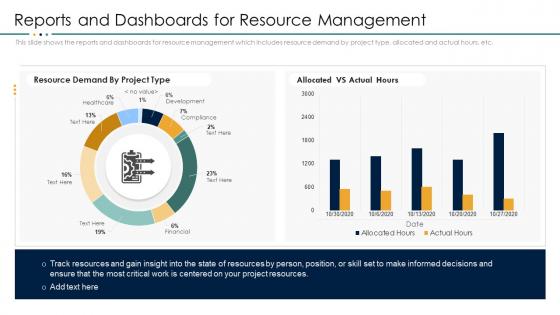 Project resource management plan reports and dashboards for resource management
This slide shows the reports and dashboards for resource management which includes resource demand by project type, allocated and actual hours, etc. Deliver an outstanding presentation on the topic using this Project Resource Management Plan Reports And Dashboards For Resource Management. Dispense information and present a thorough explanation of Reports And Dashboards For Resource Management using the slides given. This template can be altered and personalized to fit your needs. It is also available for immediate download. So grab it now.
-
 Project Risk Monitoring And Reporting Dashboard Risk Management Commercial Development Project
This slide shows dashboard covering overall progress report of construction project by tracking cost reduction, procurement ROI, and top suppliers. Present the topic in a bit more detail with this Project Risk Monitoring And Reporting Dashboard Risk Management Commercial Development Project. Use it as a tool for discussion and navigation on Project Risk Monitoring And Reporting Dashboard. This template is free to edit as deemed fit for your organization. Therefore download it now.
-
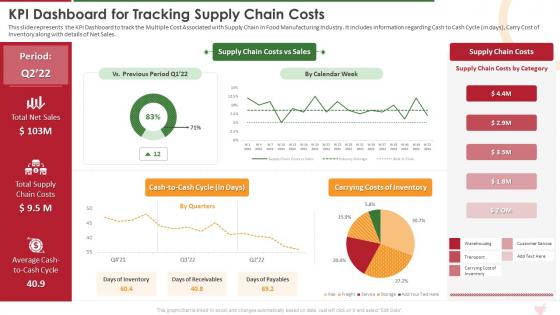 Kpi Dashboard For Tracking Supply Chain Costs Industry Report For Food Manufacturing Sector
This slide represents the KPI Dashboard to track the Multiple Cost Associated with Supply Chain in Food Manufacturing Industry. It includes information regarding Cash to Cash Cycle in days, Carry Cost of Inventory along with details of Net Sales. Present the topic in a bit more detail with this Kpi Dashboard For Tracking Supply Chain Costs Industry Report For Food Manufacturing Sector. Use it as a tool for discussion and navigation on Carrying Costs Of Inventory, Cash To Cash Cycle, Supply Chain Costs. This template is free to edit as deemed fit for your organization. Therefore download it now.
-
 Performance Monitoring Dashboard For Consumer Industry Report For Food Manufacturing Sector
This slide showcase the Performance Monitoring Dashboard for Consumer Goods providing information regarding the Overview of Food and Beverages Sales, Top Selling Products and On Shelf Availability. Deliver an outstanding presentation on the topic using this Performance Monitoring Dashboard For Consumer Industry Report For Food Manufacturing Sector. Dispense information and present a thorough explanation of Performance Monitoring Dashboard For Consumer Goods using the slides given. This template can be altered and personalized to fit your needs. It is also available for immediate download. So grab it now.
-
 Account Data Quality Report Dashboard Snapshot
Introducing our Account Data Quality Report Dashboard Snapshot set of slides. The topics discussed in these slides are Account Data Quality, Missing Account Data, Record Count, Data Quality Score. This is an immediately available PowerPoint presentation that can be conveniently customized. Download it and convince your audience.
-
 Quality Report Of Contact And Missing Data Dashboard Snapshot
This graph or chart is linked to excel, and changes automatically based on data. Just left click on it and select Edit Data. Presenting our well structured Quality Report Of Contact And Missing Data Dashboard Snapshot. The topics discussed in this slide are Contact Data Quality, Missing Contact Data, Missing Email Address, Missing Phone Number All Contact, Details Captured. This is an instantly available PowerPoint presentation that can be edited conveniently. Download it right away and captivate your audience.
-
 Incident Reporting Dashboard Snapshot Vulnerability Administration At Workplace
The firm will track the various incidents issues faced and resolved in the firm. Deliver an outstanding presentation on the topic using this Incident Reporting Dashboard Snapshot Vulnerability Administration At Workplace. Dispense information and present a thorough explanation of Incident Reporting Dashboard using the slides given. This template can be altered and personalized to fit your needs. It is also available for immediate download. So grab it now.
-
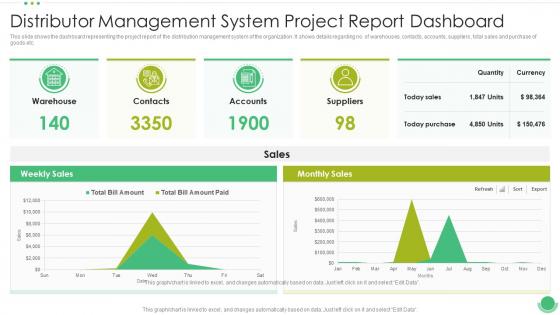 Distributor Management System Project Report Dashboard
This slide shows the dashboard representing the project report of the distribution management system of the organization. It shows details regarding no. of warehouses, contacts, accounts, suppliers , total sales and purchase of goods etc. Introducing our Distributor Management System Project Report Dashboard set of slides. The topics discussed in these slides are Warehouse, Contacts, Accounts. This is an immediately available PowerPoint presentation that can be conveniently customized. Download it and convince your audience.
-
 Utilize Resources With Project Resource Management Plan Reports And Dashboards For Resource
This slide shows the reports and dashboards for resource management which includes resource demand by project type, allocated and actual hours, etc. Deliver an outstanding presentation on the topic using this Utilize Resources With Project Resource Management Plan Reports And Dashboards For Resource. Dispense information and present a thorough explanation of Dashboards, Resource, Management using the slides given. This template can be altered and personalized to fit your needs. It is also available for immediate download. So grab it now.
-
 Financial Report Of An Information Technology Financials Dashboard
Present the topic in a bit more detail with this Financial Report Of An Information Technology Financials Dashboard. Use it as a tool for discussion and navigation on Companys Financials Dashboard. This template is free to edit as deemed fit for your organization. Therefore download it now.
-
 Companys Financials Dashboard Snapshot It Company Report Sample
Present the topic in a bit more detail with this Companys Financials Dashboard Snapshot It Company Report Sample. Use it as a tool for discussion and navigation on Companys Financials Dashboard. This template is free to edit as deemed fit for your organization. Therefore download it now.
-
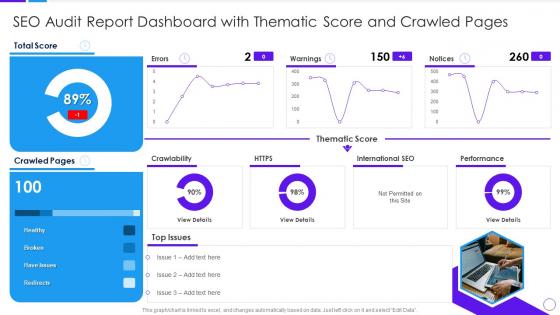 K1 SEO Audit Report Dashboard With Thematic Score And Crawled Pages Ppt File Icon
Deliver an outstanding presentation on the topic using this K1 SEO Audit Report Dashboard With Thematic Score And Crawled Pages Ppt File Icon. Dispense information and present a thorough explanation of Crawled, International, Performance using the slides given. This template can be altered and personalized to fit your needs. It is also available for immediate download. So grab it now.
-
 Salary Survey Report Employees Analytics Dashboard Showing Low Salary Concerns
This slide shows the human resource metrics and its outcome during a year. This also highlights the issues faced by the company due to poor outcome obtained from these metrics. Deliver an outstanding presentation on the topic using this Salary Survey Report Employees Analytics Dashboard Showing Low Salary Concerns. Dispense information and present a thorough explanation of Employees, Analytics, Dashboard using the slides given. This template can be altered and personalized to fit your needs. It is also available for immediate download. So grab it now.
-
 Kpi Dashboard For Tracking Supply Chain Costs Market Research Report
This slide represents the KPI dashboard to track the multiple cost associated with supply chain in food manufacturing industry. It includes information regarding cash to cash cycle in days, carry cost of inventory along with details of net sales. Deliver an outstanding presentation on the topic using this Kpi Dashboard For Tracking Supply Chain Costs Market Research Report. Dispense information and present a thorough explanation of KPI Dashboard For Tracking Supply Chain Costs using the slides given. This template can be altered and personalized to fit your needs. It is also available for immediate download. So grab it now.
-
 Performance Monitoring Dashboard For Consumer Goods Market Research Report
This slide showcase the performance monitoring dashboard for consumer goods providing information regarding the overview of food and beverages sales, top selling products and on shelf availability. Present the topic in a bit more detail with this Performance Monitoring Dashboard For Consumer Goods Market Research Report. Use it as a tool for discussion and navigation on Performance, Monitoring, Dashboard. This template is free to edit as deemed fit for your organization. Therefore download it now.
-
 Company Website Report Dashboard Snapshot With Total Customers
Introducing our Company Website Report Dashboard Snapshot With Total Customers set of slides. The topics discussed in these slides are Company, Website Report, Dashboard, Total Customers. This is an immediately available PowerPoint presentation that can be conveniently customized. Download it and convince your audience.
-
 Data Lake Future Of Analytics Centralized Repository Data Lake Reporting Dashboard Ppt Tips
This slide represents the data lake reporting dashboard by covering the total number of users, total lake size, trusted zone size, conversion rate, and retention. Present the topic in a bit more detail with this Data Lake Future Of Analytics Centralized Repository Data Lake Reporting Dashboard Ppt Tips. Use it as a tool for discussion and navigation on Centralized Repository, Reporting Dashboard. This template is free to edit as deemed fit for your organization. Therefore download it now.
-
 Website Analytics Report Dashboard Snapshot To Track Progress
This slide covers website analytics report dashboard snapshot to track performance and analyze progress. It caters data such number of sessions globally, number of users, social network and new and returning visitors. Presenting our well-structured Website Analytics Report Dashboard To Track Progress. The topics discussed in this slide are Website Analytics Report, Dashboard, Track Progress. This is an instantly available PowerPoint presentation that can be edited conveniently. Download it right away and captivate your audience.
-
 Website Analytics Report KPI Dashboard Snapshot
Introducing our Website Analytics Report KPI Dashboard Snapshot set of slides. The topics discussed in these slides are Website Analytics Report, KPI Dashboard Snapshot. This is an immediately available PowerPoint presentation that can be conveniently customized. Download it and convince your audience.
-
 Website Monthly Usage Analytics Report Dashboard
This slide depicts website usage analytics report for tracking performance. It involves number of users, sessions, bounce rate and average session duration. Introducing our Website Monthly Usage Analytics Report Dashboard set of slides. The topics discussed in these slides are Website Monthly Analytics, Report Dashboard. This is an immediately available PowerPoint presentation that can be conveniently customized. Download it and convince your audience.
-
 Website Usage Analytics Report Dashboard To Track Performance
This slide covers website usage analytics report for tracking performs. It involves all details about number of visitors, leads, consumer, major landing pages and average revenue per consumer. Presenting our well-structured Website Usage Analytics Report Dashboard To Track Performance. The topics discussed in this slide are Website Analytics Report, Dashboard, Track Performance. This is an instantly available PowerPoint presentation that can be edited conveniently. Download it right away and captivate your audience.
-
 Employee Performance And Promotion Review Dashboard Report
This slide covers dashboard of employee performance and promotion progress report. It includes parameters major projects completed along with attitude, timeliness, adaptability, cooperation etc. Presenting our well structured Employee Performance And Promotion Review Dashboard Report. The topics discussed in this slide are Employee Performance, Promotion Review Dashboard Report. This is an instantly available PowerPoint presentation that can be edited conveniently. Download it right away and captivate your audience.
-
 Data Lake Formation Centralized Repository Data Lake Reporting Dashboard
This slide represents the data lake reporting dashboard by covering the total number of users, total lake size, trusted zone size, conversion rate, and retention. Deliver an outstanding presentation on the topic using this Data Lake Formation Centralized Repository Data Lake Reporting Dashboard. Dispense information and present a thorough explanation of Data Lake Size, Conversion Rate, Retention using the slides given. This template can be altered and personalized to fit your needs. It is also available for immediate download. So grab it now.
-
 Google Data Studio To Build Real Time Reporting Dashboards B2B Digital Marketing Playbook
This template covers tools to measure marketing analytics such as google analytics for all web tracking, google data studio to build real time reporting dashboards and google data studio reports. Present the topic in a bit more detail with this Google Data Studio To Build Real Time Reporting Dashboards B2B Digital Marketing Playbook. Use it as a tool for discussion and navigation on Mobile Geographic Report, Mobile Sessions Medium, Mobile Goal Analysis. This template is free to edit as deemed fit for your organization. Therefore download it now.
-
 Optimizing Mobile SEO SEO Reporting Dashboard To Evaluate Website Rank Ppt Template
The purpose of this slide is to outline mobile search engine optimization SEO reporting dashboard. It covers different metrics such as web traffic overview, total views, content overview, goal value and conversion etc. Deliver an outstanding presentation on the topic using this Optimizing Mobile SEO SEO Reporting Dashboard To Evaluate Website Rank Ppt Template. Dispense information and present a thorough explanation of Content Overview, Traffic Overview, Goal Value And Conversion using the slides given. This template can be altered and personalized to fit your needs. It is also available for immediate download. So grab it now.
-
 Project Management Status Dashboard Snapshot With Key Strategy Issues Report
This slide shows dashboard of area of concern in project of firm. It includes total, active, closed , postponed issues along with project name, title and priority. Presenting our well-structured Project Management Status Dashboard Agile sprint dashboard with defected project status With Key Strategy Issues Report. The topics discussed in this slide are Management, Dashboard, Strategy. This is an instantly available PowerPoint presentation that can be edited conveniently. Download it right away and captivate your audience.
-
 Company KPI Dashboard Snapshot With Program Progress Report
This graph or chart is linked to excel, and changes automatically based on data. Just left click on it and select Edit Data. Introducing our Company KPI Dashboard Snapshot With Program Progress Report set of slides. The topics discussed in these slides are 3 Overdue Tasks, Total Budget, Budget By Employee. This is an immediately available PowerPoint presentation that can be conveniently customized. Download it and convince your audience.
-
 Company Management KPI Dashboard Snapshot With Marketing Program Report
This graph or chart is linked to excel, and changes automatically based on data. Just left click on it and select Edit Data. Introducing our Company Management KPI Dashboard Snapshot With Marketing Program Report set of slides. The topics discussed in these slides are Rankings, Site Audit, Traffic. This is an immediately available PowerPoint presentation that can be conveniently customized. Download it and convince your audience.
-
 Company Marketing Dashboard Report With Closed Sales
This graph or chart is linked to excel, and changes automatically based on data. Just left click on it and select Edit Data. Introducing our Company Marketing Dashboard Report With Closed Sales set of slides. The topics discussed in these slides are Closed Sales, Median Sales Price, Homes For Sale. This is an immediately available PowerPoint presentation that can be conveniently customized. Download it and convince your audience.
-
 Monthly Marketing Program Dashboard Snapshot Report
Presenting our well structured Monthly Marketing Program Dashboard Snapshot Report. The topics discussed in this slide are Rankings, Traffic, Site Audit. This is an instantly available PowerPoint presentation that can be edited conveniently. Download it right away and captivate your audience.
-
 Financial Planning And Analysis Reporting Software Dashboard
This slide represents a dashboard highlighting the report prepared by the financial planning and analysis team. It includes net product revenue, gross margin, cost of goods sold etc. Introducing our Financial Planning And Analysis Reporting Software Dashboard set of slides. The topics discussed in these slides are Financial Planning Analysis, Reporting Software Dashboard. This is an immediately available PowerPoint presentation that can be conveniently customized. Download it and convince your audience.
-
 Leadership Coaching Analytics And Performance Reporting Dashboard
This slide shows leadership coaching analytics and performance reporting dashboard which can be referred by training managers to review their modules along with trainees abilities. It contains information about trainee types, type of training. levels of change management competency and levels of coaching needed. Introducing our Leadership Coaching Analytics And Performance Reporting Dashboard set of slides. The topics discussed in these slides are Leadership Coaching Analytics, Performance Reporting Dashboard. This is an immediately available PowerPoint presentation that can be conveniently customized. Download it and convince your audience.
-
 Monthly Sales Report Dashboard Snapshot With Churn Rate
The following slide highlights the monthly sales report dashboard snapshot with churn rate. It showcases details for current month sales, total revenue, current month profit, current month cost, sales revenue, current month expense, revenue churn rate and accumulated revenue. Presenting our well structured Monthly Sales Report Dashboard With Churn Rate. The topics discussed in this slide are Current Month Sales, Total Revenue, Current Month Expense. This is an instantly available PowerPoint presentation that can be edited conveniently. Download it right away and captivate your audience.
-
 Machinery Spare Parts Inventory Dashboard Status Report
This slide depicts the dashboard for stock in the automobile company warehouse. It includes available quantity, reorder, in delivery, stock value, average net profit, value of sold and received inventory. Presenting our well structured Machinery Spare Parts Inventory Dashboard Status Report. The topics discussed in this slide are Machinery Spare Parts, Inventory Dashboard. This is an instantly available PowerPoint presentation that can be edited conveniently. Download it right away and captivate your audience.
-
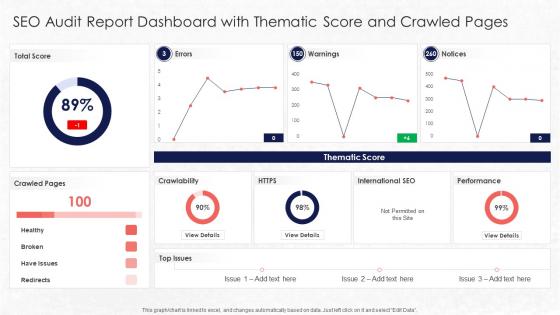 SEO Audit Report Dashboard With Thematic Score Evaluate The Current State Of Clients Website Traffic
Present the topic in a bit more detail with this SEO Audit Report Dashboard With Thematic Score Evaluate The Current State Of Clients Website Traffic. Use it as a tool for discussion and navigation on Thematic Score, Crawled Pages, Crawlability. This template is free to edit as deemed fit for your organization. Therefore download it now.
-
 Marketing Playbook On Privacy Google Data Studio To Build Real Time Reporting Dashboards
This template covers tools to measure marketing analytics such as google analytics for all web tracking, google data studio to build real-time reporting dashboards and google data studio reports. Deliver an outstanding presentation on the topic using this Marketing Playbook On Privacy Google Data Studio To Build Real Time Reporting Dashboards. Dispense information and present a thorough explanation of Mobile System, Operating Breakdown, Mobile Geographic Report, Mobile Sessions Medium using the slides given. This template can be altered and personalized to fit your needs. It is also available for immediate download. So grab it now.
-
 Profiling Report Dashboard Snapshot Depicting Attributes Of Data Quality
This slide shows profiling report dashboard snapshot depicting attributes of data quality which can help in accessing the processing speed and yearly analysis of data performance. It contains information about overall score, rows processed, failed rows, comprehensiveness, efficiency, legitimacy, precision, regularity, exceptionality, etc.Introducing our Profiling Report Dashboard Depicting Attributes Of Data Quality set of slides. The topics discussed in these slides are Comprehensiveness, Legitimacy, Efficiency This is an immediately available PowerPoint presentation that can be conveniently customized. Download it and convince your audience.
-
 Product Performance Dashboard Annual Product Performance Report Ppt Sample
The following slide displays the product performance dashboard as it highlights the top product by revenue, online vs in store purchase, the sales by campaign. Present the topic in a bit more detail with this Product Performance Dashboard Annual Product Performance Report Ppt Sample. Use it as a tool for discussion and navigation on Product Performance Dashboard. This template is free to edit as deemed fit for your organization. Therefore download it now.
-
 Product Performance Dashboards Annual Product Performance Report Ppt Rules
The following slide displays the dashboard which highlights the performance of the product, multiple metrics such as Revenues, New customer, gross profit, customer satisfaction and global sales breakdown. Deliver an outstanding presentation on the topic using this Product Performance Dashboards Annual Product Performance Report Ppt Rules. Dispense information and present a thorough explanation of Product Performance Dashboards using the slides given. This template can be altered and personalized to fit your needs. It is also available for immediate download. So grab it now.
-
 Dashboard Snapshot Survey Results Report For Mobile Operating System
This graph or chart is linked to excel, and changes automatically based on data. Just left click on it and select Edit Data. Introducing our Dashboard Snapshot Survey Results Report For Mobile Operating System set of slides. The topics discussed in these slides are Survey Results, Survey Details, Completed Survey, Reviewed Survey. This is an immediately available PowerPoint presentation that can be conveniently customized. Download it and convince your audience.
-
 Assembly Lines Production Report Dashboard
This slide illustrates graphical representation of product assembly lines facts and figures. It includes production this week, trend in production, summary and production lines distribution etc. Introducing our Assembly Lines Production Report Dashboard set of slides. The topics discussed in these slides are Production This Week, Trend In Production, Production Line Distribution. This is an immediately available PowerPoint presentation that can be conveniently customized. Download it and convince your audience.
-
 Weekly Assembly Lines Production Report Dashboard Snapshot
This slide illustrates production numbers of the assembly lines of a corporation. It includes total produced units, production scrap, rate of scrap, efficiency, etc. Introducing our Weekly Assembly Lines Production Report Dashboard set of slides. The topics discussed in these slides are Total Produced Units, Production Scrap, Production Efficiency. This is an immediately available PowerPoint presentation that can be conveniently customized. Download it and convince your audience.
-
 Data Lake Formation With AWS Cloud Centralized Repository Data Lake Reporting Dashboard
This slide represents the data lake reporting dashboard by covering the total number of users, total lake size, trusted zone size, conversion rate, and retention. Deliver an outstanding presentation on the topic using this Data Lake Formation With AWS Cloud Centralized Repository Data Lake Reporting Dashboard. Dispense information and present a thorough explanation of Centralized Repository, Data Lake Reporting, Dashboard using the slides given. This template can be altered and personalized to fit your needs. It is also available for immediate download. So grab it now.
-
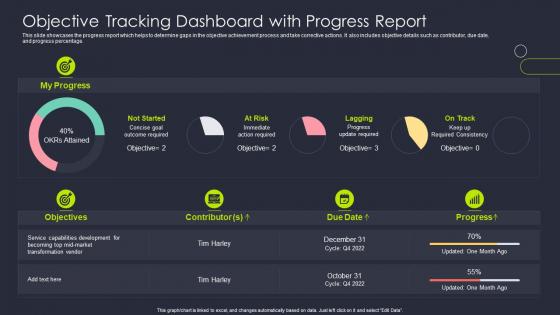 Objective Tracking Dashboard Snapshot With Progress Report
This slide showcases the progress report which helps to determine gaps in the objective achievement process and take corrective actions. It also includes objective details such as contributor, due date, and progress percentage. Presenting our well-structured Objective Tracking Dashboard With Progress Report. The topics discussed in this slide are Not Started, At Risk, Lagging, On Track. This is an instantly available PowerPoint presentation that can be edited conveniently. Download it right away and captivate your audience.
-
 Test Automation Framework Dashboard Indicating Reported Issues And Results
This slide showcase test automation framework dashboard indicating reported issues and results which can benefit IT firms in quick resolution of these problems. It contains information about weekly total, test results and details. It also includes information about passed, known issue, avoided, ended, queued, etc. Presenting our well structured Test Automation Framework Dashboard Indicating Reported Issues And Results. The topics discussed in this slide are Test Automation, Framework Dashboard, Reported Issues And Results. This is an instantly available PowerPoint presentation that can be edited conveniently. Download it right away and captivate your audience.
-
 Annual Business Financial Report Dashboard Snapshot
This slide shows annual financial report dashboard snapshot of company to monitor yearly business performance. It includes various indicators such as revenue, net profits, costs and breakdown of cost Introducing our Annual Business Financial Report Dashboard set of slides. The topics discussed in these slides are Revenue, Costs, Net Profit, Breakdown Of Costs. This is an immediately available PowerPoint presentation that can be conveniently customized. Download it and convince your audience.


