Powerpoint Templates and Google slides for Measure Performance
Save Your Time and attract your audience with our fully editable PPT Templates and Slides.
-
 Company Reorganization Process Performance Measurement After Restructuring
This slide covers the KPIs such as sales vs expenses, expenses by department, sales volumes trend, risk by department, operational effectiveness by department Present the topic in a bit more detail with this Company Reorganization Process Performance Measurement After Restructuring Use it as a tool for discussion and navigation on Performance Measurement After Restructuring Organization This template is free to edit as deemed fit for your organization. Therefore download it now.
-
 Performance Measurement After Restructuring Organization Organizational Restructuring
This slide covers the KPIs such as sales vs expenses, expenses by department, sales volumes trend, risk by department, operational effectiveness by department.deliver an outstanding presentation on the topic using this Performance Measurement After Restructuring Organization Organizational Restructuring Dispense information and present a thorough explanation of Performance Measurement After Restructuring Organization using the slides given. This template can be altered and personalized to fit your needs. It is also available for immediate download. So grab it now.
-
 Organization Resource Planning Dashboard To Measure Performance Of Erp Implementation
This slide describes the dashboard to measure the performance of ERP implementation, and it is coving details of production and revenues. Deliver an outstanding presentation on the topic using this Organization Resource Planning Dashboard To Measure Performance Of Erp Implementation. Dispense information and present a thorough explanation of Measure, Performance, Implementation using the slides given. This template can be altered and personalized to fit your needs. It is also available for immediate download. So grab it now.
-
 It service integration after merger dashboard to measure business performance
Mentioned slide portrays a dashboard for measuring business performance. Performance metrics covered in the slide are average weekly sales revenue, average revenue per unit, customer lifetime value and customer acquisition cost.Deliver an outstanding presentation on the topic using this IT Service Integration After Merger Dashboard To Measure Business Performance Dispense information and present a thorough explanation of Average Revenue, Customer Lifetime Value, Customer Acquisition Cost using the slides given. This template can be altered and personalized to fit your needs. It is also available for immediate download. So grab it now.
-
 Strategic approach develop organization identifying metrics measuring team performance
This slide aims to identify key metrics for measuring and evaluating team performance and also highlighting team performance state before program implementation and expected performance post program implementation with score rating ranging between 1 to 10. Present the topic in a bit more detail with this Strategic Approach Develop Organization Identifying Metrics Measuring Team Performance. Use it as a tool for discussion and navigation on Identifying Key Metrics For Measuring Team Performance. This template is free to edit as deemed fit for your organization. Therefore download it now.
-
 Dashboard To Measure Business Performance Developing Managing Product Portfolio
This slide illustrates a dashboard that can be used by a product manager to measure the business performance. Metrics covered in the dashboard are revenue, launches, cash flow, EPS, average revenue by product and average cost by phase. Deliver an outstanding presentation on the topic using this Dashboard To Measure Business Performance Developing Managing Product Portfolio. Dispense information and present a thorough explanation of Dashboard To Measure Business Performance using the slides given. This template can be altered and personalized to fit your needs. It is also available for immediate download. So grab it now.
-
 Real Time Analytics Dashboard To Measure Marketing Campaign Performance
The purpose of this slide is to outline analytics dashboard to evaluate the success rate of marketing campaign performance. It provides information about metrics such as clicks, impressions, spend, conversions, site audit score, audience growth, etc. Introducing our Real Time Analytics Dashboard To Measure Marketing Campaign Performance set of slides. The topics discussed in these slides are Analytics, Dashboard, Performance. This is an immediately available PowerPoint presentation that can be conveniently customized. Download it and convince your audience.
-
 Financial Numbers To Measures The Performance Of Sales Executive
Introducing our Financial Numbers To Measures The Performance Of Sales Executive set of slides. The topics discussed in these slides are Opportunity Ratio, Sales Team, Leads. This is an immediately available PowerPoint presentation that can be conveniently customized. Download it and convince your audience.
-
 Sales Dashboard With Numbers To Measure Company Performance
Introducing our Sales Dashboard With Numbers To Measure Company Performance set of slides. The topics discussed in these slides are Cost Breakdown, Sales Revenue, Accumulated Revenue. This is an immediately available PowerPoint presentation that can be conveniently customized. Download it and convince your audience.
-
 Dashboard Measuring Support Performance Improving Employee Performance Management
This slide represents the support team performance dashboard that includes unassigned, open, solved, escalated, occupancy rate, top agen ts, net promoter score, average first contact resolution rate, etc. Present the topic in a bit more detail with this Dashboard Measuring Support Performance Improving Employee Performance Management. Use it as a tool for discussion and navigation on Dashboard, Measuring, Performance. This template is free to edit as deemed fit for your organization. Therefore download it now.
-
 B2B Prospects Performance Measurement B2B Account Marketing Strategies Playbook
This slide provides information regarding B2B performance tracking dashboard to measure leads, MQL, SQL, customers, revenue goals, total media spend. Deliver an outstanding presentation on the topic using this B2B Prospects Performance Measurement B2B Account Marketing Strategies Playbook. Dispense information and present a thorough explanation of B2B Prospects Performance Measurement Dashboard using the slides given. This template can be altered and personalized to fit your needs. It is also available for immediate download. So grab it now.
-
 Business Planning Software Dashboard To Measure Performance
This slide describes the dashboard to measure the performance of ERP implementation, and it is coving details of production and revenues. Deliver an outstanding presentation on the topic using this Business Planning Software Dashboard To Measure Performance. Dispense information and present a thorough explanation of Dashboard To Measure Performance Of ERP Implementation using the slides given. This template can be altered and personalized to fit your needs. It is also available for immediate download. So grab it now.
-
 Business performance measuring kpi dashboard effective brand building strategy
Following slide covers business performance dashboard of the firm. It include KPIs such as average weekly sales revenue, above sales target, sales revenue and profit generated. Deliver an outstanding presentation on the topic using this Business Performance Measuring KPI Dashboard Effective Brand Building Strategy. Dispense information and present a thorough explanation of Average Revenue Per Unit, Customer Lifetime Value, Customer Acquisition Cost using the slides given. This template can be altered and personalized to fit your needs. It is also available for immediate download. So grab it now.
-
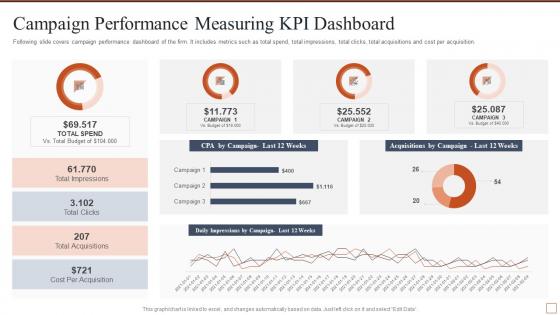 Campaign performance measuring kpi dashboard effective brand building strategy
Present the topic in a bit more detail with this Campaign Performance Measuring KPI Dashboard Effective Brand Building Strategy. Use it as a tool for discussion and navigation on Campaign Performance Measuring KPI DashboardFollowing slide covers campaign performance dashboard of the firm. It includes metrics such as total spend, total impressions, total clicks, total acquisitions and cost per acquisition. . This template is free to edit as deemed fit for your organization. Therefore download it now.
-
 Product management dashboard to measure performance implementing product lifecycle
This slide focuses on product management dashboard to measure performance that includes actions, active users, new document uploads with percent change, signatures, new promoter score, etc. Present the topic in a bit more detail with this Product Management Dashboard To Measure Performance Implementing Product Lifecycle. Use it as a tool for discussion and navigation on Active Users, Action Distribution, Signatures, Net Promoter Score. This template is free to edit as deemed fit for your organization. Therefore download it now.
-
 Prospects Performance Measurement Dashboard B2b Sales Content Management Playbook
This slide provides information regarding B2B performance tracking dashboard to measure leads, MQL, SQL, customers, revenue goals, total media spend. Present the topic in a bit more detail with this Prospects Performance Measurement Dashboard B2b Sales Content Management Playbook. Use it as a tool for discussion and navigation on Performance, Measurement, Dashboard. This template is free to edit as deemed fit for your organization. Therefore download it now.
-
 Performance KPI Dashboard To Measure Results Of Paid Social Media Plan
Following slide showcases a dashboard which can be used by organization to track the results of paid social media plan. The template provides information about key metrices such as social media status, engaged users, page impressions, page likes etc. Presenting our well structured Performance KPI Dashboard To Measure Results Of Paid Social Media Plan. The topics discussed in this slide are Performance KPI Dashboard To Measure Results Of Paid Social Media Plan. This is an instantly available PowerPoint presentation that can be edited conveniently. Download it right away and captivate your audience.
-
 Establishing Plan For Successful Project Management Dashboard To Measure Performance
This slide covers the project management dashboard which includes status of project phases such as planning, designing, development and testing that also focuses on launch date of project, overdue tasks with date, deadline, etc. and workload on employees. Deliver an outstanding presentation on the topic using this Establishing Plan For Successful Project Management Dashboard To Measure Performance. Dispense information and present a thorough explanation of Dashboard, Measure, Performance using the slides given. This template can be altered and personalized to fit your needs. It is also available for immediate download. So grab it now.
-
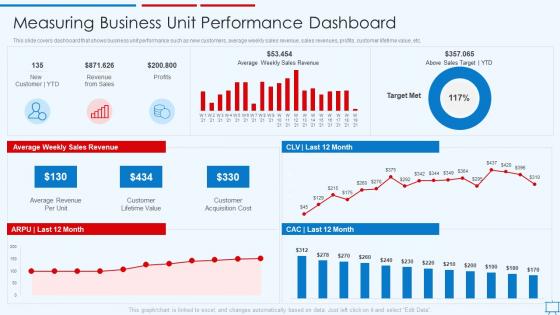 Building Competitive Strategies Successful Leadership Measuring Business Unit Performance
This slide covers dashboard that shows business unit performance such as new customers, average weekly sales revenue, sales revenues, profits, customer lifetime value, etc. Deliver an outstanding presentation on the topic using this Building Competitive Strategies Successful Leadership Measuring Business Unit Performance. Dispense information and present a thorough explanation of Performance, Dashboard, Business using the slides given. This template can be altered and personalized to fit your needs. It is also available for immediate download. So grab it now.
-
 Ensuring Leadership Product Innovation Processes Measuring Business Unit Performance Dashboard
This slide covers dashboard that shows business unit performance such as new customers, average weekly sales revenue, sales revenues, profits, customer lifetime value, etc. Present the topic in a bit more detail with this Ensuring Leadership Product Innovation Processes Measuring Business Unit Performance Dashboard. Use it as a tool for discussion and navigation on Business, Performance, Dashboard. This template is free to edit as deemed fit for your organization. Therefore download it now.
-
 Investing In Technology And Innovation Performance Measurement Kpi Dashboard
Following slide portrays performance measurement dashboard for FinTech companies with KPIs namely available cash, cash flow, ROA, working capital ratio, days sales outstanding and days payable outstanding. Present the topic in a bit more detail with this Investing In Technology And Innovation Performance Measurement Kpi Dashboard. Use it as a tool for discussion and navigation on Working Capital Ratio, Sales, Target, Payment. This template is free to edit as deemed fit for your organization. Therefore download it now.
-
 Go To Market Strategy For New Product Dashboard To Measure Sales Rep Performance
This slide illustrates sales representative performance measurement dashboard with key metrics such as average first contact resolution rate, occupancy rate, NPS and top agents by solved tickets. Present the topic in a bit more detail with this Go To Market Strategy For New Product Dashboard To Measure Sales Rep Performance. Use it as a tool for discussion and navigation on Dashboard To Measure Sales Rep Performance. This template is free to edit as deemed fit for your organization. Therefore download it now.
-
 IT Integration Post Mergers And Acquisition Dashboard To Measure Business Performance
Mentioned slide portrays a dashboard for measuring business performance. Performance metrics covered in the slide are average weekly sales revenue, average revenue per unit, customer lifetime value and customer acquisition cost. Deliver an outstanding presentation on the topic using this IT Integration Post Mergers And Acquisition Dashboard To Measure Business Performance. Dispense information and present a thorough explanation of Average Weekly Sales Revenue, Above Sales Target I YTD, Average Revenue Per Unit, Customer Lifetime Value, New Customer I YTD using the slides given. This template can be altered and personalized to fit your needs. It is also available for immediate download. So grab it now.
-
 Cash flow dashboard snapshot measure sustainability key performance indicators
Following slide covers cash flow dashboard snapshot covering details like beginning cash on hand, cash going in, cash going out, profit or loss and ending cash on hand. It also includes detail of accounts receivable and payable. Present the topic in a bit more detail with this Cash Flow Dashboard Measure Sustainability Key Performance Indicators. Use it as a tool for discussion and navigation on Beginning Cash On Hand, Cash Going, Cash Going Out, Profit, Loss, Ending Cash Hand. This template is free to edit as deemed fit for your organization. Therefore download it now.
-
 Customer satisfaction dashboard snapshot measure sustainability key performance indicators
Mentioned slide covers customer satisfaction dashboard with a 12-month format. It includes customer satisfaction details by region and by district. Present the topic in a bit more detail with this Customer Satisfaction Dashboard Snapshot Measure Sustainability Key Performance Indicators. Use it as a tool for discussion and navigation on Best Demonstrated, Worst Demonstrated, Avg Variance Target. This template is free to edit as deemed fit for your organization. Therefore download it now.
-
 Customer service dashboard snapshot measure sustainability key performance indicators
Following slide illustrates customer service dashboard covering details such as request answered, total requests, total revenue and support cost revenue. It also includes customer satisfaction score, customer retention in a 12 months format. Deliver an outstanding presentation on the topic using this Customer Service Dashboard Snapshot Measure Sustainability Key Performance Indicators. Dispense information and present a thorough explanation of Costs Per Support, Avg. Time To Solve Issue, Customer Retention, Request Volume Vs Service Level, Customer Satisfaction using the slides given. This template can be altered and personalized to fit your needs. It is also available for immediate download. So grab it now.
-
 Measure sustainability key performance indicators cash flow dashboard
Mentioned slide covers cash flow dashboard. It shows detailed cash flow status in a 12 months format and working capital with accounts receivable and payable details. Present the topic in a bit more detail with this Measure Sustainability Key Performance Indicators Cash Flow Dashboard. Use it as a tool for discussion and navigation on Cash Flow, Days Sales Outstanding, Projected, Working Capital. This template is free to edit as deemed fit for your organization. Therefore download it now.
-
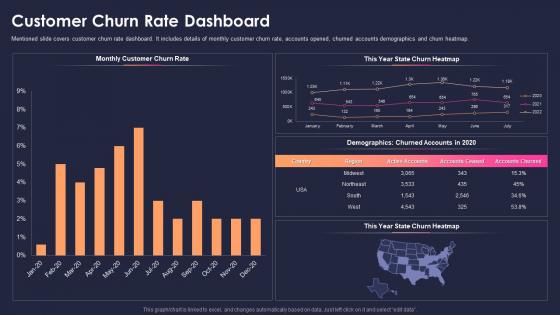 Measure sustainability key performance indicators customer churn rate dashboard
Mentioned slide covers customer churn rate dashboard. It includes details of monthly customer churn rate, accounts opened, churned accounts demographics and churn heatmap. Deliver an outstanding presentation on the topic using this Measure Sustainability Key Performance Indicators Customer Churn Rate Dashboard. Dispense information and present a thorough explanation of Monthly Customer, Churn Rate, Demographics, Churned Accounts 2020 using the slides given. This template can be altered and personalized to fit your needs. It is also available for immediate download. So grab it now.
-
 Measure sustainability key performance indicators customer lifetime value dashboard
This slide covers customer lifetime value dashboard. It covers details of average customer lifetime and average lifetime value in a 12 months format. Present the topic in a bit more detail with this Measure Sustainability Key Performance Indicators Customer Lifetime Value Dashboard. Use it as a tool for discussion and navigation on Average Customer Lifetime, Average Lifetime Value. This template is free to edit as deemed fit for your organization. Therefore download it now.
-
 Measure sustainability key performance indicators customer satisfaction dashboard
Following slide shows customer satisfaction dashboard covering net promoter score. It also includes customer retention metrics with a 12-month format. Deliver an outstanding presentation on the topic using this Measure Sustainability Key Performance Indicators Customer Satisfaction Dashboard. Dispense information and present a thorough explanation of Net Promoter Score, Customer Retention, Promoters, Passives, Detractors using the slides given. This template can be altered and personalized to fit your needs. It is also available for immediate download. So grab it now.
-
 Measure sustainability key performance indicators customer service dashboard
This slide covers customer service dashboard. It includes weekly details of number of support incidents, average first response time, average resolution time, abandon rate, average waiting time and first contact resolution. Present the topic in a bit more detail with this Measure Sustainability Key Performance Indicators Customer Service Dashboard. Use it as a tool for discussion and navigation on Number support incident week, Resolution Time by Channel, Average First Response Time, Average Resolution Time, First Contact Resolution . This template is free to edit as deemed fit for your organization. Therefore download it now.
-
 Measure sustainability key performance indicators effective rate metrics customer
This slide covers effective rate metrics. It shows over year over comparison of effective rate per customer as well as effective rate per offering. Present the topic in a bit more detail with this Measure Sustainability Key Performance Indicators Effective Rate Metrics Customer. Use it as a tool for discussion and navigation on Effective Rate per Customer, Effective Rate per Offering. This template is free to edit as deemed fit for your organization. Therefore download it now.
-
 Measure sustainability key performance indicators employee billable hours
Following slide shows employee billable hours dashboard covering total hours capacity, allocated hours billable, total hours worked, and total billable hours worked for the assignment. It also includes details of each team member indulged for same assignment. Deliver an outstanding presentation on the topic using this Measure Sustainability Key Performance Indicators Employee Billable Hours. Dispense information and present a thorough explanation of Total Capacity, Allocated Billable, Total Worked, Total Billable Worked using the slides given. This template can be altered and personalized to fit your needs. It is also available for immediate download. So grab it now.
-
 Measure sustainability key performance indicators employee engagement company culture
Following slide shows employee engagement and company culture dashboard. It includes employee details, engagement score, total given recognition, previous seven days performance and radar chart to measure employee performance. Present the topic in a bit more detail with this Measure Sustainability Key Performance Indicators Employee Engagement Company Culture. Use it as a tool for discussion and navigation on Employee Details, Total Submission, Engagement Score, Total Given Recognition. This template is free to edit as deemed fit for your organization. Therefore download it now.
-
 Measure sustainability key performance indicators financial performance indicator dashboard snapshot
This slide shows financial performance indicator dashboard covering net profit and net sales, profitability indicator ratios, cogs and net profit by region or channel. Deliver an outstanding presentation on the topic using this Measure Sustainability Key Performance Indicators Financial Performance Indicator Dashboard Snapshot. Dispense information and present a thorough explanation of Net Profit and Net Sales, Profitability Indicator Ratios, Cost of Goods Sold Breakdown, Net Profit, Past Year vs Target vs Actual using the slides given. This template can be altered and personalized to fit your needs. It is also available for immediate download. So grab it now.
-
 Measure sustainability key performance indicators key financials of the company
Following slide provides financial details of company including revenue and operating profit. Revenue recorded in FY20 was dollar 518,932 while operating profit recorded was dollar 481,932. Present the topic in a bit more detail with this Measure Sustainability Key Performance Indicators Key Financials Of The Company. Use it as a tool for discussion and navigation on Revenue, Operating Profit. This template is free to edit as deemed fit for your organization. Therefore download it now.
-
 Measure sustainability key performance indicators product pricing strategy we will adopt
This slide shows current and future product pricing strategy of the company. In current strategy, company opted cost plus pricing to recover their profits and in future they will opt penetration pricing for capturing market share. Present the topic in a bit more detail with this Measure Sustainability Key Performance Indicators Product Pricing Strategy We Will Adopt. Use it as a tool for discussion and navigation on Strategy, Cost Plus Pricing, Penetration Pricing, Our Goal. This template is free to edit as deemed fit for your organization. Therefore download it now.
-
 Measure sustainability key performance indicators profit margin measuring kpi dashboard
Following slide illustrates profit margin dashboard with a 12 months format. It also includes gross profit margin, operating profit margin and net profit margin. Deliver an outstanding presentation on the topic using this Measure Sustainability Key Performance Indicators Profit Margin Measuring KPI Dashboard. Dispense information and present a thorough explanation of Gross Profit Margin, Operating Profit Margin, Net Profit Margin, 2020 using the slides given. This template can be altered and personalized to fit your needs. It is also available for immediate download. So grab it now.
-
 Measure sustainability key performance indicators real time utilization dashboard
This slide covers real time utilization dashboard covering logged time such as billable, non-billable, estimated time and scheduled. It also include details of allotted hours to each employee and weekly hours for the assignment. Present the topic in a bit more detail with this Measure Sustainability Key Performance Indicators Real Time Utilization Dashboard. Use it as a tool for discussion and navigation on Logged Time, Estimated Time, Nonbillable, Billable. This template is free to edit as deemed fit for your organization. Therefore download it now.
-
 Measure sustainability key performance indicators revenue and employment cost dashboard
Mentioned slide covers revenue and employment cost dashboard. It includes details like full time employee number, total employment cost, total revenue and average revenue per FTE. Present the topic in a bit more detail with this Measure Sustainability Key Performance Indicators Revenue And Employment Cost Dashboard. Use it as a tool for discussion and navigation on Full Time Employee, Total Revenue, Total Employee Cost, Average Revenue Per FTF. This template is free to edit as deemed fit for your organization. Therefore download it now.
-
 B2b sales playbook prospects performance measurement dashboard
This slide provides information regarding B2B performance tracking dashboard to measure leads, MQL, SQL, customers, revenue goals, total media spend. Deliver an outstanding presentation on the topic using this B2b Sales Playbook Prospects Performance Measurement Dashboard. Dispense information and present a thorough explanation of Performance, Measurement, Dashboard using the slides given. This template can be altered and personalized to fit your needs. It is also available for immediate download. So grab it now.
-
 KPI Dashboard To Measure Overall Business Performance Guide For Web Developers
Deliver an outstanding presentation on the topic using this KPI Dashboard To Measure Overall Business Performance Guide For Web Developers. Dispense information and present a thorough explanation of KPI Dashboard To Measure Overall Business Performance using the slides given. This template can be altered and personalized to fit your needs. It is also available for immediate download. So grab it now.
-
 Delivering Efficiency By Innovating Product Measuring Business Unit Performance Dashboard
This slide covers dashboard that shows business unit performance such as new customers, average weekly sales revenue, sales revenues, profits, customer lifetime value, etc. Present the topic in a bit more detail with this Delivering Efficiency By Innovating Product Measuring Business Unit Performance Dashboard. Use it as a tool for discussion and navigation on Business, Performance, Dashboard. This template is free to edit as deemed fit for your organization. Therefore download it now.
-
 Kpi Dashboard To Measure Partner Performance Ensuring Business Success Maintaining
Mentioned slide showcase KPI dashboard that can be used by a company to measure its partner performance. KPIS covered in the dashboard are revenue, number of pipelines closed and amount of pipeline closed versus business plan target. Present the topic in a bit more detail with this Kpi Dashboard To Measure Partner Performance Ensuring Business Success Maintaining. Use it as a tool for discussion and navigation on Kpi Dashboard To Measure Partner Performance. This template is free to edit as deemed fit for your organization. Therefore download it now.
-
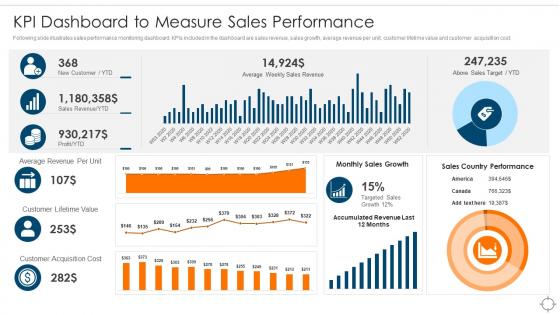 Kpi Dashboard To Measure Sales Performance Ensuring Business Success Maintaining
Following slide illustrates sales performance monitoring dashboard. KPIs included in the dashboard are sales revenue, sales growth, average revenue per unit, customer lifetime value and customer acquisition cost. Deliver an outstanding presentation on the topic using this Kpi Dashboard To Measure Sales Performance Ensuring Business Success Maintaining. Dispense information and present a thorough explanation of Kpi Dashboard To Measure Sales Performance using the slides given. This template can be altered and personalized to fit your needs. It is also available for immediate download. So grab it now.
-
 KPI Dashboard to Measure Overall Business Performance App developer playbook
Deliver an outstanding presentation on the topic using this KPI Dashboard To Measure Overall Business Performance App Developer Playbook. Dispense information and present a thorough explanation of KPI Dashboard To Measure Overall Business Performance using the slides given. This template can be altered and personalized to fit your needs. It is also available for immediate download. So grab it now.
-
 Playbook For Developers Kpi Dashboard To Measure Overall Business Performance
Present the topic in a bit more detail with this Playbook For Developers Kpi Dashboard To Measure Overall Business Performance. Use it as a tool for discussion and navigation on Business, Performance, Dashboard. This template is free to edit as deemed fit for your organization. Therefore download it now.
-
 Customer Performance Measuring Post Merger It Service Integration
This slide illustrates customer service dashboard covering informational stats about NPS score, growth rate, customer distribution, top customer locations, inbound leads and revenue by type. Present the topic in a bit more detail with this Customer Performance Measuring Post Merger It Service Integration. Use it as a tool for discussion and navigation on Customer Performance Measuring Service Dashboard. This template is free to edit as deemed fit for your organization. Therefore download it now.
-
 Managing And Innovating Product Management Measuring Business Unit Performance
This slide covers dashboard that shows business unit performance such as new customers, average weekly sales revenue, sales revenues, profits, customer lifetime value, etc. Deliver an outstanding presentation on the topic using this Managing And Innovating Product Management Measuring Business Unit Performance. Dispense information and present a thorough explanation of Business, Performance, Dashboard using the slides given. This template can be altered and personalized to fit your needs. It is also available for immediate download. So grab it now.
-
 Corporate Restructuring Performance Measurement After Restructuring Organization
This slide covers the KPIs such as sales vs expenses, expenses by department, sales volumes trend, risk by department, operational effectiveness by department. Present the topic in a bit more detail with this Corporate Restructuring Performance Measurement After Restructuring Organization. Use it as a tool for discussion and navigation on Performance, Measurement, Organization. This template is free to edit as deemed fit for your organization. Therefore download it now.
-
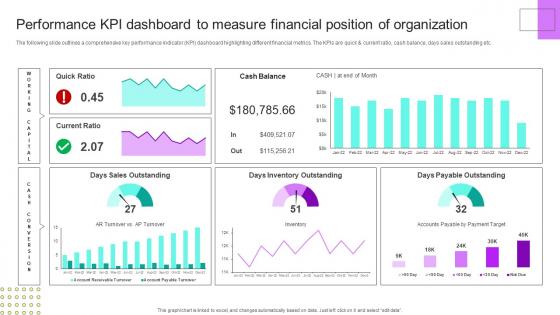 Performance Kpi Dashboard Measure Financial Position Financial Planning Analysis Guide Small Large Businesses
The following slide outlines a comprehensive key performance indicator KPI dashboard highlighting different financial metrics. The KPIs are quick and current ratio, cash balance, days sales outstanding etc. Deliver an outstanding presentation on the topic using this Performance Kpi Dashboard Measure Financial Position Financial Planning Analysis Guide Small Large Businesses. Dispense information and present a thorough explanation of Organization, Performance, Dashboard using the slides given. This template can be altered and personalized to fit your needs. It is also available for immediate download. So grab it now.
-
 Metric Dashboard To Measure Product Performance Product Development And Management Strategy
This slide represents KPI dashboard for measuring product performance. It covers total activities, new customers, events, net promoter score etc. Present the topic in a bit more detail with this Metric Dashboard To Measure Product Performance Product Development And Management Strategy. Use it as a tool for discussion and navigation on Measure, Product, Performance. This template is free to edit as deemed fit for your organization. Therefore download it now.
-
 Automatic Technology Dashboard To Measure Performance Of RPA Implementation
This slide represents the critical performance indicators of RPA, such as time and money saved by different processes and the efficiency of the HR department in routine tasks. Present the topic in a bit more detail with this Automatic Technology Dashboard To Measure Performance Of RPA Implementation. Use it as a tool for discussion and navigation on Supply Chain, Finance, Process Money. This template is free to edit as deemed fit for your organization. Therefore download it now.
-
 KPI Dashboard To Measure Overall Business Performance Playbook For App Design And Development
Present the topic in a bit more detail with this KPI Dashboard To Measure Overall Business Performance Playbook For App Design And Development Use it as a tool for discussion and navigation on Sales Comparison, Product Category, Brand Profitability This template is free to edit as deemed fit for your organization. Therefore download it now.
-
 Dashboard To Measure Performance Of Rpa Implementation Robotic Process Automation Types
This slide represents the critical performance indicators of RPA, such as time and money saved by different processes and the efficiency of the HR department in routine tasks. Present the topic in a bit more detail with this Dashboard To Measure Performance Of Rpa Implementation Robotic Process Automation Types. Use it as a tool for discussion and navigation on Dashboard, Measure, Performance. This template is free to edit as deemed fit for your organization. Therefore download it now.
-
 Metrics To Measure Sales Team Performance Creating Competitive Sales Strategy
This slide focuses on metrics to measure sales team performance that covers total sales, revenue, profit, cost, incremental sales, accumulated revenue, cost breakdown, etc. Present the topic in a bit more detail with this Metrics To Measure Sales Team Performance Creating Competitive Sales Strategy. Use it as a tool for discussion and navigation on Total Sales, Profit, Accumulated Revenue. This template is free to edit as deemed fit for your organization. Therefore download it now.
-
 QBR Dashboard To Measure Overall Business Performance
The following slide highlights a comprehensive quarterly business review QBR dashboard which can be used by the organization to evaluate business performance. The metrics used for review are total revenue, new customers, gross profit, overall costs, sales comparison, sales by different products and top performing channels. Introducing our QBR Dashboard To Measure Overall Business Performance set of slides. The topics discussed in these slides are Revenue, New Customer, Gross Profit, Total Costs. This is an immediately available PowerPoint presentation that can be conveniently customized. Download it and convince your audience.
-
 B2B Sales Best Practices Playbook B2B Prospects Performance Measurement Dashboard
This slide provides information regarding B2B performance tracking dashboard to measure leads, MQL, SQL, customers, revenue goals, total media spend. Present the topic in a bit more detail with this B2B Sales Best Practices Playbook B2B Prospects Performance Measurement Dashboard. Use it as a tool for discussion and navigation on Revenue Goal, Cost Per Lead, Customers. This template is free to edit as deemed fit for your organization. Therefore download it now.
-
 B2b Prospects Performance Measurement Dashboard B2b Sales Representatives Guidelines Playbook
This slide provides information regarding B2B performance tracking dashboard to measure leads, MQL, SQL, customers, revenue goals, total media spend. Deliver an outstanding presentation on the topic using this B2b Prospects Performance Measurement Dashboard B2b Sales Representatives Guidelines Playbook. Dispense information and present a thorough explanation of Performance, Measurement, Dashboard using the slides given. This template can be altered and personalized to fit your needs. It is also available for immediate download. So grab it now.
-
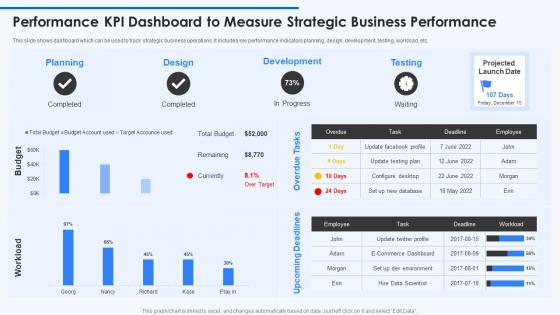 Performance KPI Dashboard To Measure Strategic Business Performance
This slide shows dashboard which can be used to track strategic business operations. It includes key performance indicators planning, design, development, testing, workload, etc. Presenting our well structured Performance KPI Dashboard To Measure Strategic Business Performance. The topics discussed in this slide are Planning, Development, Testing. This is an instantly available PowerPoint presentation that can be edited conveniently. Download it right away and captivate your audience.


