Powerpoint Templates and Google slides for KPI Business
Save Your Time and attract your audience with our fully editable PPT Templates and Slides.
-
 KPI Dashboard Highlighting Business Pain Points
This slide depicts a dashboard which highlights the problems faced by organizations to easily track the issues and offer solutions for the same. The various key performance indicators in this dashboard are pain points by status, unresolved pain points for march 2023 etc. Introducing our KPI Dashboard Highlighting Business Pain Points set of slides. The topics discussed in these slides are KPI Dashboard, Highlighting Business, Pain Points. This is an immediately available PowerPoint presentation that can be conveniently customized. Download it and convince your audience.
-
 Business Continuous Process Improvement KPI Dashboard In Healthcare Industry
Following slides shows the complete outline of healthcare business process improvement KPI dashboard which will assist in providing better services to patients . The major metrics mentioned in a slide are such as average patients discharge by hour or on weekly basis. Introducing our Business Continuous Process Improvement KPI Dashboard In Healthcare Industry set of slides. The topics discussed in these slides are Patient Discharge List, Discharge Of Patients, Bedwatch Ahead This is an immediately available PowerPoint presentation that can be conveniently customized. Download it and convince your audience.
-
 KPI Dashboard For Business Big Financial Data Management
Following slide demonstrates dashboard for tracking financial data which can be used by organisation for effective cashflow management. It includes key elements such as total expenses and incomes, monthly expenses and income, actual and estimated expense and income list.Introducing our KPI Dashboard For Business Big Financial Data Management set of slides. The topics discussed in these slides are Expenses Actual, Monthly Revenue, Budgeted Business. This is an immediately available PowerPoint presentation that can be conveniently customized. Download it and convince your audience.
-
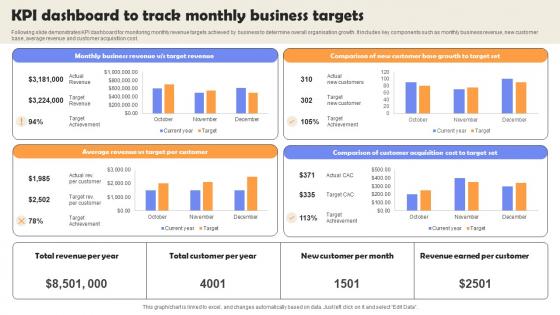 KPI Dashboard To Track Monthly Business Targets
Following slide demonstrates KPI dashboard for monitoring monthly revenue targets achieved by business to determine overall organisation growth. It includes key components such as monthly business revenue, new customer base, average revenue and customer acquisition cost.Presenting our well structured KPI Dashboard To Track Monthly Business Targets. The topics discussed in this slide are Comparison Customer, Total Customer, Acquisition Cost. This is an instantly available PowerPoint presentation that can be edited conveniently. Download it right away and captivate your audience.
-
 Cash Performance Analysis With KPI Dashboard Defining Business Performance Management
The following slide depicts finance performance of company to manage cash transactions and invest finances appropriately. It includes elements such as quick ratio, current ratio, payables outstanding, sales outstanding, working capital etc. Present the topic in a bit more detail with this Cash Performance Analysis With KPI Dashboard Defining Business Performance Management. Use it as a tool for discussion and navigation on Days Sales Outstanding, Inventory Outstanding, Payable Outstanding. This template is free to edit as deemed fit for your organization. Therefore download it now.
-
 Marketing Performance Assessment With KPI Defining Business Performance Management
The following slide depicts the outcomes of marketing performance to facilitate decision making and better understand customers need. It includes elements such as total spending, impressions, clicks, acquisition, campaign budget analysis etc.Present the topic in a bit more detail with this Marketing Performance Assessment With KPI Defining Business Performance Management. Use it as a tool for discussion and navigation on Total Acquisitions, Total Clicks, Total Impressions. This template is free to edit as deemed fit for your organization. Therefore download it now.
-
 Sales Performance Analysis With KPI Dashboard Defining Business Performance Management
The following slide depicts the sales performance to assessment dashboard to compare past and current insights. It includes elements such as new customers, revenue, sales target, customer lifetime, annual acquisition cost,profit etc.Deliver an outstanding presentation on the topic using this Sales Performance Analysis With KPI Dashboard Defining Business Performance Management. Dispense information and present a thorough explanation of Average Revenue, Customer Lifetime Value, Customer Acquisition Cost using the slides given. This template can be altered and personalized to fit your needs. It is also available for immediate download. So grab it now.
-
 KPI Dashboard Highlighting Result Of Marketing Complete Introduction To Business Marketing MKT SS V
The following slide showcases a comprehensive key performance indicator KPI dashboard which can be used to showcase the outcome of marketing campaign. The major metrics covered in the slide are brand mentions, customer lifetime value CLV, customer acquisition cost CAC, net promoter score NPS, etc. Present the topic in a bit more detail with this KPI Dashboard Highlighting Result Of Marketing Complete Introduction To Business Marketing MKT SS V. Use it as a tool for discussion and navigation on Result, Marketing, Campaign. This template is free to edit as deemed fit for your organization. Therefore download it now.
-
 Kpi Dashboard Highlighting Result Business Marketing Strategies Mkt Ss V
The following slide showcases a comprehensive key performance indicator KPI dashboard which can be used to showcase the outcome of marketing campaign. The major metrics covered in the slide are brand mentions, customer lifetime value CLV, customer acquisition cost CAC, net promoter score NPS, etc. Present the topic in a bit more detail with this Kpi Dashboard Highlighting Result Business Marketing Strategies Mkt Ss V Use it as a tool for discussion and navigation on Customers, Campaigns This template is free to edit as deemed fit for your organization. Therefore download it now.
-
 KPI Dashboard To Track Supplier Relationship Management Impact Business Relationship Management To Build
Mentioned slide provides information about various key performance indicators which can be used to evaluate impact of relations management on suppliers performance, it includes key points such as total suppliers, contracted, unlisted, average procurement cycle, suppliers share by different products. etc. Present the topic in a bit more detail with this KPI Dashboard To Track Supplier Relationship Management Impact Business Relationship Management To Build. Use it as a tool for discussion and navigation on Suppliers By Different Products, Procurement Cycle. This template is free to edit as deemed fit for your organization. Therefore download it now.
-
 Kpi Dashboard Highlighting Result Of Marketing Strategies For Start Up Business MKT SS V
The following slide showcases a comprehensive key performance indicator KPI dashboard which can be used to showcase the outcome of marketing campaign. The major metrics covered in the slide are brand mentions, customer lifetime value CLV, customer acquisition cost CAC, net promoter score NPS, etc. Present the topic in a bit more detail with this Kpi Dashboard Highlighting Result Of Marketing Strategies For Start Up Business MKT SS V Use it as a tool for discussion and navigation on Brand, Customers, Campaigns This template is free to edit as deemed fit for your organization. Therefore download it now.
-
 Kpi Dashboard Highlighting Result Of Marketing Creative Business Marketing Ideas MKT SS V
The following slide showcases a comprehensive key performance indicator KPI dashboard which can be used to showcase the outcome of marketing campaign. The major metrics covered in the slide are brand mentions, customer lifetime value CLV, customer acquisition cost CAC, net promoter score NPS, etc. Deliver an outstanding presentation on the topic using this Kpi Dashboard Highlighting Result Of Marketing Creative Business Marketing Ideas MKT SS V Dispense information and present a thorough explanation of Brand, Customers, Campaigns using the slides given. This template can be altered and personalized to fit your needs. It is also available for immediate download. So grab it now.
-
 Viral Campaigns KPI Dashboard With Increasing Business Sales Through Viral Marketing
This slide showcases KPI dashboard which can help marketers in assessing engagement metrics. It provides details about user metrics, direct signups, seed contacts, community members, social KPIs, engagement rate, etc. Deliver an outstanding presentation on the topic using this Viral Campaigns KPI Dashboard With Increasing Business Sales Through Viral Marketing. Dispense information and present a thorough explanation of User Metrics, Social Kpis, Campaign Metrics using the slides given. This template can be altered and personalized to fit your needs. It is also available for immediate download. So grab it now.
-
 ICT Business Security KPI Dashboard ICT Strategic Framework Strategy SS V
This slide represents ICT Information and Communication Technology business security dashboard to track threats and incidents. It covers details regarding issues by control type, risk categories, etc. Present the topic in a bit more detail with this ICT Business Security KPI Dashboard ICT Strategic Framework Strategy SS V. Use it as a tool for discussion and navigation on Standard Control Issues, Control Issues By Regulation, Risk Categories. This template is free to edit as deemed fit for your organization. Therefore download it now.
-
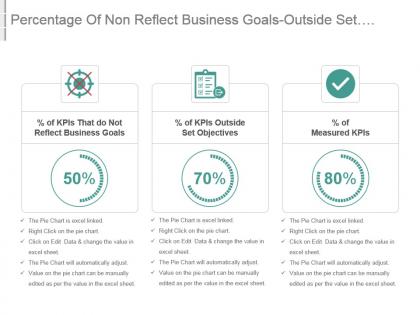 Percentage of non reflect business goals outside set objectives measured kpis ppt slide
Presenting percentage of non reflect business goals outside set objectives measured kpis ppt slide. This presentation slide shows three Key Performance Indicators or KPIs in a Dashboard style design. The first KPI that can be shown is percentage of KPIs That do Not Reflect Business Goals. The second KPI is percentage of KPIs Outside Set Objectives and the third is percentage of Measured KPIs. These KPI Powerpoint graphics are all data driven, and the shape automatically adjusts according to your data. Just right click on the KPI graphic, enter the right value and the shape will adjust automatically. Make a visual impact with our KPI slides.
-
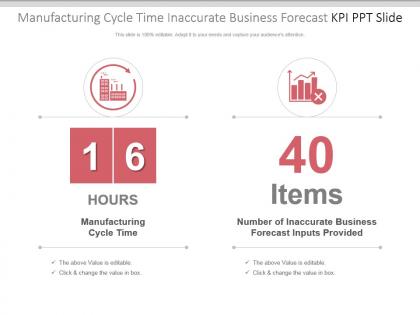 Manufacturing cycle time inaccurate business forecast kpi ppt slide
Presenting manufacturing cycle time inaccurate business forecast kpi ppt slide. This presentation slide shows two Key Performance Indicators or KPIs in a Dashboard style design. The first KPI that can be shown is Manufacturing Cycle Time. The second KPI is Number of Inaccurate Business Forecast Inputs Provided. These KPI Powerpoint graphics are all data driven, and the shape automatically adjusts according to your data. Just right click on the KPI graphic, enter the right value and the shape will adjust automatically. Make a visual impact with our KPI slides.
-
 Business kpi showing employee analysing the graph of companys performance indicator
Presenting this set of slides with name - Business Kpi Showing Employee Analysing The Graph Of Companys Performance Indicator. This is a four stage process. The stages in this process are Business Kpi, Business Dashboard, Business Metrics.
-
 Analytic data chart of business kpi image showing employee working on desktop
Presenting this set of slides with name - Analytic Data Chart Of Business Kpi Image Showing Employee Working On Desktop. This is a three stage process. The stages in this process are Business Kpi, Business Dashboard, Business Metrics.
-
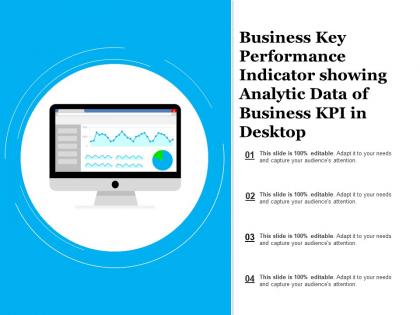 Business key performance indicator showing analytic data of business kpi in desktop
Presenting this set of slides with name - Business Key Performance Indicator Showing Analytic Data Of Business Kpi In Desktop. This is a four stage process. The stages in this process are Business Kpi, Business Dashboard, Business Metrics.
-
 Business kpi contain visualization aid of analytic data in form of bar chart
Presenting this set of slides with name - Business Kpi Contain Visualization Aid Of Analytic Data In Form Of Bar Chart. This is a four stage process. The stages in this process are Business Kpi, Business Dashboard, Business Metrics.
-
 Business kpi showing graphs key performance indicator in tablets and documents
Presenting this set of slides with name - Business Kpi Showing Graphs Key Performance Indicator In Tablets And Documents. This is a four stage process. The stages in this process are Business Kpi, Business Dashboard, Business Metrics.
-
 Business kpi showing key performance indicator of company through target point and line graph
Presenting this set of slides with name - Business Kpi Showing Key Performance Indicator Of Company Through Target Point And Line Graph. This is a three stage process. The stages in this process are Business Kpi, Business Dashboard, Business Metrics.
-
 Business kpi showing summary of key performance indicator data representation in line graph and pie chart
Presenting this set of slides with name - Business Kpi Showing Summary Of Key Performance Indicator Data Representation In Line Graph And Pie Chart. This is a three stage process. The stages in this process are Business Kpi, Business Dashboard, Business Metrics.
-
 Dashboard for business kpi showing data of key performance indicator in graph representation
Presenting this set of slides with name - Dashboard For Business Kpi Showing Data Of Key Performance Indicator In Graph Representation. This is a four stage process. The stages in this process are Business Kpi, Business Dashboard, Business Metrics.
-
 Employee looking at the graph of business kpi in tablet covering bar graphs and pie charts
Presenting this set of slides with name - Employee Looking At The Graph Of Business Kpi In Tablet Covering Bar Graphs And Pie Charts. This is a four stage process. The stages in this process are Business Kpi, Business Dashboard, Business Metrics.
-
 Graphical representation of business kpi with employee working on data doing calculations
Presenting this set of slides with name - Graphical Representation Of Business Kpi With Employee Working On Data Doing Calculations. This is a four stage process. The stages in this process are Business Kpi, Business Dashboard, Business Metrics.
-
 Summary of key performance showing graphical representation of business kpi in bar graphs and pie charts
Presenting this set of slides with name - Summary Of Key Performance Showing Graphical Representation Of Business Kpi In Bar Graphs And Pie Charts. This is a three stage process. The stages in this process are Business Kpi, Business Dashboard, Business Metrics.
-
 Visualization representation of business kpi data showing chart and graph of financial data
Presenting this set of slides with name - Visualization Representation Of Business Kpi Data Showing Chart And Graph Of Financial Data. This is a four stage process. The stages in this process are Business Kpi, Business Dashboard, Business Metrics.
-
 Business Kpi Dashboard Showing Average Revenue And Clv
Presenting this set of slides with name - Business Kpi Dashboard Showing Average Revenue And Clv. This is a three stage process. The stages in this process are Business Dashboard, Business Kpi, Business Performance.
-
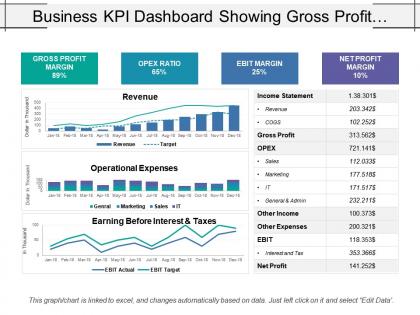 Business kpi dashboard showing gross profit margin opex ratio and ebit margin
Presenting this set of slides with name - Business Kpi Dashboard Showing Gross Profit Margin Opex Ratio And Ebit Margin. This is a three stage process. The stages in this process are Business Dashboard, Business Kpi, Business Performance.
-
 Business kpi dashboard showing lead to opportunity ratio
Presenting this set of slides with name - Business Kpi Dashboard Showing Lead To Opportunity Ratio. This is a three stage process. The stages in this process are Business Dashboard, Business Kpi, Business Performance.
-
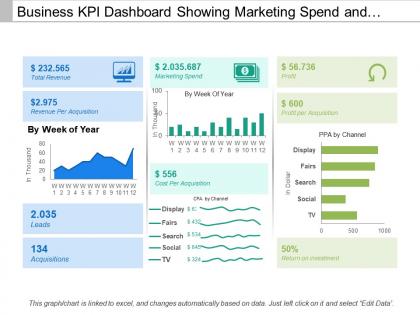 Business kpi dashboard showing marketing spend and return on investment
Presenting this set of slides with name - Business Kpi Dashboard Showing Marketing Spend And Return On Investment. This is a three stage process. The stages in this process are Business Dashboard, Business Kpi, Business Performance.
-
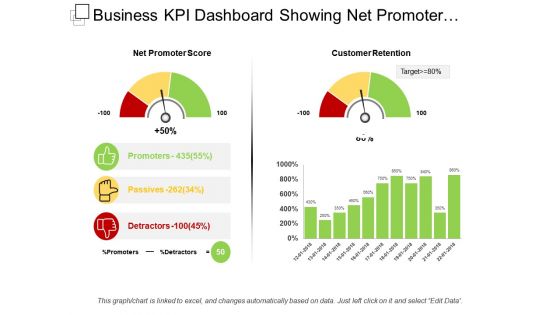 Business kpi dashboard snapshot showing net promoter score
Presenting this set of slides with name - Business Kpi Dashboard Snapshot Showing Net Promoter Score. This is a two stage process. The stages in this process are Business Dashboard, Business Kpi, Business Performance.
-
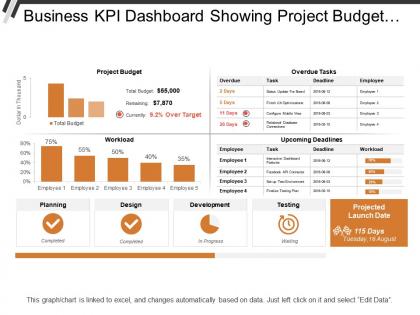 Business kpi dashboard showing project budget overdue tasks and workload
Presenting this set of slides with name - Business Kpi Dashboard Showing Project Budget Overdue Tasks And Workload. This is a two stage process. The stages in this process are Business Dashboard, Business Kpi, Business Performance.
-
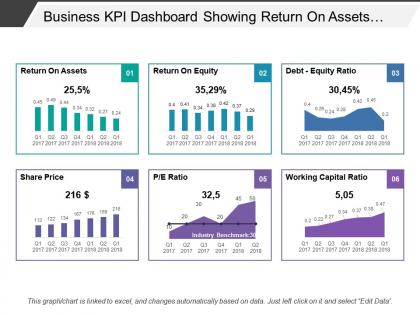 Business kpi dashboard showing return on assets debt-equity ratio
Presenting this set of slides with name - Business Kpi Dashboard Showing Return On Assets Debt-Equity Ratio. This is a six stage process. The stages in this process are Business Dashboard, Business Kpi, Business Performance.
-
 Business kpi dashboard showing revenue and customer lifetime value
Presenting this set of slides with name - Business Kpi Dashboard Showing Revenue And Customer Lifetime Value. This is a four stage process. The stages in this process are Business Dashboard, Business Kpi, Business Performance.
-
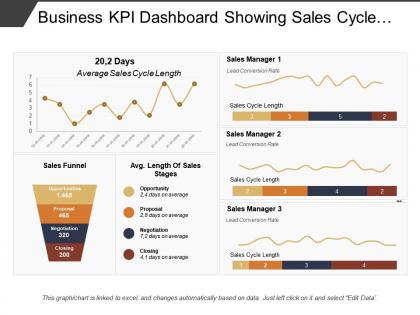 Business kpi dashboard showing sales cycle length and sales funnel
Presenting this set of slides with name - Business Kpi Dashboard Showing Sales Cycle Length And Sales Funnel. This is a three stage process. The stages in this process are Business Dashboard, Business Kpi, Business Performance.
-
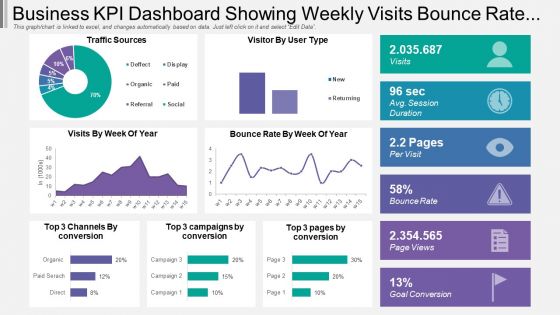 Business Kpi Dashboard Snapshot Showing Weekly Visits Bounce Rate And Traffic Source
Presentation graphic is totally compatible with Google slides. Multiple display options i.e. standard and widescreen. 100 percent editable designs to show your creativity. Similar designs available with different nodes and stages. Easy to download and convert into JPEG or PDF format. Alteration can be done in color, text and shape. Pre-designed PPT slide just download and insert it in the presentation. Quick download with easy to save. Choice to add company logo and replace text as required. High resolution quality ensures no pixilation.
-
 Marketing kpi business transformation models development management system cpb
Presenting this set of slides with name - Marketing Kpi Business Transformation Models Development Management System Cpb. This is an editable five stages graphic that deals with topics like Marketing Kpi, Business Transformation Models, Development Management System to help convey your message better graphically. This product is a premium product available for immediate download, and is 100 percent editable in Powerpoint. Download this now and use it in your presentations to impress your audience.
-
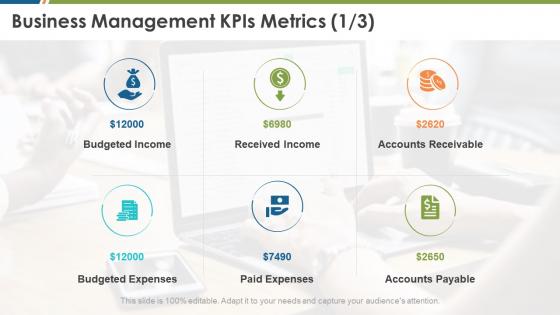 Business management kpis metrics budgeted income business management
Introducing Business Management Kpis Metrics Budgeted Income Business Management to increase your presentation threshold. Encompassed with six stages, this template is a great option to educate and entice your audience. Dispence information on Budgeted Income, Received Income, Accounts Receivable, Budgeted Expenses, Paid Expenses, using this template. Grab it now to reap its full benefits.
-
 Business management business management kpis metrics net profit
Increase audience engagement and knowledge by dispensing information using Business Management Business Management Kpis Metrics Net Profit. This template helps you present information on five stages. You can also present information on Customers, Net Profit, Profit Margin, Revenues using this PPT design. This layout is completely editable so personaize it now to meet your audiences expectations.
-
 Sales Personal Onboarding Playbook Kpis For Business Development Representative
The following slide displays the key KPIs that can be utilized by the sales development representative to measure their performance. It displays the various KPIs such Meetings done, Calls made, mails sent, connection made etc.Increase audience engagement and knowledge by dispensing information using Sales Personal Onboarding Playbook Kpis For Business Development Representative. This template helps you present information on five stages. You can also present information on Meetings Done, Calls Made, Mails Sent, Connects Made, Conversion Rate using this PPT design. This layout is completely editable so personaize it now to meet your audiences expectations.
-
 Kpi business relationship management ppt powerpoint presentation layouts model cpb
Presenting our KPI Business Relationship Management Ppt Powerpoint Presentation Layouts Model Cpb PowerPoint template design. This PowerPoint slide showcases THREE stages. It is useful to share insightful information on KPI Business Relationship Management This PPT slide can be easily accessed in standard screen and widescreen aspect ratios. It is also available in various formats like PDF, PNG, and JPG. Not only this, the PowerPoint slideshow is completely editable and you can effortlessly modify the font size, font type, and shapes according to your wish. Our PPT layout is compatible with Google Slides as well, so download and edit it as per your knowledge.
-
 Using Modern Service Delivery Practices Checklist To Align Business Service Delivery Kpis
This slide define the checklists and guidelines to align business service delivery with KPIs and it includes defining KPIs, KPI discussion, IT culture development and integration of KPIs to consolidated dashboards. Present the topic in a bit more detail with this Using Modern Service Delivery Practices Checklist To Align Business Service Delivery Kpis. Use it as a tool for discussion and navigation on Business, Service, Consolidated Dashboards. This template is free to edit as deemed fit for your organization. Therefore download it now.
-
 5 KPIs Of Business Relationship Management
This slide provides information about 5 key performance indicators KPIsof business relationship management which is customer satisfaction, percentage of questionnaire returned, number of complaints, etc. These KPIs will help businesses in improvement of their as well as employee performance. Introducing our premium set of slides with 5 KPIs Of Business Relationship Management. Ellicudate the five stages and present information using this PPT slide. This is a completely adaptable PowerPoint template design that can be used to interpret topics like Customer Satisfaction, Percentage Of Questionnaires Returned, Number Of Customer Complaints. So download instantly and tailor it with your information.
-
 Icons Slide For Using Modern It Service Delivery Practices Drive Kpi Defined Business Outcomes
Introducing our well researched set of slides titled Icons Slide For Using Modern It Service Delivery Practices Drive Kpi Defined Business Outcomes. It displays a hundred percent editable icons. You can use these icons in your presentation to captivate your audiences attention. Download now and use it multiple times.
-
 Kpis For Business Development Business Development Representative Playbook
The following slide displays the key KPIs that c Increase audience engagement and knowledge by dispensing information using Kpis For Business Development Business Development Representative Playbook. This template helps you present information on five stages. You can also present information on Kpis For Business Development Representative using this PPT design. This layout is completely editable so personaize it now to meet your audiences expectations.an be utilized by the sales development representative to measure their performance. It displays the various KPIs such as Meetings done, Calls made, mails sent, connection made etc.
-
 Charter With Kpis And Targets Business Intelligence Transformation Toolkit Project
In this slide, multiple attributes of the BI project charter are tabulated. The key constituents covered are objectives, deliverables, and assumptions associated with the project. Increase audience engagement and knowledge by dispensing information using Charter With Kpis And Targets Business Intelligence Transformation Toolkit Project. This template helps you present information on seven stages. You can also present information on Objectives, Deliverables, Assumptions,Business using this PPT design. This layout is completely editable so personaize it now to meet your audiences expectations.
-
 Various Kpis To Measure Results Of Ecommerce Business Strategy
The slide outlines different type of KPIs which can assist marketer to track the results of ecommerce business strategy. It includes KPIs such as conversion rate, net profit, cart abandonment rate, customer retention rate, monthly revenue per visitor and customer satisfaction. Presenting our well structured Various Kpis To Measure Results Of Ecommerce Business Strategy. The topics discussed in this slide are Revenue, Customer, Conversion Rate. This is an instantly available PowerPoint presentation that can be edited conveniently. Download it right away and captivate your audience.
-
 SDR Playbook KPIs For Business Development Representative
The following slide displays the key KPIs that can be utilized by the sales development representative to measure their performance. It displays the various KPIs such as Meetings done, Calls made, mails sent, connection made etc.Increase audience engagement and knowledge by dispensing information using SDR Playbook KPIs For Business Development Representative This template helps you present information on five stages. You can also present information on Connects Made, Conversion Rate, Meetings Done using this PPT design. This layout is completely editable so personaize it now to meet your audiences expectations.
-
 Impact Of Customer Communication On Business Kpis
This slide illustrates customer communication impact on business performance. It provides information such as communication practice, customer response and business impact. Introducing our premium set of slides with Impact Of Customer Communication On Business Kpis. Ellicudate the three stages and present information using this PPT slide. This is a completely adaptable PowerPoint template design that can be used to interpret topics like Communication Practice, Customer Response, Business Impact. So download instantly and tailor it with your information.
-
 Sales Development Representative Playbook KPIs For Business Development Representative
The following slide displays the key KPIs that can be utilized by the sales development representative to measure their performance. It displays the various KPIs such as Meetings done, Calls made, mails sent, connection made etc. Increase audience engagement and knowledge by dispensing information using Sales Development Representative Playbook Kpis For Business Development Representative. This template helps you present information on five stages. You can also present information on Meetings Done, Calls Made, Mails Sent, Connects Made, Conversion Rate using this PPT design. This layout is completely editable so personaize it now to meet your audiences expectations.
-
 KPI Business Development Ppt Powerpoint Presentation Summary Ideas Cpb
Presenting KPI Business Development Ppt Powerpoint Presentation Summary Ideas Cpb slide which is completely adaptable. The graphics in this PowerPoint slide showcase four stages that will help you succinctly convey the information. In addition, you can alternate the color, font size, font type, and shapes of this PPT layout according to your content. This PPT presentation can be accessed with Google Slides and is available in both standard screen and widescreen aspect ratios. It is also a useful set to elucidate topics like KPI Business Development. This well structured design can be downloaded in different formats like PDF, JPG, and PNG. So, without any delay, click on the download button now.
-
 KPI Business Analyst Ppt Powerpoint Presentation Pictures Template Cpb
Presenting our KPI Business Analyst Ppt Powerpoint Presentation Pictures Template Cpb PowerPoint template design. This PowerPoint slide showcases four stages. It is useful to share insightful information on KPI Business Analyst. This PPT slide can be easily accessed in standard screen and widescreen aspect ratios. It is also available in various formats like PDF, PNG, and JPG. Not only this, the PowerPoint slideshow is completely editable and you can effortlessly modify the font size, font type, and shapes according to your wish. Our PPT layout is compatible with Google Slides as well, so download and edit it as per your knowledge.
-
 Kpi Metrics Dashboard Highlighting Organization Financial Planning Analysis Guide Small Large Businesses
The following slide outlines key performance indicator KPI dashboard showcasing various financial metrics of the organization. The key metrics are gross revenue, product revenue, service revenue, gross profit, net profit etc. Deliver an outstanding presentation on the topic using thisKpi Metrics Dashboard Highlighting Organization Financial Planning Analysis Guide Small Large Businesses. Dispense information and present a thorough explanation of Highlighting, Organization, Profitability using the slides given. This template can be altered and personalized to fit your needs. It is also available for immediate download. So grab it now.
-
 Performance KPIS With Key Business Objectives
The purpose of this slide is to showcase various objectives and KPIs which can be used to evaluate the business performance. The key objectives are awareness, engagement, lead generation, demand generation, customer support and advocacy. Introducing our Performance KPIS With Key Business Objectives set of slides. The topics discussed in these slides are Awareness, Engagement, Lead Generation, Demand Generation. This is an immediately available PowerPoint presentation that can be conveniently customized. Download it and convince your audience.
-
 Various Objectives And KPIS To Measure Ecommerce Business Performance
The purpose of this slide is to showcase different objectives and KPIs which can be used to evaluate the success rate of Ecommerce business. Cart abandonment rate, revenue per visitor, time on site and bounce rate are the KPIs highlighted in the slide. Presenting our set of slides with name Various Objectives And KPIS To Measure Ecommerce Business Performance. This exhibits information on one stages of the process. This is an easy-to-edit and innovatively designed PowerPoint template. So download immediately and highlight information on KPIS, Objective, Strategies Achieve Objectives.
-
 Kpi Business Development Manager Ppt Powerpoint Presentation Infographics Graphics Cpb
Presenting our Kpi Business Development Manager Ppt Powerpoint Presentation Infographics Graphics Cpb PowerPoint template design. This PowerPoint slide showcases four stages. It is useful to share insightful information on Kpi Business Development Manager This PPT slide can be easily accessed in standard screen and widescreen aspect ratios. It is also available in various formats like PDF, PNG, and JPG. Not only this, the PowerPoint slideshow is completely editable and you can effortlessly modify the font size, font type, and shapes according to your wish. Our PPT layout is compatible with Google Slides as well, so download and edit it as per your knowledge.
-
 Kpis Business Development Manager Ppt Infographic Template Graphics Template Cpb
Presenting our Kpis Business Development Manager Ppt Infographic Template Graphics Template Cpb PowerPoint template design. This PowerPoint slide showcases five stages. It is useful to share insightful information on Kpis Business Development Manager This PPT slide can be easily accessed in standard screen and widescreen aspect ratios. It is also available in various formats like PDF, PNG, and JPG. Not only this, the PowerPoint slideshow is completely editable and you can effortlessly modify the font size, font type, and shapes according to your wish. Our PPT layout is compatible with Google Slides as well, so download and edit it as per your knowledge.
-
 Medical Sales Representative Strategy Playbook KPIs For Business Development Representative
The following slide displays the key KPIs that can be utilized by the sales development representative to measure their performance. It displays the various KPIs such as Meetings done, Calls made, mails sent, connection made etc. Introducing Medical Sales Representative Strategy Playbook KPIs For Business Development Representative to increase your presentation threshold. Encompassed with one stages, this template is a great option to educate and entice your audience. Dispence information on Meetings Done, Mails Sent, Connects Made, Conversion Rate, using this template. Grab it now to reap its full benefits.


