Powerpoint Templates and Google slides for KPI Business
Save Your Time and attract your audience with our fully editable PPT Templates and Slides.
-
 KPI Dashboard to Measure Overall Business Performance App developer playbook
Deliver an outstanding presentation on the topic using this KPI Dashboard To Measure Overall Business Performance App Developer Playbook. Dispense information and present a thorough explanation of KPI Dashboard To Measure Overall Business Performance using the slides given. This template can be altered and personalized to fit your needs. It is also available for immediate download. So grab it now.
-
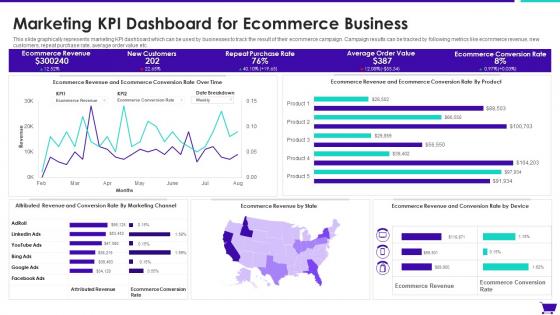 Marketing KPI Dashboard For Ecommerce Business
This slide graphically represents marketing KPI dashboard which can be used by businesses to track the result of their ecommerce campaign. Campaign results can be tracked by following metrics like ecommerce revenue, new customers, repeat purchase rate, average order value etc. Introducing our Marketing KPI Dashboard For Ecommerce Business set of slides. The topics discussed in these slides are Average, Purchase Rate, Customers. This is an immediately available PowerPoint presentation that can be conveniently customized. Download it and convince your audience.
-
 Playbook For Developers Kpi Dashboard To Measure Overall Business Performance
Present the topic in a bit more detail with this Playbook For Developers Kpi Dashboard To Measure Overall Business Performance. Use it as a tool for discussion and navigation on Business, Performance, Dashboard. This template is free to edit as deemed fit for your organization. Therefore download it now.
-
 Ai Transformation Playbook Kpi Dashboard For Tracking Business Performance
Mentioned slide portrays KPI dashboard that can be used by organizations to measure their business performance post AI introduction. KPIS covered here are progress, Before versus After AI Implementation, risks and issues.Present the topic in a bit more detail with this Ai Transformation Playbook Kpi Dashboard For Tracking Business Performance Use it as a tool for discussion and navigation on KPI Dashboard For Tracking Business Performance This template is free to edit as deemed fit for your organization. Therefore download it now.
-
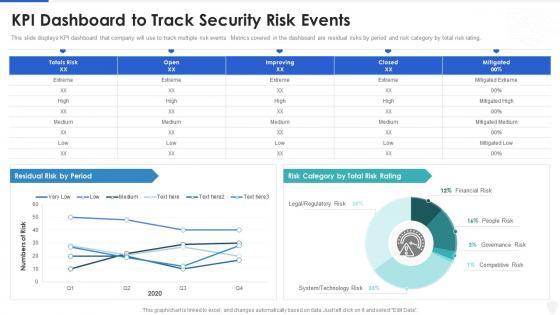 Cybersecurity and digital business risk management kpi dashboard to track security risk events
Present the topic in a bit more detail with this Cybersecurity And Digital Business Risk Management Kpi Dashboard To Track Security Risk Events. Use it as a tool for discussion and navigation on KPI Dashboard To Track Security Risk Events. This template is free to edit as deemed fit for your organization. Therefore download it now.
-
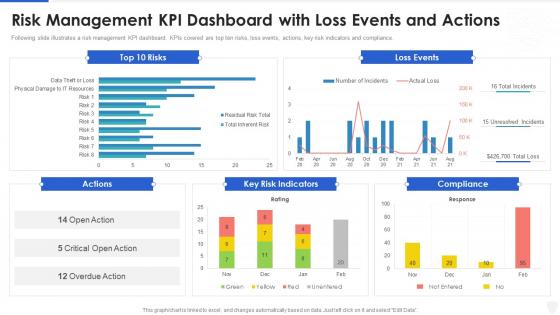 Cybersecurity and digital business risk management risk management kpi dashboard
Following slide illustrates a risk management KPI dashboard. KPIs covered are top ten risks, loss events, actions, key risk indicators and compliance. Deliver an outstanding presentation on the topic using this Cybersecurity And Digital Business Risk Management Risk Management Kpi Dashboard. Dispense information and present a thorough explanation of Risk Management KPI Dashboard With Loss Events And Actions using the slides given. This template can be altered and personalized to fit your needs. It is also available for immediate download. So grab it now.
-
 AIOps Playbook KPI Dashboard For Tracking Business Performance Ppt Structure
Mentioned slide portrays KPI dashboard that can be used by organizations to measure their business performance post AI introduction. KPIS covered here are progress, Before versus After AI Implementation, risks and issues. Present the topic in a bit more detAIl with this AIOps Playbook KPI Dashboard For Tracking Business Performance Ppt Structure. Use it as a tool for discussion and navigation on KPI Dashboard For Tracking Business Performance. This template is free to edit as deemed fit for your organization. Therefore download it now.
-
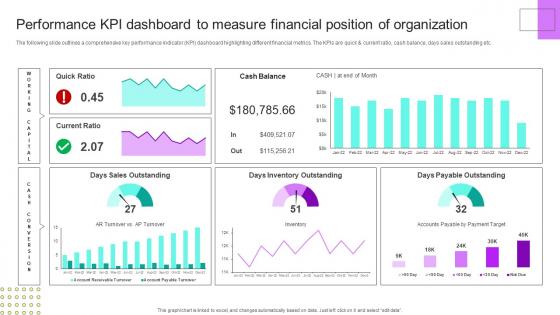 Performance Kpi Dashboard Measure Financial Position Financial Planning Analysis Guide Small Large Businesses
The following slide outlines a comprehensive key performance indicator KPI dashboard highlighting different financial metrics. The KPIs are quick and current ratio, cash balance, days sales outstanding etc. Deliver an outstanding presentation on the topic using this Performance Kpi Dashboard Measure Financial Position Financial Planning Analysis Guide Small Large Businesses. Dispense information and present a thorough explanation of Organization, Performance, Dashboard using the slides given. This template can be altered and personalized to fit your needs. It is also available for immediate download. So grab it now.
-
 Artificial Intelligence Playbook For Business KPI Dashboard For Tracking Business Performance
Mentioned slide portrays KPI dashboard that can be used by organizations to measure their business performance post AI introduction. KPIS covered here are progress, before versus after AI implementation, risks and issues. Deliver an outstanding presentation on the topic using this Artificial Intelligence Playbook For Business KPI Dashboard For Tracking Business Performance. Dispense information and present a thorough explanation of Performance KPIs, Progress, Risk And Issues using the slides given. This template can be altered and personalized to fit your needs. It is also available for immediate download. So grab it now.
-
 KPI Dashboard Of Estimated Vs Actual Business Budget
This slide shows the comparison between actual and estimated budget dashboard of different departments. It includes sales, HR, marketing, research and development budget. Presenting our well-structured KPI Dashboard Of Estimated Vs Actual Business Budget. The topics discussed in this slide are Sales Budget, HR Budget, Marketing Budget. This is an instantly available PowerPoint presentation that can be edited conveniently. Download it right away and captivate your audience.
-
 Gamification Activity Vs KPI Performance Implementing Games In Business Marketing
Ensure that gamification activity helps improve your business performance. Present the topic in a bit more detail with this Gamification Activity Vs KPI Performance Implementing Games In Business Marketing. Use it as a tool for discussion and navigation on Gamification Activity, Performance. This template is free to edit as deemed fit for your organization. Therefore download it now.
-
 KPI Dashboard To Measure Overall Business Performance Playbook For App Design And Development
Present the topic in a bit more detail with this KPI Dashboard To Measure Overall Business Performance Playbook For App Design And Development Use it as a tool for discussion and navigation on Sales Comparison, Product Category, Brand Profitability This template is free to edit as deemed fit for your organization. Therefore download it now.
-
 E Commerce Business Marketing Campaign KPI
This template covers about marketing campaign expenses for product sales increment with each product average price. Further, it includes country wise salesforce accounts. Introducing our E Commerce Business Marketing Campaign KPI set of slides. The topics discussed in these slides are Visitor Online Now, Each Product, Average Price, Marketing And Sales. This is an immediately available PowerPoint presentation that can be conveniently customized. Download it and convince your audience.
-
 E Business Customer Experience Dashboard Tracking Essential KPIs For Ecommerce Performance
This slide provides information regarding essential KPIs for ecommerce performance dashboard tracking average bounce rate, new vs. old customers, channel revenue vs. channel acquisitions costs, channel revenue vs. sales, average conversion rate, etc. Present the topic in a bit more detail with this E Business Customer Experience Dashboard Tracking Essential KPIs For Ecommerce Performance. Use it as a tool for discussion and navigation on Average Bounce Rate, Bounce Rate, Conversion Rate. This template is free to edit as deemed fit for your organization. Therefore download it now.
-
 Gamification Activity Vs Kpi Performance Gamification Techniques Elements Business Growth
Ensure that gamification activity helps improve your business performance. Deliver an outstanding presentation on the topic using this Gamification Activity Vs Kpi Performance Gamification Techniques Elements Business Growth. Dispense information and present a thorough explanation of Gamification, Performance, Business using the slides given. This template can be altered and personalized to fit your needs. It is also available for immediate download. So grab it now.
-
 Competitive Landscape Analysis Company Specific Kpis To Assess Business Performance
Following slide shows detailed competitive landscape analysis based on different criteria such as founded year, number of employees, investor funding, operating profit and net profit margin. Deliver an outstanding presentation on the topic using this Competitive Landscape Analysis Company Specific Kpis To Assess Business Performance. Dispense information and present a thorough explanation of Competitive, Landscape, Analysis using the slides given. This template can be altered and personalized to fit your needs. It is also available for immediate download. So grab it now.
-
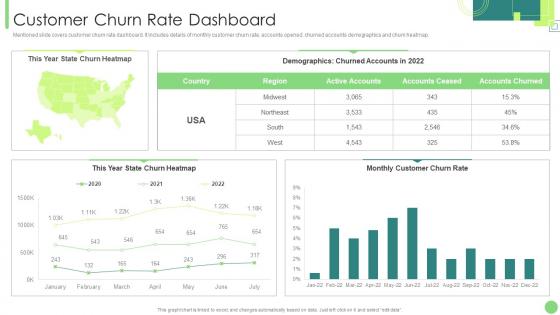 Customer Churn Rate Dashboard Kpis To Assess Business Performance
Mentioned slide covers customer churn rate dashboard. It includes details of monthly customer churn rate, accounts opened, churned accounts demographics and churn heatmap. Present the topic in a bit more detail with this Customer Churn Rate Dashboard Kpis To Assess Business Performance. Use it as a tool for discussion and navigation on Dashboard, Demographics, Customer. This template is free to edit as deemed fit for your organization. Therefore download it now.
-
 Customer Lifetime Value Dashboard Kpis To Assess Business Performance
This slide covers customer lifetime value dashboard. It covers details of average customer lifetime and average lifetime value in a 12 months format. Deliver an outstanding presentation on the topic using this Customer Lifetime Value Dashboard Kpis To Assess Business Performance. Dispense information and present a thorough explanation of Customer, Lifetime, Dashboard using the slides given. This template can be altered and personalized to fit your needs. It is also available for immediate download. So grab it now.
-
 Effective Rate Metrics By Customer And Offering Kpis To Assess Business Performance
This slide covers effective rate metrics. It shows over year over comparison of effective rate per customer as well as effective rate per offering. Deliver an outstanding presentation on the topic using this Effective Rate Metrics By Customer And Offering Kpis To Assess Business Performance. Dispense information and present a thorough explanation of Comparison, Effective Rate Metrics, Customer And Offering using the slides given. This template can be altered and personalized to fit your needs. It is also available for immediate download. So grab it now.
-
 Employee Billable Hours Dashboard Kpis To Assess Business Performance
Following slide shows employee billable hours dashboard covering total hours capacity, allocated hours billable, total hours worked, and total billable hours worked for the assignment. It also includes details of each team member indulged for same assignment. Present the topic in a bit more detail with this Employee Billable Hours Dashboard Kpis To Assess Business Performance. Use it as a tool for discussion and navigation on Assignment, Dashboard, Employee Billable. This template is free to edit as deemed fit for your organization. Therefore download it now.
-
 Employee Engagement And Company Culture Dashboard Kpis To Assess Business Performance
Following slide shows employee engagement and company culture dashboard. It includes employee details, engagement score, total given recognition, previous seven days performance and radar chart to measure employee performance. Deliver an outstanding presentation on the topic using this Employee Engagement And Company Culture Dashboard Kpis To Assess Business Performance. Dispense information and present a thorough explanation of Engagement, Dashboard, Performance using the slides given. This template can be altered and personalized to fit your needs. It is also available for immediate download. So grab it now.
-
 Financial Performance Indicator Dashboard Kpis To Assess Business Performance
This slide shows financial performance indicator dashboard covering net profit and net sales, profitability indicator ratios, cogs and net profit by region or channel. Present the topic in a bit more detail with this Financial Performance Indicator Dashboard Kpis To Assess Business Performance. Use it as a tool for discussion and navigation on Financial, Performance, Dashboard. This template is free to edit as deemed fit for your organization. Therefore download it now.
-
 Key Financials Of The Company Kpis To Assess Business Performance
Following slide provides financial details of company including revenue and operating profit. Revenue recorded in FY22 was dollar 518,932 while operating profit recorded was dollar 481,932. Deliver an outstanding presentation on the topic using this Key Financials Of The Company Kpis To Assess Business Performance. Dispense information and present a thorough explanation of Financials, Including Revenue, Operating using the slides given. This template can be altered and personalized to fit your needs. It is also available for immediate download. So grab it now.
-
 Product Pricing Strategy We Will Adopt Kpis To Assess Business Performance
This slide shows current and future product pricing strategy of the company. In current strategy, company opted cost plus pricing to recover their profits and in future they will opt penetration pricing for capturing market share. Present the topic in a bit more detail with this Product Pricing Strategy We Will Adopt Kpis To Assess Business Performance. Use it as a tool for discussion and navigation on Product, Strategy, Penetration. This template is free to edit as deemed fit for your organization. Therefore download it now.
-
 Profit Margin Dashboard Kpis To Assess Business Performance Ppt Slides Deck
Following slide illustrates profit margin dashboard with a 12 months format. It also includes gross profit margin, operating profit margin and net profit margin. Deliver an outstanding presentation on the topic using this Profit Margin Dashboard Kpis To Assess Business Performance Ppt Slides Deck. Dispense information and present a thorough explanation of Gross Profit Margin, Operating Profit Margin, Net Profit Margin using the slides given. This template can be altered and personalized to fit your needs. It is also available for immediate download. So grab it now.
-
 Real Time Utilization Dashboard Kpis To Assess Business Performance
This slide covers real time utilization dashboard covering logged time such as billable, non-billable, estimated time and scheduled. It also include details of allotted hours to each employee and weekly hours for the assignment. Present the topic in a bit more detail with this Real Time Utilization Dashboard Kpis To Assess Business Performance. Use it as a tool for discussion and navigation on Utilization, Dashboard, Estimated. This template is free to edit as deemed fit for your organization. Therefore download it now.
-
 Revenue And Employment Cost Dashboard Kpis To Assess Business Performance
Mentioned slide covers revenue and employment cost dashboard. It includes details like full time employee number, total employment cost, total revenue and average revenue per FTE. Deliver an outstanding presentation on the topic using this Revenue And Employment Cost Dashboard Kpis To Assess Business Performance. Dispense information and present a thorough explanation of Revenue, Employment, Cost Dashboard using the slides given. This template can be altered and personalized to fit your needs. It is also available for immediate download. So grab it now.
-
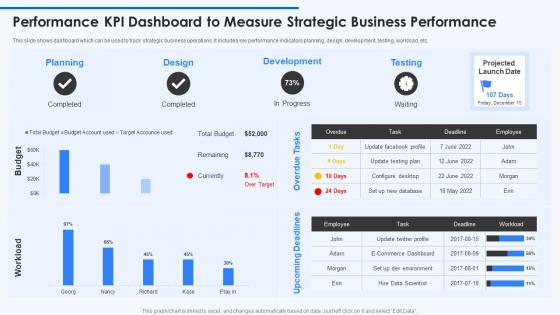 Performance KPI Dashboard To Measure Strategic Business Performance
This slide shows dashboard which can be used to track strategic business operations. It includes key performance indicators planning, design, development, testing, workload, etc. Presenting our well structured Performance KPI Dashboard To Measure Strategic Business Performance. The topics discussed in this slide are Planning, Development, Testing. This is an instantly available PowerPoint presentation that can be edited conveniently. Download it right away and captivate your audience.
-
 Business Performance Monitoring KPI Dashboard Mergers And Acquisitions Process Playbook
Following slide illustrates the KPI dashboard for tracking business performance. KPIS covered in the dashboard are net profit margin, income and expenses, accounts receivable, quick and current ratios.Deliver an outstanding presentation on the topic using this Business Performance Monitoring KPI Dashboard Mergers And Acquisitions Process Playbook. Dispense information and present a thorough explanation of Accounts Receivable, Accounts Payable, Income Expenses using the slides given. This template can be altered and personalized to fit your needs. It is also available for immediate download. So grab it now.
-
 KPI Dashboard To Track Effectiveness Of Real Estate Business Performance Managing Various Risks
The following slide exhibits key performance indicator KPI dashboard which can be used to measure the financial performance of the real estate company. It covers various KPIs such as sales vs target per agent, top 10 projects, top 5 agencies etc. Deliver an outstanding presentation on the topic using this KPI Dashboard To Track Effectiveness Of Real Estate Business Performance Managing Various Risks. Dispense information and present a thorough explanation of Track Effectiveness, Real Estate Business, Performance using the slides given. This template can be altered and personalized to fit your needs. It is also available for immediate download. So grab it now.
-
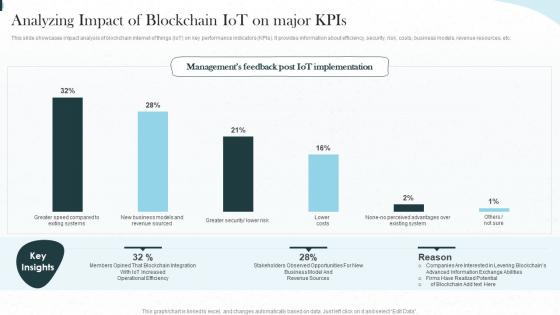 Implementing Iot Architecture In Shipping Business Analyzing Impact Of Blockchain Iot On Major Kpis
This slide showcases impact analysis of blockchain internet of things IoT on key performance indicators KPIs. It provides information about efficiency, security, risk, costs, business models, revenue resources, etc. Present the topic in a bit more detail with this Implementing Iot Architecture In Shipping Business Analyzing Impact Of Blockchain Iot On Major Kpis. Use it as a tool for discussion and navigation on Business, Revenue, Resources. This template is free to edit as deemed fit for your organization. Therefore download it now.
-
 KPI Dashboard To Track E Commerce Business Revenue
This slide shows dashboard which can be used by organizations to monitor ecommerce revenue. It includes metrics such as orders, purchases, delivery status etc. Introducing our KPI Dashboard To Track E Commerce Business Revenue set of slides. The topics discussed in these slides are Purchases, Revenue, Pending Delivery. This is an immediately available PowerPoint presentation that can be conveniently customized. Download it and convince your audience.
-
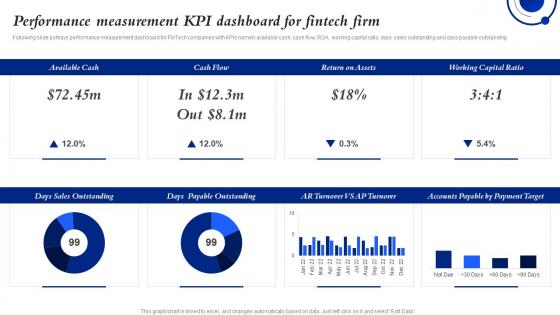 Performance Measurement KPI Dashboard For Fintech Firm Ensuring Business Success By Investing
Following slide portrays performance measurement dashboard for FinTech companies with KPIs namely available cash, cash flow, ROA, working capital ratio, days sales outstanding and days payable outstanding.Present the topic in a bit more detail with this Performance Measurement KPI Dashboard For Fintech Firm Ensuring Business Success By Investing. Use it as a tool for discussion and navigation on Payable Outstanding, Sales Outstanding, Accounts Payable. This template is free to edit as deemed fit for your organization. Therefore download it now.
-
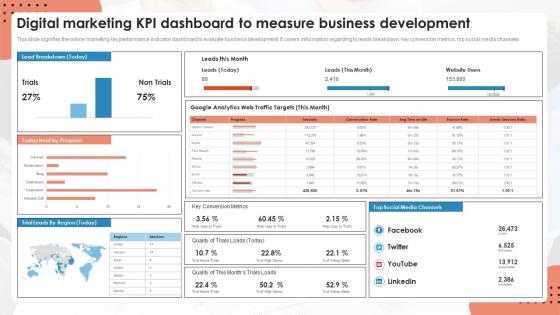 Digital Marketing KPI Dashboard To Measure Business Development
This slide signifies the online marketing key performance indicator dashboard to evaluate business development. It covers information regarding to leads breakdown, key conversion metrics, top social media channels. Introducing our Digital Marketing KPI Dashboard To Measure Business Development set of slides. The topics discussed in these slides are Digital Marketing, KPI Dashboard, Measure Business Development. This is an immediately available PowerPoint presentation that can be conveniently customized. Download it and convince your audience.
-
 Driving Value Business Through Investment Performance Measurement Kpi Dashboard For Fintech Firm
Following slide portrays performance measurement dashboard for FinTech companies with KPIs namely available cash, cash flow, ROA, working capital ratio, days sales outstanding and days payable outstanding. Present the topic in a bit more detail with this Driving Value Business Through Investment Performance Measurement Kpi Dashboard For Fintech Firm. Use it as a tool for discussion and navigation on Performance, Measurement, Dashboard. This template is free to edit as deemed fit for your organization. Therefore download it now.
-
 Using Bpm Tool To Drive Value For Business Revenues And Customers Overview Kpi Dashboard For Banks
Following slide illustrates revenue and customers overview kip dashboard for banks. KPIs covered in the dashboard are revenue actual vs. target, number of new customers, customer acquisition cost vs. customer lifetime value. Present the topic in a bit more detail with this Using Bpm Tool To Drive Value For Business Revenues And Customers Overview Kpi Dashboard For Banks. Use it as a tool for discussion and navigation on Revenues, Dashboard, Overview. This template is free to edit as deemed fit for your organization. Therefore download it now.
-
 Competitive Landscape Analysis Company Specific Measuring Business Performance Using Kpis
Following slide shows detailed competitive landscape analysis based on different criteria such as founded year, number of employees, investor funding, operating profit and net profit margin. Deliver an outstanding presentation on the topic using this Competitive Landscape Analysis Company Specific Measuring Business Performance Using Kpis. Dispense information and present a thorough explanation of Competitive, Landscape, Analysis using the slides given. This template can be altered and personalized to fit your needs. It is also available for immediate download. So grab it now.
-
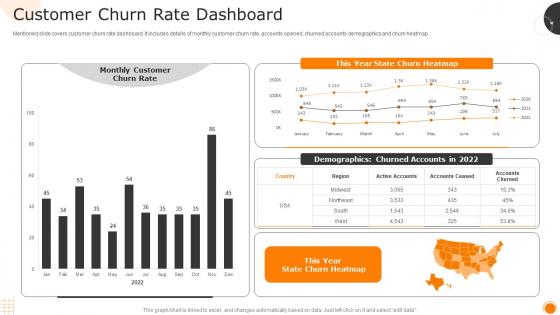 Customer Churn Rate Dashboard Measuring Business Performance Using Kpis
Mentioned slide covers customer churn rate dashboard. It includes details of monthly customer churn rate, accounts opened, churned accounts demographics and churn heatmap. Present the topic in a bit more detail with this Customer Churn Rate Dashboard Measuring Business Performance Using Kpis. Use it as a tool for discussion and navigation on Dashboard, Demographics, Customer. This template is free to edit as deemed fit for your organization. Therefore download it now.
-
 Effective Rate Metrics By Customer And Offering Measuring Business Performance Using Kpis
This slide covers effective rate metrics. It shows over year over comparison of effective rate per customer as well as effective rate per offering. Present the topic in a bit more detail with this Effective Rate Metrics By Customer And Offering Measuring Business Performance Using Kpis. Use it as a tool for discussion and navigation on Comparison, Effective, Customer. This template is free to edit as deemed fit for your organization. Therefore download it now.
-
 Employee Billable Hours Dashboard Measuring Business Performance Using Kpis
Following slide shows employee billable hours dashboard covering total hours capacity, allocated hours billable, total hours worked, and total billable hours worked for the assignment. It also includes details of each team member indulged for same assignment. Deliver an outstanding presentation on the topic using this Employee Billable Hours Dashboard Measuring Business Performance Using Kpis. Dispense information and present a thorough explanation of Dashboard, Assignment, Allocated using the slides given. This template can be altered and personalized to fit your needs. It is also available for immediate download. So grab it now.
-
 Financial Performance Indicator Dashboard Snapshot Measuring Business Performance Using Kpis
This slide shows financial performance indicator dashboard covering net profit and net sales, profitability indicator ratios, cogs and net profit by region or channel. Present the topic in a bit more detail with this Financial Performance Indicator Dashboard Snapshot Measuring Business Performance Using Kpis. Use it as a tool for discussion and navigation on Financial, Performance, Dashboard. This template is free to edit as deemed fit for your organization. Therefore download it now.
-
 Key Financials Of The Company Measuring Business Performance Using Kpis
Following slide provides financial details of company including revenue and operating profit. Revenue recorded in FY22 was dollar 518,932 while operating profit recorded was dollar 481,932. Present the topic in a bit more detail with this Key Financials Of The Company Measuring Business Performance Using Kpis. Use it as a tool for discussion and navigation on Financials, Revenue, Operating Profit. This template is free to edit as deemed fit for your organization. Therefore download it now.
-
 Measuring Business Performance Using Kpis Customer Lifetime Value Dashboard
This slide covers customer lifetime value dashboard. It covers details of average customer lifetime and average lifetime value in a 12 months format. Deliver an outstanding presentation on the topic using this Measuring Business Performance Using Kpis Customer Lifetime Value Dashboard. Dispense information and present a thorough explanation of Customer, Lifetime, Dashboard using the slides given. This template can be altered and personalized to fit your needs. It is also available for immediate download. So grab it now.
-
 Measuring Business Performance Using Kpis Employee Engagement And Company Culture Dashboard
Following slide shows employee engagement and company culture dashboard. It includes employee details, engagement score, total given recognition, previous seven days performance and radar chart to measure employee performance. Present the topic in a bit more detail with this Measuring Business Performance Using Kpis Employee Engagement And Company Culture Dashboard. Use it as a tool for discussion and navigation on Engagement, Dashboard, Measure . This template is free to edit as deemed fit for your organization. Therefore download it now.
-
 Measuring Business Performance Using Kpis Revenue And Employment Cost Dashboard
Mentioned slide covers revenue and employment cost dashboard. It includes details like full time employee number, total employment cost, total revenue and average revenue per FTE. Present the topic in a bit more detail with this Measuring Business Performance Using Kpis Revenue And Employment Cost Dashboard. Use it as a tool for discussion and navigation on Revenue, Employment, Dashboard. This template is free to edit as deemed fit for your organization. Therefore download it now.
-
 Product Pricing Strategy We Will Adopt Measuring Business Performance Using Kpis
This slide shows current and future product pricing strategy of the company. In current strategy, company opted cost plus pricing to recover their profits and in future they will opt penetration pricing for capturing market share. Present the topic in a bit more detail with this Product Pricing Strategy We Will Adopt Measuring Business Performance Using Kpis. Use it as a tool for discussion and navigation on Strategy, Product, Penetration. This template is free to edit as deemed fit for your organization. Therefore download it now.
-
 Profit Margin Dashboard Snapshot Measuring Business Performance Using Kpis
Following slide illustrates profit margin dashboard with a 12 months format. It also includes gross profit margin, operating profit margin and net profit margin. Deliver an outstanding presentation on the topic using this Profit Margin Dashboard Snapshot Measuring Business Performance Using Kpis. Dispense information and present a thorough explanation of Dashboard, Illustrates, Operating using the slides given. This template can be altered and personalized to fit your needs. It is also available for immediate download. So grab it now.
-
 Real Time Utilization Dashboard Measuring Business Performance Using Kpis
This slide covers real time utilization dashboard covering logged time such as billable, non-billable, estimated time and scheduled. It also include details of allotted hours to each employee and weekly hours for the assignment. Present the topic in a bit more detail with this Real Time Utilization Dashboard Measuring Business Performance Using Kpis. Use it as a tool for discussion and navigation on Dashboard, Estimated, Assignment. This template is free to edit as deemed fit for your organization. Therefore download it now.
-
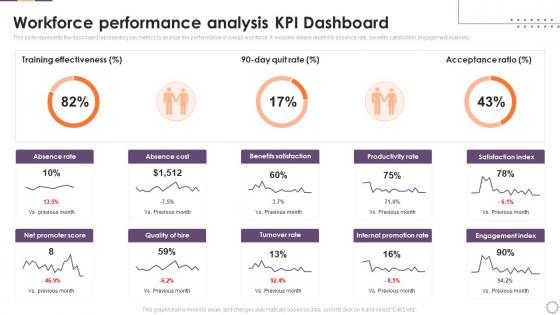 Implementing Business Enhancing Hr Operation Workforce Performance Analysis Kpi Dashboard
This slide represents the dashboard representing key metrics to analyze the performance of overall workforce. It includes details related to absence rate, benefits satisfaction, engagement index etc. Deliver an outstanding presentation on the topic using this Implementing Business Enhancing Hr Operation Workforce Performance Analysis Kpi Dashboard. Dispense information and present a thorough explanation of Workforce, Performance, Analysis using the slides given. This template can be altered and personalized to fit your needs. It is also available for immediate download. So grab it now.
-
 Business Performance Monitoring KPI Dashboard Guide To M And A
Following slide illustrates the KPI dashboard for tracking business performance. KPIS covered in the dashboard are net profit margin, income and expenses, accounts receivable, quick and current ratios. Deliver an outstanding presentation on the topic using this Business Performance Monitoring KPI Dashboard Guide To M And A. Dispense information and present a thorough explanation of Statement, Net Profit Margin, Income And Expenses using the slides given. This template can be altered and personalized to fit your needs. It is also available for immediate download. So grab it now.
-
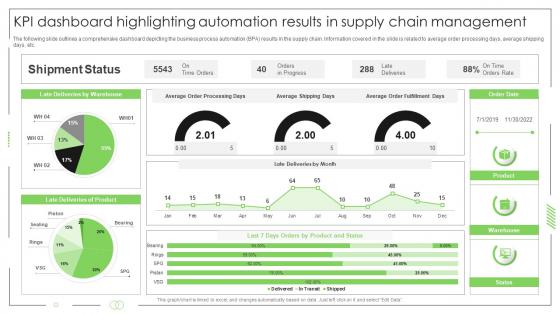 Business Process Automation KPI Dashboard Highlighting Automation Results In Supply Chain Management
The following slide outlines a comprehensive dashboard depicting the business process automation BPA results in the supply chain. Information covered in the slide is related to average order processing days, average shipping days, etc.Deliver an outstanding presentation on the topic using this Business Process Automation KPI Dashboard Highlighting Automation Results In Supply Chain Management. Dispense information and present a thorough explanation of Shipment Status, Late Deliveries, Deliveries Product using the slides given. This template can be altered and personalized to fit your needs. It is also available for immediate download. So grab it now.
-
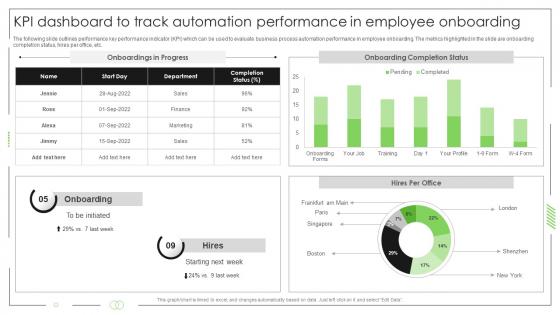 Business Process Automation KPI Dashboard To Track Automation Performance In Employee Onboarding
The following slide outlines performance key performance indicator KPI which can be used to evaluate business process automation performance in employee onboarding. The metrics highlighted in the slide are onboarding completion status, hires per office, etc.Present the topic in a bit more detail with this Business Process Automation KPI Dashboard To Track Automation Performance In Employee Onboarding. Use it as a tool for discussion and navigation on Onboarding, Completion Status, Hires Office. This template is free to edit as deemed fit for your organization. Therefore download it now.
-
 Business Process Automation KPI Metrics Dashboard To Measure Automation Performance In Customer
The following slide outlines a comprehensive KPI dashboard which can be used by the organization to measure the automation performance in customer support department. It covers kpis such as customer retention, costs per support, customer satisfaction, etc.Deliver an outstanding presentation on the topic using this Business Process Automation KPI Metrics Dashboard To Measure Automation Performance In Customer. Dispense information and present a thorough explanation of Customer Satisfaction, Request Answered, Request Volume using the slides given. This template can be altered and personalized to fit your needs. It is also available for immediate download. So grab it now.
-
 Risk Reduction Strategies Stakeholders Kpi Dashboard To Track Effectiveness Of Real Estate Business Performance
The following slide exhibits key performance indicator KPI dashboard which can be used to measure the financial performance of the real estate company. It covers various kpis such as sales vs target per agent, top 10 projects, top 5 agencies etc. Present the topic in a bit more detail with this Risk Reduction Strategies Stakeholders Kpi Dashboard To Track Effectiveness Of Real Estate Business Performance. Use it as a tool for discussion and navigation on Business, Performance, Dashboard. This template is free to edit as deemed fit for your organization. Therefore download it now.
-
 Revenues And Customers Overview Kpi Dashboard For Banks Improving Business Efficiency Using
Following slide illustrates revenue and customers overview kpi dashboard for banks. Kpis covered in the dashboard are revenue actual vs Target, number of new customers, customer acquisition cost vs Customer lifetime value.Present the topic in a bit more detail with this Revenues And Customers Overview Kpi Dashboard For Banks Improving Business Efficiency Using. Use it as a tool for discussion and navigation on Actual Revenue, Compared Previous, Customers Target. This template is free to edit as deemed fit for your organization. Therefore download it now.
-
 Business Performance Monitoring Kpi Dashboard Guide For A Successful M And A Deal
Following slide illustrates the KPI dashboard for tracking business performance. KPIS covered in the dashboard are net profit margin, income and expenses, accounts receivable, quick and current ratios. Present the topic in a bit more detail with this Business Performance Monitoring Kpi Dashboard Guide For A Successful M And A Deal. Use it as a tool for discussion and navigation on Business, Performance, Monitoring. This template is free to edit as deemed fit for your organization. Therefore download it now.
-
 Product Marketing KPI Dashboard For International Business Expansion
This slide signifies the product marketing key performance indicator dashboard for international business expansion. It covers information about sales, target, target achievement, gross profit margin, sales by region, growth and inventory outstanding Presenting our well-structured Product Marketing KPI Dashboard For International Business Expansion. The topics discussed in this slide are Product Marketing, KPI Dashboard, International Business Expansion. This is an instantly available PowerPoint presentation that can be edited conveniently. Download it right away and captivate your audience.
-
 Quarterly Overall Business Performance Assessment With KPI Dashboard
The given below slide showcases the overall business performance to evaluate the trends and KPAs. It includes quarterly insights of elements such as revenue, new customers, net profit, customer satisfaction, sales profitability, growth etc. Introducing our Quarterly Overall Business Performance Assessment With KPI Dashboard set of slides. The topics discussed in these slides are Net Profit, New Customer, Revenue, Customer Satisfaction. This is an immediately available PowerPoint presentation that can be conveniently customized. Download it and convince your audience.
-
 Business Demand Management KPI Dashboard
The following slide represents some kpis to plan further sales and manufacturing processes. It includes elements such as total inventory cost, anticipated surplus stock, out of stock value, slow moving inventory value etc. Introducing our Business Demand Management KPI Dashboard set of slides. The topics discussed in these slides are Total Inventory Cost, Inventory Turnover, Gross Margin. This is an immediately available PowerPoint presentation that can be conveniently customized. Download it and convince your audience.
-
 Business Demand Management Kpis And Priorities
The below slide showcases the kpis to enhance forecast accuracy and gain competitive advantage in demand management. It mainly constitutes of techniques, kpis and priorities. Introducing our Business Demand Management Kpis And Priorities set of slides. The topics discussed in these slides are Demand Management Priorities, Data Interpretations, Cloud Computing. This is an immediately available PowerPoint presentation that can be conveniently customized. Download it and convince your audience.


