Powerpoint Templates and Google slides for Dashboard Data
Save Your Time and attract your audience with our fully editable PPT Templates and Slides.
-
 Employee Training Database Evaluation Dashboard
This slide depicts the dashboard evaluating employee training database to track and analyze training program effectiveness and employee performance metrics. It includes parameters such as number of participants, hours of training, training type etc. Presenting our well structured Employee Training Database Evaluation Dashboard The topics discussed in this slide are Employee Training, Database Evaluation Dashboard This is an instantly available PowerPoint presentation that can be edited conveniently. Download it right away and captivate your audience.
-
 Hr Dashboard To Monitor Workforce Employee Database
This slide depicts the dashboard analyzing the time and attendance database of employees. It includes metrics such as average absenteeism rate, average overtime per week, average overtime by age group, etc. Introducing our Hr Dashboard To Monitor Workforce Employee Database set of slides. The topics discussed in these slides are Overtime Hours, Avg Overtime, Employee Database This is an immediately available PowerPoint presentation that can be conveniently customized. Download it and convince your audience.
-
 Cyber Protection Dashboard To Track Data Loss Safeguarding Business With Data Loss Cybersecurity SS
This slide provides information regarding cybersecurity dashboard to track activities such as malware blocked, vulnerabilities detected, patches ready to install, protection status, active alerts, to ensure minimum data loss.Present the topic in a bit more detail with this Cyber Protection Dashboard To Track Data Loss Safeguarding Business With Data Loss Cybersecurity SS. Use it as a tool for discussion and navigation on Protection Status, Active Alerts Summary, Activities. This template is free to edit as deemed fit for your organization. Therefore download it now.
-
 Dashboard To Leverage Cybersecurity Across Workplace Safeguarding Business With Data Loss Cybersecurity SS
This slide provides information regarding the dashboard to handle cybersecurity across firm by tracking patches applied, vulnerabilities detected, intrusion attempted, security score, etc.Deliver an outstanding presentation on the topic using this Dashboard To Leverage Cybersecurity Across Workplace Safeguarding Business With Data Loss Cybersecurity SS. Dispense information and present a thorough explanation of Intrusion Attempts, Successful Intrusions, Security Score using the slides given. This template can be altered and personalized to fit your needs. It is also available for immediate download. So grab it now.
-
 Dashboard Platform To Represent Customer Engagement Data
The below slide provides a dashboard for customer engagement data using digital analytics that explains the visitors by device, country, etc. The various areas of evaluation are current visitors, top referring domains, etc. Introducing our Dashboard Platform To Represent Customer Engagement Data set of slides. The topics discussed in these slides are Visitors From Devices, Dashboard Platform, Customer Engagement DataThis is an immediately available PowerPoint presentation that can be conveniently customized. Download it and convince your audience.
-
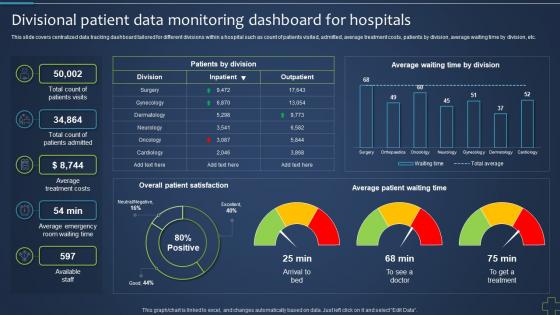 Divisional Patient Data Monitoring Dashboard For Revolutionizing Health Services With Blockchain BCT SS
This slide covers centralized data tracking dashboard tailored for different divisions within a hospital such as count of patients visited, admitted, average treatment costs, patients by division, average waiting time by division, etc. Deliver an outstanding presentation on the topic using this Divisional Patient Data Monitoring Dashboard For Revolutionizing Health Services With Blockchain BCT SS. Dispense information and present a thorough explanation of Average Waiting Time By Division, Average Patient Waiting Time, Overall Patient Satisfaction using the slides given. This template can be altered and personalized to fit your needs. It is also available for immediate download. So grab it now.
-
 Kpi Dashboard For Tracking Efficiency Of Spark Data Analytics
This slide showcases spark data analytics measuring KPI dashboard. This slide includes executors, executors memory usage, driver memory usage, total failed tasks, total completed tasks, max tasks on executor. Introducing our Kpi Dashboard For Tracking Efficiency Of Spark Data Analytics set of slides. The topics discussed in these slides are Dashboard, Efficiency, Data Analytics. This is an immediately available PowerPoint presentation that can be conveniently customized. Download it and convince your audience.
-
 Insurance Customer Analysis KPI Dashboard Navigating The Future Of Insurance Data Analytics SS
This slide outlines a dashboard graphically representing analysis of existing as well as newly acquired insurance customers. It covers metrics such as premium amount, claim amount, claims per month, claims by status, etc. Present the topic in a bit more detail with this Insurance Customer Analysis KPI Dashboard Navigating The Future Of Insurance Data Analytics SS. Use it as a tool for discussion and navigation on Premium Amount Generated, Claim Amount Generated, Customers By Age Group. This template is free to edit as deemed fit for your organization. Therefore download it now.
-
 KPI Dashboard To Analyse Insurance Claim Navigating The Future Of Insurance Data Analytics SS
This slide provides a dashboard utilising insurance claim processing using data analytics techniques. It covers details on various metrics such as number of claims, claims as per type, amount in claims, trend in claims, etc. Deliver an outstanding presentation on the topic using this KPI Dashboard To Analyse Insurance Claim Navigating The Future Of Insurance Data Analytics SS. Dispense information and present a thorough explanation of Claims According To Type, Business using the slides given. This template can be altered and personalized to fit your needs. It is also available for immediate download. So grab it now.
-
 KPI Dashboard To Predict Insurance Claims Navigating The Future Of Insurance Data Analytics SS
This slide provides a dashboard explaining prediction of claim insurances to increase users for the insurance business. It covers metrics such as total claims, claim loss, claim ratio, status, type and loss. Present the topic in a bit more detail with this KPI Dashboard To Predict Insurance Claims Navigating The Future Of Insurance Data Analytics SS. Use it as a tool for discussion and navigation on Claim Loss, Claim Ratio, Claims Incurred. This template is free to edit as deemed fit for your organization. Therefore download it now.
-
 Data Center Migration Dashboard For Risk Mitigation
This slide illustrates KPI or Dashboard to identify improvement areas of data center migration including server type, server OS, migration recommendation, etc. Presenting our well structured Data Center Migration Dashboard For Risk Mitigation. The topics discussed in this slide are Migration, Dashboard, Mitigation. This is an instantly available PowerPoint presentation that can be edited conveniently. Download it right away and captivate your audience.
-
 It Infrastructure Data Center Migration Dashboard
This slide illustrates KPI or dashboard of data center cloud migration including network connection and node data, response time, and pending requests. Presenting our well structured It Infrastructure Data Center Migration Dashboard. The topics discussed in this slide are Infrastructure, Migration, Dashboard. This is an instantly available PowerPoint presentation that can be edited conveniently. Download it right away and captivate your audience.
-
 Migration Dashboard To Monitor Data Center
This slide illustrates data center migration KPI or Dashboard including data center server distribution, application deployment status, application status overview, etc Introducing our Migration Dashboard To Monitor Data Center set of slides. The topics discussed in these slides are Migration, Dashboard, Data Center. This is an immediately available PowerPoint presentation that can be conveniently customized. Download it and convince your audience.
-
 Big Data Analytics Dashboard To Track Healthcare Performance
This slide covers integrating big data analytics to track current healthcare status. It involves details such as current bed occupancy rate, forecasted patient turnover, patient satisfaction and follow up rate. Presenting our well structured Big Data Analytics Dashboard To Track Healthcare Performance. The topics discussed in this slide are Current Occupancy Rate, Project Patient Turnover, Satisfaction Score. This is an instantly available PowerPoint presentation that can be edited conveniently. Download it right away and captivate your audience.
-
 Kpi Dashboard Clinical Trials Leveraging Data Analytics For Clinical Success Data Analytics SS
This slide provides an analytics dashboard aimed ta helping pharma businesses maintain patient summary for effective trials. It covers drug trial monitoring on the basis of cost, participants, hours and cost by status Deliver an outstanding presentation on the topic using this Kpi Dashboard Clinical Trials Leveraging Data Analytics For Clinical Success Data Analytics SS. Dispense information and present a thorough explanation of Dashboard, Analyse, Average Enrolment using the slides given. This template can be altered and personalized to fit your needs. It is also available for immediate download. So grab it now.
-
 Kpi Dashboard Monitor Patient Trials Leveraging Data Analytics For Clinical Success Data Analytics SS
This slide provides a dashboard aimed at analysing patient details to evaluate trials. It covers a patient dashboard to evaluate tasks routine, contact referral and progress Present the topic in a bit more detail with this Kpi Dashboard Monitor Patient Trials Leveraging Data Analytics For Clinical Success Data Analytics SS. Use it as a tool for discussion and navigation on Dashboard, Evaluate, Analysing. This template is free to edit as deemed fit for your organization. Therefore download it now.
-
 Kpi Dashboard Monitoring Leveraging Data Analytics For Clinical Success Data Analytics SS
This slide provides a dashboard highlighting use of site selection and monitoring aimed at helping pharma businesses make wide decisions. It covers metrics such as actual vs planned sites, approved sites, sites as per status, etc Deliver an outstanding presentation on the topic using this Kpi Dashboard Monitoring Leveraging Data Analytics For Clinical Success Data Analytics SS. Dispense information and present a thorough explanation of Dashboard, Effective, Monitoring using the slides given. This template can be altered and personalized to fit your needs. It is also available for immediate download. So grab it now.
-
 Kpi Dashboard Surveillance Of Medical Leveraging Data Analytics For Clinical Success Data Analytics SS
This slide outlines a dashboard illustrating monitoring of medical device released after clinical trials. It covers data on adverse events, recall events, product recalls, injury, death, malfunction, etc Present the topic in a bit more detail with this Kpi Dashboard Surveillance Of Medical Leveraging Data Analytics For Clinical Success Data Analytics SS. Use it as a tool for discussion and navigation on Dashboard, Marketing, Surveillance. This template is free to edit as deemed fit for your organization. Therefore download it now.
-
 Kpi Dashboard To Drug Events Leveraging Data Analytics For Clinical Success Data Analytics SS
This slide provides an analytics dashboard aimed ta helping pharma businesses monitor adverse drug events. It covers ADE counts by drug use based on distribution, repetition, etc Deliver an outstanding presentation on the topic using this Kpi Dashboard To Drug Events Leveraging Data Analytics For Clinical Success Data Analytics SS. Dispense information and present a thorough explanation of Dashboard, Drug Events, Pharma Businesses using the slides given. This template can be altered and personalized to fit your needs. It is also available for immediate download. So grab it now.
-
 Kpi Dashboard To Monitor Drug Trials Leveraging Data Analytics For Clinical Success Data Analytics SS
This slide provides an analytics dashboard aimed ta helping pharma businesses track drug trials. It covers drug trial monitoring on the basis of cost, participants, hours and cost by status Present the topic in a bit more detail with this Kpi Dashboard To Monitor Drug Trials Leveraging Data Analytics For Clinical Success Data Analytics SS. Use it as a tool for discussion and navigation on Dashboard, Pharma Businesses, Monitoring. This template is free to edit as deemed fit for your organization. Therefore download it now.
-
 Dashboard To Evaluate Training Program Effectiveness Data Visualization DTE SS
This slide showcases dashboard that can help organization to evaluate the training program implemented in organization. Its key components are training cost, number of participants, hours of training, cost per participant and occupancy rate. Present the topic in a bit more detail with this Dashboard To Evaluate Training Program Effectiveness Data Visualization DTE SS. Use it as a tool for discussion and navigation on Total Complete Training, Total Hours Training, Total Participant. This template is free to edit as deemed fit for your organization. Therefore download it now.
-
 Post Training Employee Satisfaction Tracking Dashboard Data Visualization DTE SS
This dashboard provides a comprehensive overview of post-training employee satisfaction metrics, equipping managers with real-time insights to assess the effectiveness of training programs and enhance overall employee contentment and engagement. Present the topic in a bit more detail with this Post Training Employee Satisfaction Tracking Dashboard Data Visualization DTE SS. Use it as a tool for discussion and navigation on Training Delivery Effectiveness, Learning Retention Rate, Learner Engagement Rate. This template is free to edit as deemed fit for your organization. Therefore download it now.
-
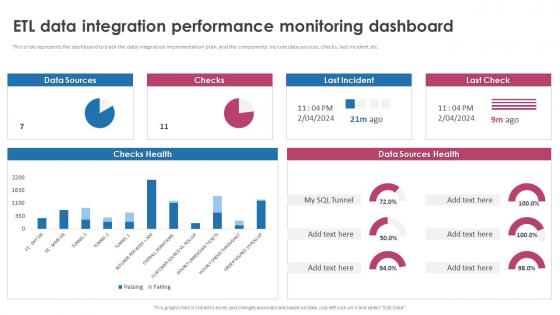 Etl Data Integration Performance Monitoring Dashboard Strategic Roadmap For Seamless
This slide represents the dashboard to track the data integration implementation plan, and the components include data sources, checks, last incident, etc. Deliver an outstanding presentation on the topic using this Etl Data Integration Performance Monitoring Dashboard Strategic Roadmap For Seamless Dispense information and present a thorough explanation of Checks Health, Data Sources Health using the slides given. This template can be altered and personalized to fit your needs. It is also available for immediate download. So grab it now.
-
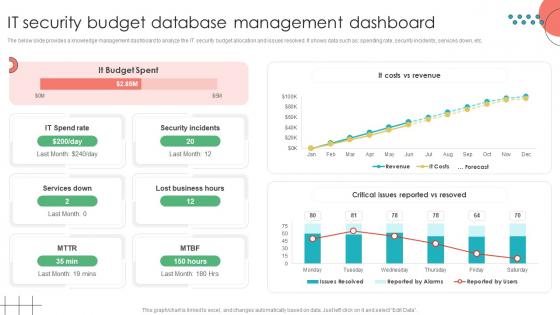 IT Security Budget Database Management Dashboard
The below slide provides a knowledge management dashboard to analyze the IT security budget allocation and issues resolved. It shows data such as spending rate, security incidents, services down, etc. Presenting our well structured IT Security Budget Database Management Dashboard The topics discussed in this slide are Security Incidents, Lost Business HoursThis is an instantly available PowerPoint presentation that can be edited conveniently. Download it right away and captivate your audience.
-
 Effective Management Dashboard Data Governance Strategy Achieve Organizational Excellence CRP DK SS
This slide showcases dashboard for measuring data quality and issues faced in business with KPI metrics such as data load, data issues based on information type, new issue reviews etc. Deliver an outstanding presentation on the topic using this Effective Management Dashboard Data Governance Strategy Achieve Organizational Excellence CRP DK SS. Dispense information and present a thorough explanation of Management, Dashboard, Corporate using the slides given. This template can be altered and personalized to fit your needs. It is also available for immediate download. So grab it now.
-
 Implementing Green Technologies Green Data Center Sustainability Dashboard Sustainability SS
This slide presents a dashboard for tracking green data center sustainability metrics. It measures KPIs such as power usage effectiveness, virtualization, facility utilization, and energy metering. Present the topic in a bit more detail with this Implementing Green Technologies Green Data Center Sustainability Dashboard Sustainability SS. Use it as a tool for discussion and navigation on Green Data Center, Sustainability Dashboard, Virtualization, Facility Utilization, Energy Metering. This template is free to edit as deemed fit for your organization. Therefore download it now.
-
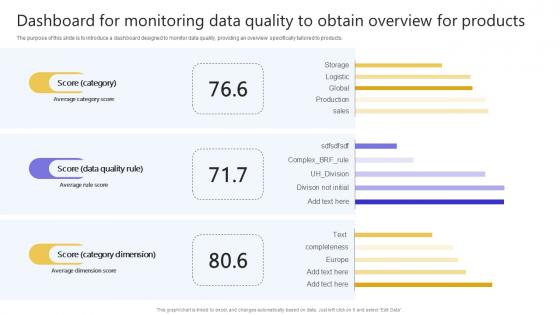 Dashboard For Monitoring Data Quality To Obtain Overview For Products
The purpose of this slide is to introduce a dashboard designed to monitor data quality, providing an overview specifically tailored to products. Introducing our Dashboard For Monitoring Data Quality To Obtain Overview For Products set of slides. The topics discussed in these slides are Category, Data Quality Rule, Category Dimension. This is an immediately available PowerPoint presentation that can be conveniently customized. Download it and convince your audience.
-
 Dashboard For Monitoring Overall Data Quality Scores
The purpose of this slide is to showcase a dashboard designed for monitoring overall data quality scores across various metrics such as completeness, validity, consistency, etc. Presenting our well structured Dashboard For Monitoring Overall Data Quality Scores. The topics discussed in this slide are Quality Dimensions, Data Quality. This is an instantly available PowerPoint presentation that can be edited conveniently. Download it right away and captivate your audience.
-
 Wireless Access Points WAP Data Usage Tracking And Monitoring Dashboard
This slide showcases the data usage tracking and monitoring dashboard. The purpose of this slide is to track the data usage in a company through a dashboard, and the main components are upload and download data usage, free users, plan subscribers, and so on. Deliver an outstanding presentation on the topic using this Wireless Access Points WAP Data Usage Tracking And Monitoring Dashboard. Dispense information and present a thorough explanation of Deployment Status, Online User By Hour, Top Hotspots By Revenue using the slides given. This template can be altered and personalized to fit your needs. It is also available for immediate download. So grab it now.
-
 Customer Engagement Tracking Dashboard Leveraging Digital Analytics To Develop Data Analytics SS
This slide showcases dashboard that is used to track user engagement for business website which helps in identifying profitable lead sources. It provides information regarding KPI metrics such as new visitors, return visitors, engagement, conversion, bounce rates, customer win per lead source etc. Deliver an outstanding presentation on the topic using this Customer Engagement Tracking Dashboard Leveraging Digital Analytics To Develop Data Analytics SS. Dispense information and present a thorough explanation of Conversion Rate, Engagement Rate, Return Visitor Information using the slides given. This template can be altered and personalized to fit your needs. It is also available for immediate download. So grab it now.
-
 Organic Traffic Monitoring Dashboard Post Leveraging Digital Analytics To Develop Data Analytics SS
This slide showcases dashboard for measuring SEO performance and monitoring organic traffic which helps in increasing customer base. It provides information regarding KPI metrics such as organic sessions, conversion rates, top landing pages, top keywords , session rate etc. Deliver an outstanding presentation on the topic using this Organic Traffic Monitoring Dashboard Post Leveraging Digital Analytics To Develop Data Analytics SS. Dispense information and present a thorough explanation of Organic Conversions, Organic Sessions Rate, Organic Sessions using the slides given. This template can be altered and personalized to fit your needs. It is also available for immediate download. So grab it now.
-
 Social Media Activity Tracking Dashboard Leveraging Digital Analytics To Develop Data Analytics SS
This slide showcases dashboard for tracking business social media activity which helps in enhancing brand visibility and marketing ROI. It provides information regarding KPI metrics such as social media followers, engaged users, page impressions, page likes, clicks, shares, favorites, retweets etc. Deliver an outstanding presentation on the topic using this Social Media Activity Tracking Dashboard Leveraging Digital Analytics To Develop Data Analytics SS. Dispense information and present a thorough explanation of Social Media Activity, Tracking Dashboard, Post Strategy Implementation using the slides given. This template can be altered and personalized to fit your needs. It is also available for immediate download. So grab it now.
-
 Statistical Analysis Techniques Healthcare Data Analytics Monitoring Dashboard
This slide represents the dashboard to monitor the data analytics in healthcare department. The key components of this slide are overall patient satisfaction, patients by division, average waiting time, total patients admitted, etc. Present the topic in a bit more detail with this Statistical Analysis Techniques Healthcare Data Analytics Monitoring Dashboard. Use it as a tool for discussion and navigation on Outpatient Vs Inpatients Trend, Overall Patient Satisfaction, Advisor Explained The Treatment Properly. This template is free to edit as deemed fit for your organization. Therefore download it now.
-
 Dashboard For Effective Network Traffic Implementing Data Analytics To Enhance Telecom Data Analytics SS
This slide showcases dashboard used to monitor and rack network traffic and bandwidth usage data. It includes elements such as real time bandwidth usage monitoring, customized reports, network troubleshooting, capacity planning , utilization needs etc. Present the topic in a bit more detail with this Dashboard For Effective Network Traffic Implementing Data Analytics To Enhance Telecom Data Analytics SS. Use it as a tool for discussion and navigation on Dashboard Usability, Bandwidth Monitoring Software. This template is free to edit as deemed fit for your organization. Therefore download it now.
-
 Dashboard To Analyze Customer Churn In Implementing Data Analytics To Enhance Telecom Data Analytics SS
This slide showcases dashboard for tracking customer attrition rate in telecom business and identify reasons for high churn. It provides information regarding dashboard usability, churn rate by gender, by city, phone vs internet service, business revenue, customer journey etc. Deliver an outstanding presentation on the topic using this Dashboard To Analyze Customer Churn In Implementing Data Analytics To Enhance Telecom Data Analytics SS. Dispense information and present a thorough explanation of Key Insights, Dashboard Usability, Churn Customers using the slides given. This template can be altered and personalized to fit your needs. It is also available for immediate download. So grab it now.
-
 Mdr Dashboard To Analyze And Enhance Data Cybersecurity
This slide represents dashboard that helps companies to monitor and analyze various threats and enhance their cybersecurity, it includes various elements such as active investigations, pending response, hunt outcomes, most mitigated threats, etc. Introducing our Mdr Dashboard To Analyze And Enhance Data Cybersecurity set of slides. The topics discussed in these slides are Dashboard, Analyze, Data Cybersecurity. This is an immediately available PowerPoint presentation that can be conveniently customized. Download it and convince your audience.
-
 Internet Of Things In Education Student Data Tracking Application Dashboard IoT SS V
Following slide represents dashboard that provides accurate student data to analyze performance using educational apps. It includes metrics such as grades, attendance, average grades, progress rate, etc. Present the topic in a bit more detail with this Internet Of Things In Education Student Data Tracking Application Dashboard IoT SS V. Use it as a tool for discussion and navigation on Student Data Tracking Application Dashboard. This template is free to edit as deemed fit for your organization. Therefore download it now.
-
 Dashboard For Supply Chain Attack Management For Data Protection
This slide represents dashboard that helps companies to manage supply chain attacks for improving security management measures. It includes various components such a policy and compliance, resource security hygiene, and threat protection. Presenting our well structured Dashboard For Supply Chain Attack Management For Data Protection. The topics discussed in this slide are Policy And Compliance, Resource Security Hygiene, Threat Protection. This is an instantly available PowerPoint presentation that can be edited conveniently. Download it right away and captivate your audience.
-
 Data Reduction Process To Optimize KPI Dashboard
The purpose of this slide is to represent the stages involved in data reduction process to improve key performance indicator dashboard. It will help organizations in efficient planning and performing data reduction operation. It includes various stages like filtering and cleaning data, aggregating data, improving visualizations and apply drill-down functionality. Introducing our premium set of slides with Data Reduction Process To Optimize KPI Dashboard. Ellicudate the Four stages and present information using this PPT slide. This is a completely adaptable PowerPoint template design that can be used to interpret topics like Filter And Clean Data, Aggregate Data, Improve Visualizations. So download instantly and tailor it with your information.
-
 Big Data Analytics Dashboard Icon
Introducing our premium set of slides with Big Data Analytics Dashboard Icon. Ellicudate the three stages and present information using this PPT slide. This is a completely adaptable PowerPoint template design that can be used to interpret topics like Big Data Analytics, Dashboard Icon. So download instantly and tailor it with your information.
-
 Dashboard Of Data Analytics In Digital Marketing
This slide depicts digital analytics performance report of business to evaluate customer engagement over website. It includes revenue, conversion performance, cost per click, transaction, Impressions and session. Introducing our Dashboard Of Data Analytics In Digital Marketing set of slides. The topics discussed in these slides are Transaction, Impressions, Cost Per Click. This is an immediately available PowerPoint presentation that can be conveniently customized. Download it and convince your audience.
-
 Automated Data Analysis Dashboard Icon
Presenting our set of slides with Automated Data Analysis Dashboard Icon. This exhibits information on four stages of the process. This is an easy to edit and innovatively designed PowerPoint template. So download immediately and highlight information on Automated Data Analysis Dashboard.
-
 Kpi Dashboard Icon Of Big Data In Customer Analytics
Introducing our Kpi Dashboard Icon Of Big Data In Customer Analytics set of slides. The topics discussed in these slides are Kpi Dashboard Icon Of Big, Data In Customer Analytics. This is an immediately available PowerPoint presentation that can be conveniently customized. Download it and convince your audience.
-
 Big Data Dashboard For Customer Colored Icon In Powerpoint Pptx Png And Editable Eps Format
This coloured powerpoint icon is perfect for marketing plans related to real estate development. It is a professional, eye-catching design that will make your slides stand out. It is a great way to add visual interest to your presentation and communicate your message effectively.
-
 Big Data Dashboard For Customer Monotone Icon In Powerpoint Pptx Png And Editable Eps Format
This Monotone Marketing Plan Icon for Real Estate Development is a simple yet effective way to visually represent the planning and execution of your real estate development project. It is a great tool to help you stay organized and on track with your goals. Perfect for presentations, reports, and more.
-
 Client Data Insights And Analytics Dashboard Icon
Introducing our Client Data Insights And Analytics Dashboard Icon set of slides. The topics discussed in these slides are Customer Analytics, Data Dashboard Icon. This is an immediately available PowerPoint presentation that can be conveniently customized. Download it and convince your audience.
-
 Analyzing Dashboard Data Visualization Metrics Illustration
This colored PowerPoint icon is perfect for visualizing data and analyzing dashboard. It features a graph, charts, and other elements to help you track and analyze data quickly and easily. Perfect for presentations and reports.
-
 KPI Dashboard Icon Of Big Data In Telecom
Presenting our set of slides with KPI Dashboard Icon Of Big Data In Telecom. This exhibits information on three stages of the process. This is an easy to edit and innovatively designed PowerPoint template. So download immediately and highlight information on KPI Dashboard Icon, Big Data Telecom.
-
 Historical Data Dashboard In Powerpoint And Google Slides Cpb
Presenting our Historical Data Dashboard In Powerpoint And Google Slides Cpb PowerPoint template design. This PowerPoint slide showcases four stages. It is useful to share insightful information on Historical Data Dashboard. This PPT slide can be easily accessed in standard screen and widescreen aspect ratios. It is also available in various formats like PDF, PNG, and JPG. Not only this, the PowerPoint slideshow is completely editable and you can effortlessly modify the font size, font type, and shapes according to your wish. Our PPT layout is compatible with Google Slides as well, so download and edit it as per your knowledge.
-
 Icon Highlighting Data Analytics Dashboard For Gaining Companies Insights
Presenting our set of slides with Icon Highlighting Data Analytics Dashboard For Gaining Companies Insights. This exhibits information on three stages of the process. This is an easy to edit and innovatively designed PowerPoint template. So download immediately and highlight information on Icon Highlighting, Data Analytics, Gaining Companies Insights.
-
 Types Of Dashboard In Intelligent Data Analysis In Big Data
This slide showcases the types of dashboards available in intelligent big data analysis. Its aim is to understand the dashboard and its uses in the organisation for big data. This slide includes operational, strategic and analytical dashboard respectively, etc. Presenting our set of slides with Types Of Dashboard In Intelligent Data Analysis In Big Data This exhibits information on three stages of the process. This is an easy to edit and innovatively designed PowerPoint template. So download immediately and highlight information on Operational, Strategic, Analytical, Big Data
-
 Icon Highlighting SaaS Dashboard For Data Analytics
Introducing our premium set of slides with Icon Highlighting SaaS Dashboard For Data Analytics. Ellicudate the three stages and present information using this PPT slide. This is a completely adaptable PowerPoint template design that can be used to interpret topics like Highlighting SaaS Dashboard, Data Analytics. So download instantly and tailor it with your information.
-
 Data Analytics Dashboard Benefits Icon Showcasing Status
Introducing our premium set of slides with Data Analytics Dashboard Benefits Icon Showcasing Status Ellicudate the three stages and present information using this PPT slide. This is a completely adaptable PowerPoint template design that can be used to interpret topics like Data Analytics, Dashboard Benefits, Showcasing Status So download instantly and tailor it with your information.
-
 Saas Disaster Recovery Dashboard Highlighting Data Protection
This slide showcases the software as a service disaster recovery dashboard illustrating data protection which helps an organization to provide cost effective techniques and security. It include details such as saas disaster recovery test status, business policies, application groups, etc. Introducing our Saas Disaster Recovery Dashboard Highlighting Data Protection set of slides. The topics discussed in these slides are Protection Status, Success, Saas Disaster Recovery, Test Status. This is an immediately available PowerPoint presentation that can be conveniently customized. Download it and convince your audience.
-
 Icon For Data Quality Monitoring Dashboard
Introducing our premium set of slides with name Icon For Data Quality Monitoring Dashboard. Ellicudate the three stages and present information using this PPT slide. This is a completely adaptable PowerPoint template design that can be used to interpret topics like Data Quality, Monitoring, Dashboard. So download instantly and tailor it with your information.
-
 Customer Data Pipeline Dashboard Icon
Presenting our set of slides with Customer Data Pipeline Dashboard Icon. This exhibits information on three stages of the process. This is an easy to edit and innovatively designed PowerPoint template. So download immediately and highlight information on Customer Data Pipeline, Dashboard, Icon.
-
 Data warehouse it dashboard snapshot for data warehouse implementation ppt slides templates
This slide represents the dashboard for data warehouse implementation in the organization, including transactions per hour and value, total value by the day, and location. Present the topic in a bit more detail with this Data Warehouse IT Dashboard Snapshot For Data Warehouse Implementation Ppt Slides Templates. Use it as a tool for discussion and navigation on Transactions Hours, Value Location, Transactions Over Time, Total Value Location. This template is free to edit as deemed fit for your organization. Therefore download it now.
-
 Dashboard of digital advertisement data profiling
The following slide highlights the dashboard of digital advertisement data profiling illustrating key headings which includes campaign name, period, ads spend results, ads generating actions, ad conversion and cost and campaign performance. Introducing our Dashboard Of Digital Advertisement Data Profiling set of slides. The topics discussed in these slides are Dashboard Of Digital Advertisement Data Profiling. This is an immediately available PowerPoint presentation that can be conveniently customized. Download it and convince your audience.
-
 Data profiling dashboard of gender and age demographics
The following slide highlights the data profiling dashboard of gender and age demographics illustrating gender and age per month, gender and general age, average age per month and individual per age group to find the gender and age composition of area. Introducing our Data Profiling Dashboard Of Gender And Age Demographics set of slides. The topics discussed in these slides are Data Profiling Dashboard Of Gender And Age Demographics. This is an immediately available PowerPoint presentation that can be conveniently customized. Download it and convince your audience.
-
 Keywords performance data profiling and analysis dashboard
The following slide highlights the keywords performance data profiling and analysis dashboard illustrating spend vs cost per click, campaign report, high performing keywords, low performing keywords and advertisement performance. Introducing our Keywords Performance Data Profiling And Analysis Dashboard set of slides. The topics discussed in these slides are Keywords Performance Data Profiling And Analysis Dashboard. This is an immediately available PowerPoint presentation that can be conveniently customized. Download it and convince your audience.


