Powerpoint Templates and Google slides for Dashboard Data
Save Your Time and attract your audience with our fully editable PPT Templates and Slides.
-
 Kpi Dashboard To Analyze Targeted Email Marketing Database Marketing Strategies MKT SS V
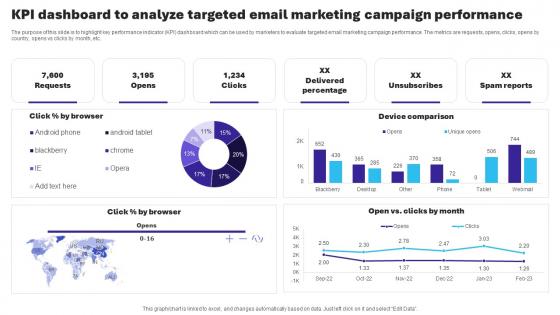
The purpose of this slide is to highlight key performance indicator KPI dashboard which can be used by marketers to evaluate targeted email marketing campaign performance. The metrics are requests, opens, clicks, opens by country, opens vs clicks by month, etc. Deliver an outstanding presentation on the topic using this Kpi Dashboard To Analyze Targeted Email Marketing Database Marketing Strategies MKT SS V. Dispense information and present a thorough explanation of Delivered Percentage, Device Comparison using the slides given. This template can be altered and personalized to fit your needs. It is also available for immediate download. So grab it now.
-
 Financial Metrics Data Driven Dashboard For Data Analysis
This slide highlights data driven dashboard for tracking, analyzing and displaying KPIs and metrics. It includes financial KPIs such as current fixed capital, cash flow cycle, supplier payment error rate, etc. Introducing our Financial Metrics Data Driven Dashboard For Data Analysis set of slides. The topics discussed in these slides are Quick Assets, Current Fixed Capital. This is an immediately available PowerPoint presentation that can be conveniently customized. Download it and convince your audience.
-
 Dashboard For Analysis Of Business Product Survey Data
This slide showcases the dashboard for analysis of companys product survey data. The purpose of this slide is to help the researcher enhance their understanding of public sentiment and demography, regarding the product, through data visualization. It includes elements such as buyer age group segregation, buyer sentiment analysis, etc. Introducing our Dashboard For Analysis Of Business Product Survey Data set of slides. The topics discussed in these slides are Group Segregation, Regularity Product, Buyer Sentiment Analysis. This is an immediately available PowerPoint presentation that can be conveniently customized. Download it and convince your audience.
-
 Dashboard Representing Customer Satisfaction Survey Data
This slide highlights the dashboard for representing customer satisfaction survey data. The purpose of this slide is to help the business track and analyze customer satisfaction. It includes elements such as net promoter score for the current month, customer effort score for the current month, etc. Presenting our well structured Dashboard Representing Customer Satisfaction Survey Data. The topics discussed in this slide are Net Promoter Score, Customer Effort Score, Customer Evaluation. This is an instantly available PowerPoint presentation that can be edited conveniently. Download it right away and captivate your audience.
-
 Password Security Dashboard To Prevent Data Theft
This slide highlights a performance dashboard to track data breach password security. The purpose of this slide is to show the key performance metrics that need to be tracked and managed to prevent data theft. It includes password assessment score, security pros, password actions, etc. Introducing our Password Security Dashboard To Prevent Data Theft set of slides. The topics discussed in these slides are Security, Prevent, Data. This is an immediately available PowerPoint presentation that can be conveniently customized. Download it and convince your audience.
-
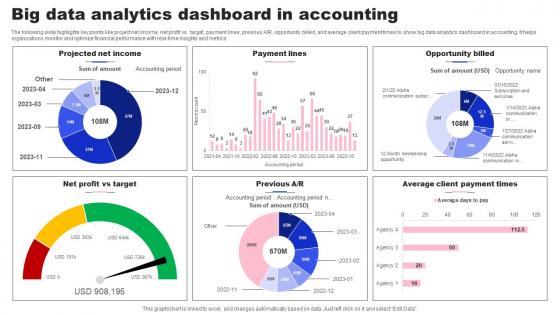 Big Data Analytics Dashboard In Accounting
The following slide highlights key points like project net income, net profit vs. target, payment lines, previous A R, opportunity billed, and average client payment times to show big data analytics dashboard in accounting. It helps organizations monitor and optimize financial performance with real-time insights and metrics. Presenting our well structured Big Data Analytics Dashboard In Accounting. The topics discussed in this slide are Payment Lines, Profit Vs Target. This is an instantly available PowerPoint presentation that can be edited conveniently. Download it right away and captivate your audience.
-
 HRM System Dashboard For Tracking Employee Data Ppt Demonstration
This slide covers the human resource software KPI dashboard for analyzing employee details. It includes metrics such as the number of employees, salaries, new hires, new hires and terminations, compensation, etc. Present the topic in a bit more detail with this HRM System Dashboard For Tracking Employee Data Ppt Demonstration. Use it as a tool for discussion and navigation on Employees, Location, Compensation. This template is free to edit as deemed fit for your organization. Therefore download it now.
-
 Recruitment And Selection Process New Hires Data Tracker Dashboard
This slide shows dashboard including date related to new hires for recruitment. It include data related to new hires per month, new hires for various departments and by sources, etc. Deliver an outstanding presentation on the topic using this Recruitment And Selection Process New Hires Data Tracker Dashboard. Dispense information and present a thorough explanation of Hires Data Tracker Dashboard, New Hires For Recruitment, General Candidate Feedback, Interview Activity using the slides given. This template can be altered and personalized to fit your needs. It is also available for immediate download. So grab it now.
-
 KPI Dashboard For Tracking Effectiveness Of Data Analysis Strategies
This slide covers the data analysis strategy sales dashboard. The purpose of this template is to provide to evaluate the sales performance of the business. The KPIs are the number of sales, revenue, profit, cost, sales revenue, etc. Introducing our KPI Dashboard For Tracking Effectiveness Of Data Analysis Strategies set of slides. The topics discussed in these slides are Number Of Sales, Revenue, Profit. This is an immediately available PowerPoint presentation that can be conveniently customized. Download it and convince your audience.
-
 Customer Data Platform Adoption Process Customer Behaviour Analysis KPI Dashboard
The following slide showcases customer behavior assessment to gain competitive advantages and analyze their purchase pattern. It includes elements such as visitors, by device, page views, top pages, domains etc. Deliver an outstanding presentation on the topic using this Customer Data Platform Adoption Process Customer Behaviour Analysis KPI Dashboard. Dispense information and present a thorough explanation of Customer, Analysis, Device using the slides given. This template can be altered and personalized to fit your needs. It is also available for immediate download. So grab it now.
-
 Customer Data Platform Adoption Process Customer Profile Analysis With KPI Dashboard
The following slide depicts targeted customer profile to address their challenges and track their interactions. It includes element such as brands, timeline, activities, average spending, visits, engagement score, interests, customer lifetime value CLV etc. Present the topic in a bit more detail with this Customer Data Platform Adoption Process Customer Profile Analysis With KPI Dashboard. Use it as a tool for discussion and navigation on Connected, Email, Marketing. This template is free to edit as deemed fit for your organization. Therefore download it now.
-
 Email Campaign Performance Evaluation Dashboard Customer Data Platform Adoption Process
The following slide depicts email campaign performance dashboard to connect with audience and gather real time insights. It includes elements such as highest open rate, active customers, average engagement per customer, daily performance analysis etc. Deliver an outstanding presentation on the topic using this Email Campaign Performance Evaluation Dashboard Customer Data Platform Adoption Process. Dispense information and present a thorough explanation of Email, Performance, Evaluation using the slides given. This template can be altered and personalized to fit your needs. It is also available for immediate download. So grab it now.
-
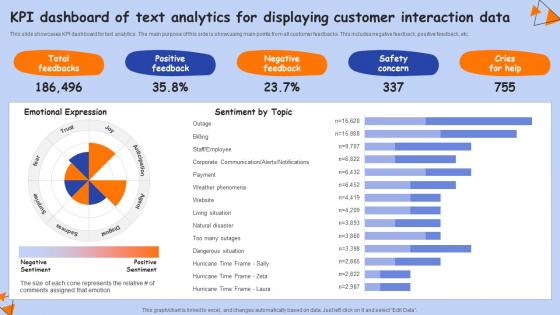 KPI Dashboard Of Text Analytics For Displaying Customer Interaction Data
This slide showcases KPI dashboard for text analytics. The main purpose of this side is showcasing main points from all customer feedbacks. This includes negative feedback, positive feedback, etc.Introducing our KPI Dashboard Of Text Analytics For Displaying Customer Interaction Data set of slides. The topics discussed in these slides are Corporate Communication, Weather Phenomena, Natural Disaster. This is an immediately available PowerPoint presentation that can be conveniently customized. Download it and convince your audience.
-
 Client Satisfaction Data Analytics Dashboard
This slide shows customer data analytics dashboard that can be used to summaries annual data for compiling data. It include figures related to requests answered, total requests and satisfaction rate, etc.Introducing our Client Satisfaction Data Analytics Dashboard set of slides. The topics discussed in these slides are Requests Answered, Total Requests, Total Revenue. This is an immediately available PowerPoint presentation that can be conveniently customized. Download it and convince your audience.
-
 Data Analytics Dashboard To Determine Client Behaviour
This slide shows customer patterns related data analytics dashboard that can be used to analyse current customer trends for making policies. It include shopping behavioural insights, customer conversion rate, etc.Presenting our well structured Data Analytics Dashboard To Determine Client Behaviour. The topics discussed in this slide are Customers Conversion, Shopping Behavioural, Shopping Activity This is an instantly available PowerPoint presentation that can be edited conveniently. Download it right away and captivate your audience.
-
 Global Regions Client Data Insights And Analytics Dashboard
This slide shows customer data analytics dashboard that can be used to summarise region wise sales distribution across the globe. It include weekly conversion rate, regional conversion rate and margin ratios, etc.Introducing our Global Regions Client Data Insights And Analytics Dashboard set of slides. The topics discussed in these slides are Regional Conversion, Weekly Conversion, Region Launched. This is an immediately available PowerPoint presentation that can be conveniently customized. Download it and convince your audience.
-
 Student Data Tracking Application Dashboard Iot In Education To Transform IoT SS
Following slide represents dashboard that provides accurate student data to analyze performance using educational apps. It includes metrics such as grades, attendance, average grades, progress rate, etc. Present the topic in a bit more detail with this Student Data Tracking Application Dashboard Iot In Education To Transform IoT SS. Use it as a tool for discussion and navigation on Maurice Richardson, Lee Castillo. This template is free to edit as deemed fit for your organization. Therefore download it now.
-
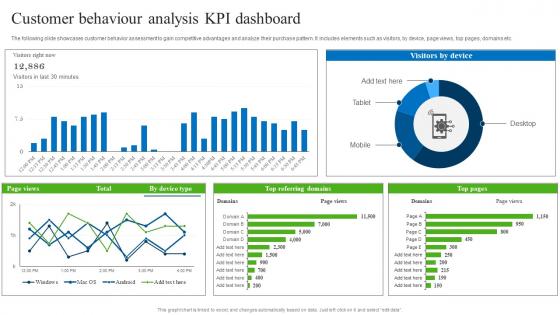 Customer Behaviour Analysis KPI Dashboard Gathering Real Time Data With CDP Software MKT SS V
The following slide showcases customer behavior assessment to gain competitive advantages and analyze their purchase pattern. It includes elements such as visitors, by device, page views, top pages, domains etc. Deliver an outstanding presentation on the topic using this Customer Behaviour Analysis KPI Dashboard Gathering Real Time Data With CDP Software MKT SS V. Dispense information and present a thorough explanation of Visitors By Device, Top Pages using the slides given. This template can be altered and personalized to fit your needs. It is also available for immediate download. So grab it now.
-
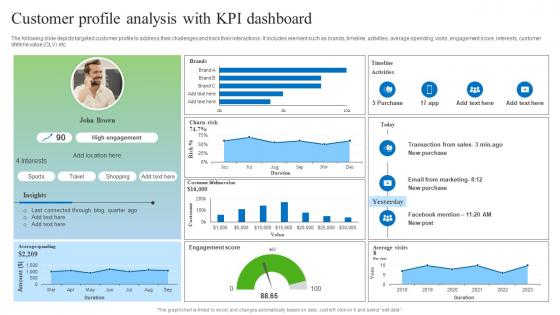 Customer Profile Analysis With KPI Dashboard Gathering Real Time Data With CDP Software MKT SS V
The following slide depicts targeted customer profile to address their challenges and track their interactions. It includes element such as brands, timeline, activities, average spending, visits, engagement score, interests, customer lifetime value CLV etc. Deliver an outstanding presentation on the topic using this Customer Profile Analysis With KPI Dashboard Gathering Real Time Data With CDP Software MKT SS V. Dispense information and present a thorough explanation of Brands, Timeline, Churn Risk using the slides given. This template can be altered and personalized to fit your needs. It is also available for immediate download. So grab it now.
-
 Email Campaign Performance Evaluation Dashboard Gathering Real Time Data With CDP Software MKT SS V
The following slide depicts email campaign performance dashboard to connect with audience and gather real time insights. It includes elements such as highest open rate, active customers, average engagement per customer, daily performance analysis etc. Deliver an outstanding presentation on the topic using this Email Campaign Performance Evaluation Dashboard Gathering Real Time Data With CDP Software MKT SS V. Dispense information and present a thorough explanation of Email, Engagement By Campaign using the slides given. This template can be altered and personalized to fit your needs. It is also available for immediate download. So grab it now.
-
 Data Driven Instagram KPI Dashboard
This slide showcases the Instagram KPI dashboard. The purpose of this slide is to provide businesses and influencers with a visually informative tool to monitor and analyze key performance indicators related to their Instagram presence. It includes elements such as profile visits, impressions, etc.Presenting our well structured Data Driven Instagram KPI Dashboard. The topics discussed in this slide are Data Driven, Instagram Kpi Dashboard, Track Leads. This is an instantly available PowerPoint presentation that can be edited conveniently. Download it right away and captivate your audience.
-
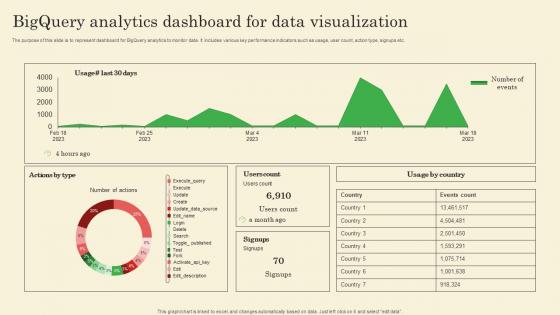 Bigquery Analytics Dashboard For Data Visualization
The purpose of this slide is to represent dashboard for BigQuery analytics to monitor data. It includes various key performance indicators such as usage, user count, action type, signups etc. Introducing our Bigquery Analytics Dashboard For Data Visualization set of slides. The topics discussed in these slides are Users Count, Usage By Country. This is an immediately available PowerPoint presentation that can be conveniently customized. Download it and convince your audience.
-
 Data Model Performance Tracking Dashboard Data Structure In DBMS
This slide shows the data model performance tracking dashboard. The purpose of this slide is to represent the Information related to the change brought by data models graphically.Deliver an outstanding presentation on the topic using this Data Model Performance Tracking Dashboard Data Structure In DBMS. Dispense information and present a thorough explanation of Database Performance,Database Users,Website Performance using the slides given. This template can be altered and personalized to fit your needs. It is also available for immediate download. So grab it now.
-
 KPI Dashboard Of Big Data In Telecom Industry
This slide shows KPI dashboard for big data in telecom industry to measure revenue and users activity. It further includes total revenue, total subscriber, new subscriber, disconnects etc. Presenting our well structured KPI Dashboard Of Big Data In Telecom Industry. The topics discussed in this slide are Subscriber Additions, Average Revenue Per User, Subscriber Retention Rate. This is an instantly available PowerPoint presentation that can be edited conveniently. Download it right away and captivate your audience.
-
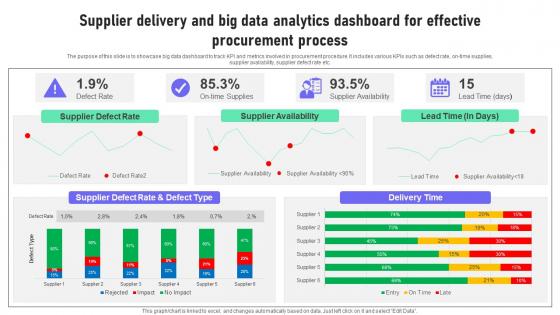 Supplier Delivery And Big Data Analytics Dashboard For Effective Procurement Process
The purpose of this slide is to showcase big data dashboard to track KPI and metrics involved in procurement procedure. It includes various KPIs such as defect rate, on-time supplies, supplier availability, supplier defect rate etc. Presenting our well structured Supplier Delivery And Big Data Analytics Dashboard For Effective Procurement Process. The topics discussed in this slide are Procurement, Process, Dashboard. This is an instantly available PowerPoint presentation that can be edited conveniently. Download it right away and captivate your audience.
-
 Data Integration For Improved Business Etl Data Integration Monitoring Dashboard
This slide represents the dashboard to track the data integration implementation plan. The purpose of this slide is to showcase the ETL data integration tools, and the components include data sources, checks, last incident, and last check. Deliver an outstanding presentation on the topic using this Data Integration For Improved Business Etl Data Integration Monitoring Dashboard. Dispense information and present a thorough explanation of Data Integration, Monitoring Dashboard, Data Sources using the slides given. This template can be altered and personalized to fit your needs. It is also available for immediate download. So grab it now.
-
 Consumer Marketing Dashboard Analyzing Real Time Data
This slide depicts dashboard analyzing stakeholders real-time data which cuts out inefficiency and displays metrics from different channels. It includes elements such as Ad spend, cost per thousand, cost per click, click-through rate and services. Introducing our Consumer Marketing Dashboard Analyzing Real Time Data set of slides. The topics discussed in these slides are Range This Month, Services All, Posts All This is an immediately available PowerPoint presentation that can be conveniently customized. Download it and convince your audience.
-
 Strategy Planning Dashboard For Consistent Data Quality
This slide illustrates KPI dashboard for data strategy to effectively manage, measure and optimize data related initiatives ensuring overall success. It includes metrics such as ticket closed, total queries, total sales, support overhead ratio, user approval, ticket volume vs support level, etc. Presenting our well structured Strategy Planning Dashboard For Consistent Data Quality The topics discussed in this slide are Ticket Closed, Total Queries, Total Sales This is an instantly available PowerPoint presentation that can be edited conveniently. Download it right away and captivate your audience.
-
 Data Quality Measurement KPI Dashboard
This slide shows an analytical dashboard for data quality management. The purpose of this slide is to help businesses in monitoring status of various data quality elements in an organization. It covers report of elements such as accuracy, completeness, consistency, integrity, etc. Presenting our well structured Data Quality Measurement KPI Dashboard. The topics discussed in this slide are Accuracy, Consistency, Uniqueness. This is an instantly available PowerPoint presentation that can be edited conveniently. Download it right away and captivate your audience.
-
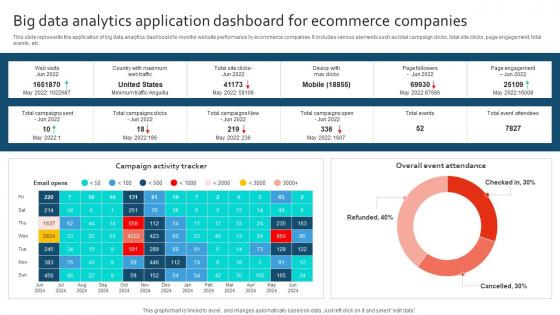 Big Data Analytics Application Dashboard For Ecommerce Companies
This slide represents the application of big data analytics dashboard to monitor website performance by ecommerce companies. It includes various elements such as total campaign clicks, total site clicks, page engagement, total events, etc. Introducing our Big Data Analytics Application Dashboard For Ecommerce Companies set of slides. The topics discussed in these slides are Campaign Activity Tracker, Ecommerce Companies. This is an immediately available PowerPoint presentation that can be conveniently customized. Download it and convince your audience.
-
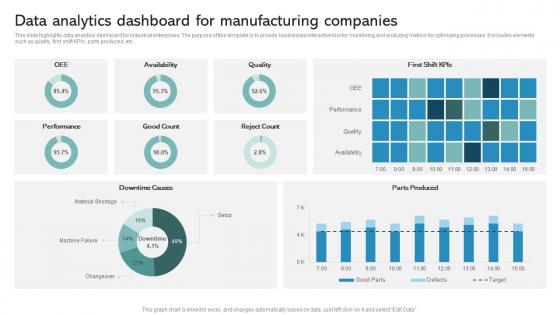 Data Analytics Dashboard For Manufacturing Companies
This slide highlights data analytics dashboard for industrial enterprises. The purpose of this template is to provide businesses interactive tool for monitoring and analyzing metrics for optimizing processes. It includes elements such as quality, first shift KPIs, parts produced, etc. Introducing our Data Analytics Dashboard For Manufacturing Companies set of slides. The topics discussed in these slides are Performance, Good Count, Reject Count, Availability, Quality. This is an immediately available PowerPoint presentation that can be conveniently customized. Download it and convince your audience.
-
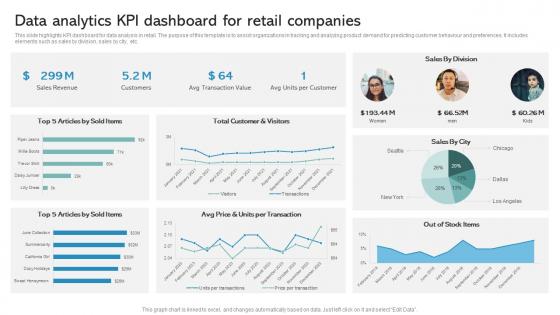 Data Analytics KPI Dashboard For Retail Companies
This slide highlights KPI dashboard for data analysis in retail. The purpose of this template is to assist organizations in tracking and analyzing product demand for predicting customer behaviour and preferences. It includes elements such as sales by division, sales by city, etc. Presenting our well structured Data Analytics KPI Dashboard For Retail Companies. The topics discussed in this slide are Total Customer And Visitors, Units Per Transaction, Articles By Sold Items. This is an instantly available PowerPoint presentation that can be edited conveniently. Download it right away and captivate your audience.
-
 Operating System Dashboard For Data Performance Tracking
This slide illustrates KPI or dashboard of operating system by providing total number of computers by system role within collection, branch version, and state. It includes metrics such as computer software, hierarchical levels, and conditions. Presenting our well structured Operating System Dashboard For Data Performance Tracking. The topics discussed in this slide are Computer Software, Hierarchical Levels, Conditions. This is an instantly available PowerPoint presentation that can be edited conveniently. Download it right away and captivate your audience.
-
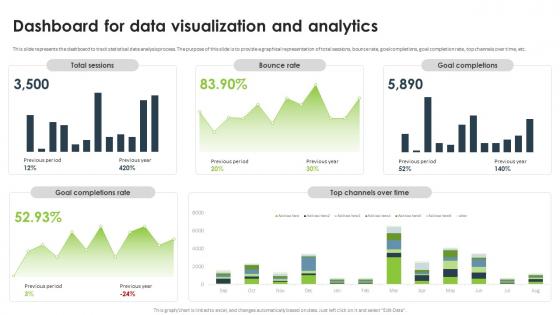 Statistical Analysis For Data Driven Dashboard For Data Visualization And Analytics
This slide represents the dashboard to track statistical data analysis process. The purpose of this slide is to provide a graphical representation of total sessions, bounce rate, goal completions, goal completion rate, top channels over time, etc. Present the topic in a bit more detail with this Statistical Analysis For Data Driven Dashboard For Data Visualization And Analytics. Use it as a tool for discussion and navigation on Data Visualization And Analytics, Bounce Rate, Goal Completions, Goal Completion Rate. This template is free to edit as deemed fit for your organization. Therefore download it now.
-
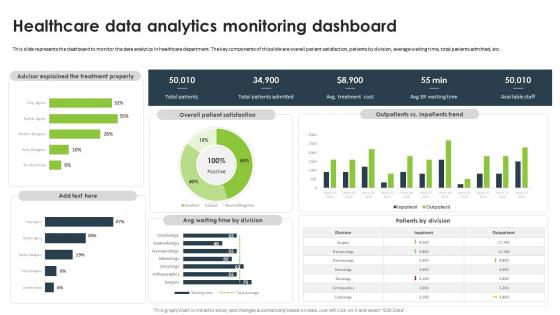 Statistical Analysis For Data Driven Healthcare Data Analytics Monitoring Dashboard
This slide represents the dashboard to monitor the data analytics in healthcare department. The key components of this slide are overall patient satisfaction, patients by division, average waiting time, total patients admitted, etc. Present the topic in a bit more detail with this Statistical Analysis For Data Driven Healthcare Data Analytics Monitoring Dashboard. Use it as a tool for discussion and navigation on Healthcare Data Analytics, Monitoring Dashboard, Healthcare Department. This template is free to edit as deemed fit for your organization. Therefore download it now.
-
 Responsibility Marketing Dashboard For Enabling Data Decisions
This slide illustrates KPI or dashboard for responsibility marketing and includes metrics such as standard, energy efficiency, building materials, etc. Introducing our Responsibility Marketing Dashboard For Enabling Data Decisions set of slides. The topics discussed in these slides are Energy Efficiency, Building Materials, Energy Efficiency. This is an immediately available PowerPoint presentation that can be conveniently customized. Download it and convince your audience.
-
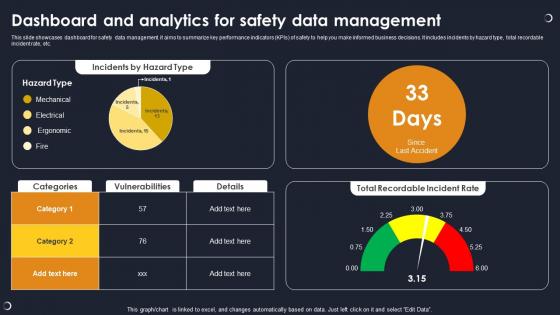 Dashboard And Analytics For Safety Data Management
This slide showcases dashboard for safety data management. it aims to summarize key performance indicators KPIs of safety to help you make informed business decisions. It includes incidents by hazard type, total recordable incident rate, etc. Presenting our well structured Dashboard And Analytics For Safety Data Management. The topics discussed in this slide are Incidents By Hazard Type, Vulnerabilities, Total Recordable Incident Rate. This is an instantly available PowerPoint presentation that can be edited conveniently. Download it right away and captivate your audience.
-
 Data Breach Trend Analysis With KPI Dashboard Implementing Cyber Risk Management Process
The following slide depicts the data breach trends to minimize information leakage and patch affected system. It includes elements such as breach risk trend, breach by risk category, current and future goal analysis etc. Deliver an outstanding presentation on the topic using this Data Breach Trend Analysis With KPI Dashboard Implementing Cyber Risk Management Process. Dispense information and present a thorough explanation of Current And Future Goal Analysis, Breach Risk Trend using the slides given. This template can be altered and personalized to fit your needs. It is also available for immediate download. So grab it now.
-
 Organizational Sales Data Analysis Dashboard
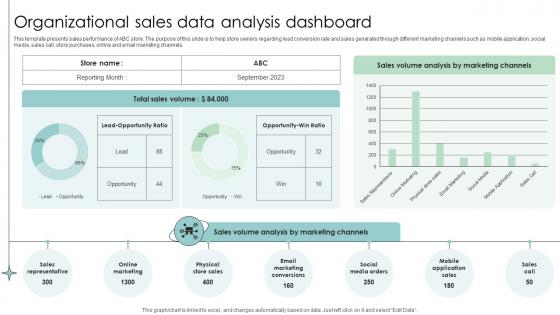
This template presents sales performance of ABC store. The purpose of this slide is to help store owners regarding lead conversion rate and sales generated through different marketing channels such as mobile application, social media, sales call, store purchases, online and email marketing channels. Introducing our Organizational Sales Data Analysis Dashboard set of slides. The topics discussed in these slides are Sales, Analysis, Data. This is an immediately available PowerPoint presentation that can be conveniently customized. Download it and convince your audience.
-
 Dashboard For Big Data Management Big Data Analytics And Management
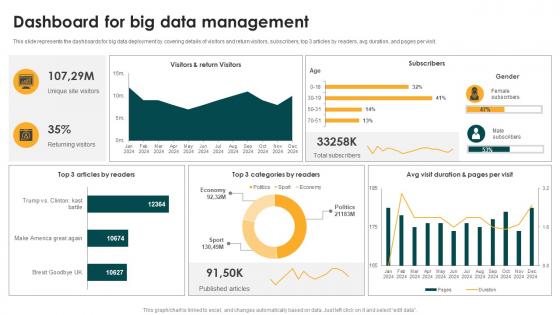
This slide represents the dashboards for big data deployment by covering details of visitors and return visitors, subscribers, top 3 articles by readers, avg duration, and pages per visit. Present the topic in a bit more detail with this Dashboard For Big Data Management Big Data Analytics And Management. Use it as a tool for discussion and navigation on Dashboard For Big Data Management. This template is free to edit as deemed fit for your organization. Therefore download it now.
-
 Dashboard To Evaluate Targeted Social Media Marketing Campaign Essential Guide To Database MKT SS V
The purpose of this slide is to outline a comprehensive dashboard through which marketers can analyze effectiveness of targeted social media campaign performance. The key performance indicators KPIs are social media followers, LinkedIn key metrics, page likes, page impressions, etc. Present the topic in a bit more detail with this Dashboard To Evaluate Targeted Social Media Marketing Campaign Essential Guide To Database MKT SS V Use it as a tool for discussion and navigation on Dashboard Evaluate Targeted, Social Media Marketing, Campaign Performance This template is free to edit as deemed fit for your organization. Therefore download it now.
-
 Essential Guide To Database Marketing Kpi Dashboard To Analyze Overall Business Performance MKT SS V
The purpose of this slide is to highlight dashboard through which marketers can evaluate success of targeted marketing strategies on company performance. It covers major metrics such as branded search, customer value, advertising budget, website conversion rate, etc. Deliver an outstanding presentation on the topic using this Essential Guide To Database Marketing Kpi Dashboard To Analyze Overall Business Performance MKT SS V Dispense information and present a thorough explanation of Customer Value, Demographic Breakdown, Digital using the slides given. This template can be altered and personalized to fit your needs. It is also available for immediate download. So grab it now.
-
 KPI Dashboard To Analyze Targeted Email Marketing Campaign Performance Essential Guide To Database MKT SS V
The purpose of this slide is to highlight key performance indicator KPI dashboard which can be used by marketers to evaluate targeted email marketing campaign performance. The metrics are requests, opens, clicks, opens by country, opens vs clicks by month, etc. Deliver an outstanding presentation on the topic using this KPI Dashboard To Analyze Targeted Email Marketing Campaign Performance Essential Guide To Database MKT SS V Dispense information and present a thorough explanation of KPI Dashboard Analyze Targeted, Email Marketing Campaign Performance using the slides given. This template can be altered and personalized to fit your needs. It is also available for immediate download. So grab it now.
-
 Display Performance Indicators For Data Consolidation Dashboard
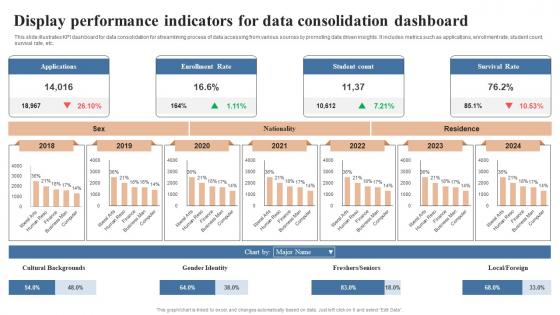
This slide illustrates KPI dashboard for data consolidation for streamlining process of data accessing from various sources by promoting data driven insights. It includes metrics such as applications, enrollment rate, student count, survival rate, etc. Introducing our Display Performance Indicators For Data Consolidation Dashboard set of slides. The topics discussed in these slides are Applications, Enrollment Rate, Survival Rate This is an immediately available PowerPoint presentation that can be conveniently customized. Download it and convince your audience.
-
 Data Driven Dashboard For Tracking Social Media Strategy
This slide represents dashboard for measuring data driven social media strategy. It aims to provide a glance at data directed social media strategies for long term existence. It includes various elements such as conversions, user experience, revenue, etc. Presenting our well structured Data Driven Dashboard For Tracking Social Media Strategy The topics discussed in this slide are Daily Active Users, Account Retention Rate, Seat Retention Rate This is an instantly available PowerPoint presentation that can be edited conveniently. Download it right away and captivate your audience.
-
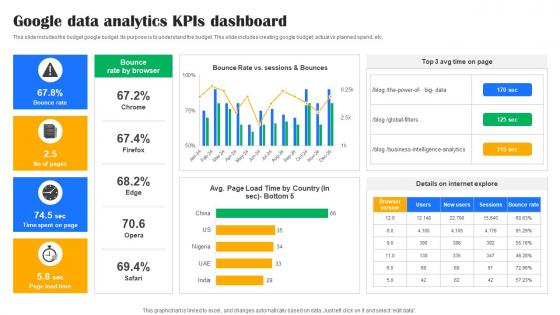 Google Data Analytics KPIS Dashboard
This slide includes the budget google budget. Its purpose is to understand the budget. This slide includes creating google budget, actual vs planned spend, etc. Introducing our Google Data Analytics KPIS Dashboard set of slides. The topics discussed in these slides are Data Analytics, KPIS Dashboard This is an immediately available PowerPoint presentation that can be conveniently customized. Download it and convince your audience.
-
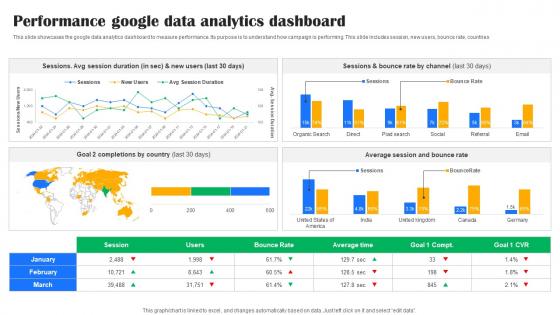 Performance Google Data Analytics Dashboard
This slide showcases the google data analytics dashboard to measure performance. Its purpose is to understand how campaign is performing. This slide includes session, new users, bounce rate, countries. Introducing our Performance Google Data Analytics Dashboard set of slides. The topics discussed in these slides are Performance, Google Data Analytics, Dashboard This is an immediately available PowerPoint presentation that can be conveniently customized. Download it and convince your audience.
-
 Data Breach Response Plan Security Breach Events Tracking Dashboard
This slide represents the dashboard to track data breach attacks. The purpose of this slide is to provide a graphical representation of cyber attacks that occurred in a specific period. It also depicts the overview of different types of attacks. Present the topic in a bit more detail with this Data Breach Response Plan Security Breach Events Tracking Dashboard. Use it as a tool for discussion and navigation on Security Breach Events, Tracking Dashboard, Track Data Breach Attacks, Inspection Of Network. This template is free to edit as deemed fit for your organization. Therefore download it now.
-
 Implementing Big Data Analytics Effective Supplier Performance Assessment Dashboard CRP DK SS
This slide showcases dashboard for analyzing supplier performance with KPIs such as defect rate, on time supplies, average procurement cycle, delivery time etc. Deliver an outstanding presentation on the topic using this Implementing Big Data Analytics Effective Supplier Performance Assessment Dashboard CRP DK SS. Dispense information and present a thorough explanation of Analyzing Supplier Performance, Average Procurement Cycle, Assessment Dashboard using the slides given. This template can be altered and personalized to fit your needs. It is also available for immediate download. So grab it now.
-
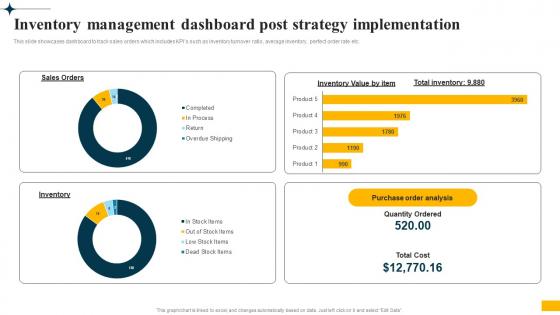 Implementing Big Data Analytics Inventory Management Dashboard Post Strategy Implementation CRP DK SS
This slide showcases dashboard to track sales orders which includes KPIs such as inventory turnover ratio, average inventory, perfect order rate etc. Deliver an outstanding presentation on the topic using this Implementing Big Data Analytics Inventory Management Dashboard Post Strategy Implementation CRP DK SS. Dispense information and present a thorough explanation of Inventory Management Dashboard, Post Strategy Implementation, Dashboard To Track Sales using the slides given. This template can be altered and personalized to fit your needs. It is also available for immediate download. So grab it now.
-
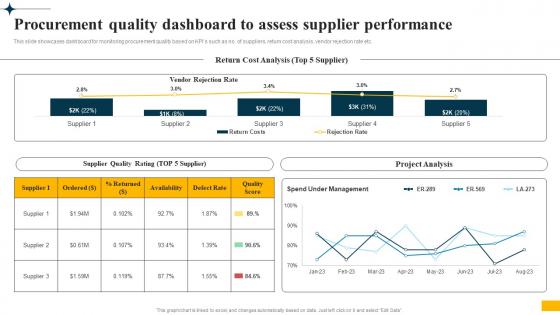 Implementing Big Data Analytics Procurement Quality Dashboard To Assess Supplier Performance CRP DK SS
This slide showcases dashboard for monitoring procurement quality based on KPIs such as no. of suppliers, return cost analysis, vendor rejection rate etc. Present the topic in a bit more detail with this Implementing Big Data Analytics Procurement Quality Dashboard To Assess Supplier Performance CRP DK SS. Use it as a tool for discussion and navigation on Procurement Quality Dashboard, Assess Supplier Performance, Vendor Rejection Rate. This template is free to edit as deemed fit for your organization. Therefore download it now.
-
 Implementing Big Data Analytics Supplier Performance Assessment Dashboard Post Strategy CRP DK SS
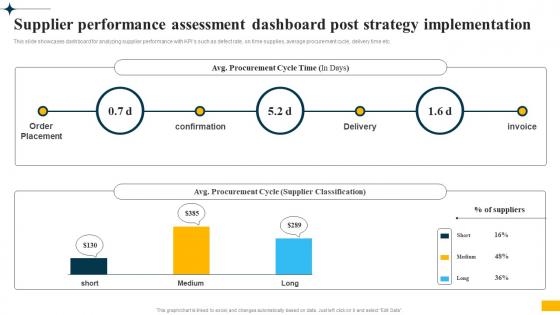
This slide showcases dashboard for analyzing supplier performance with KPIs such as defect rate, on time supplies, average procurement cycle, delivery time etc. Deliver an outstanding presentation on the topic using this Implementing Big Data Analytics Supplier Performance Assessment Dashboard Post Strategy CRP DK SS. Dispense information and present a thorough explanation of Supplier Performance Assessment, Dashboard Post, Strategy Implementation, Average Procurement Cycle using the slides given. This template can be altered and personalized to fit your needs. It is also available for immediate download. So grab it now.
-
 Dashboard To Evaluate Targeted Social Database Marketing Practices To Increase MKT SS V
The purpose of this slide is to outline a comprehensive dashboard through which marketers can analyze effectiveness of targeted social media campaign performance. The key performance indicators KPIs are social media followers, LinkedIn key metrics, page likes, page impressions, etc. Deliver an outstanding presentation on the topic using this Dashboard To Evaluate Targeted Social Database Marketing Practices To Increase MKT SS V. Dispense information and present a thorough explanation of Impressions, Subscribers, Targeted using the slides given. This template can be altered and personalized to fit your needs. It is also available for immediate download. So grab it now.
-
 KPI Dashboard To Analyze Overall Database Marketing Practices To Increase MKT SS V
The purpose of this slide is to highlight dashboard through which marketers can evaluate success of targeted marketing strategies on company performance. It covers major metrics such as branded search, customer value, advertising budget, website conversion rate, etc. Deliver an outstanding presentation on the topic using this KPI Dashboard To Analyze Overall Database Marketing Practices To Increase MKT SS V. Dispense information and present a thorough explanation of Advertising, Utilization, Performance using the slides given. This template can be altered and personalized to fit your needs. It is also available for immediate download. So grab it now.
-
 KPI Dashboard To Analyze Targeted Database Marketing Practices To Increase MKT SS V
The purpose of this slide is to highlight key performance indicator KPI dashboard which can be used by marketers to evaluate targeted email marketing campaign performance. The metrics are requests, opens, clicks, opens by country, opens vs clicks by month, etc. Present the topic in a bit more detail with this KPI Dashboard To Analyze Targeted Database Marketing Practices To Increase MKT SS V. Use it as a tool for discussion and navigation on Requests, Percentage, Reports. This template is free to edit as deemed fit for your organization. Therefore download it now.
-
 Big Data Analytics Dashboard In Finance
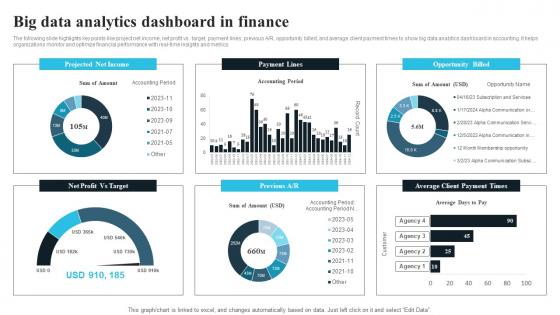
The following slide highlights key points like project net income, net profit vs. target, payment lines, previous AR, opportunity billed, and average client payment times to show big data analytics dashboard in accounting. It helps organizations monitor and optimize financial performance with real-time insights and metrics. Introducing our Big Data Analytics Dashboard In Finance set of slides. The topics discussed in these slides are Projected Net Income, Opportunity Billed. This is an immediately available PowerPoint presentation that can be conveniently customized. Download it and convince your audience.
-
 Data Breach Trend Analysis With KPI Dashboard Cyber Risk Assessment
The following slide depicts the data breach trends to minimize information leakage and patch affected system. It includes elements such as breach risk trend, breach by risk category, current and future goal analysis etc. Present the topic in a bit more detail with this Data Breach Trend Analysis With KPI Dashboard Cyber Risk Assessment Use it as a tool for discussion and navigation on Breach Risk, Business Unit, Risk Category This template is free to edit as deemed fit for your organization. Therefore download it now.
-
 Marketing Outreach Dashboard For Ensuring Data Centralization
This slide illustrates KPI dashboard for allowing real time monitoring, analysis and decision making related to marketing outreach efforts. It includes metrics such as conversion rate, prospects, fresh prospects, call categorization and top prospects. Presenting our well structured Marketing Outreach Dashboard For Ensuring Data Centralization. The topics discussed in this slide are Dashboard, Ensuring, Data. This is an instantly available PowerPoint presentation that can be edited conveniently. Download it right away and captivate your audience.
-
 Data Encryption Performance Tracking Dashboard Encryption For Data Privacy In Digital Age It
This slide represents the dashboard which can be utilized by organization to monitor cryptographic security. It includes overall progress, number of critical risks identified, initiatives, incident management, compliance, patches, highest number of critical incidents, etc. Deliver an outstanding presentation on the topic using this Data Encryption Performance Tracking Dashboard Encryption For Data Privacy In Digital Age It. Dispense information and present a thorough explanation of Encryption, Performance, Dashboard using the slides given. This template can be altered and personalized to fit your needs. It is also available for immediate download. So grab it now.
-
 Big Data Analytics Dashboard For Electric Energy Sector Industries
This slide represents the dashboard of big data analytics providing key insights to enhance energy sector efficiency. It includes various KPIs such as total consumption, power cuts, etc. Introducing our Big Data Analytics Dashboard For Electric Energy Sector Industries set of slides. The topics discussed in these slides are Big Data Analytics Dashboard, Electric Energy Sector Industries. This is an immediately available PowerPoint presentation that can be conveniently customized. Download it and convince your audience.


