Powerpoint Templates and Google slides for Business Data Analytics
Save Your Time and attract your audience with our fully editable PPT Templates and Slides.
-
 Leveraging Digital Analytics To Develop Data Insights And Optimize Business Operations Data Analytics CD
Ditch the Dull templates and opt for our engaging Leveraging Digital Analytics To Develop Data Insights And Optimize Business Operations Data Analytics CD deck to attract your audience. Our visually striking design effortlessly combines creativity with functionality, ensuring your content shines through. Compatible with Microsoft versions and Google Slides, it offers seamless integration of presentation. Save time and effort with our pre-designed PPT layout, while still having the freedom to customize fonts, colors, and everything you ask for. With the ability to download in various formats like JPG, JPEG, and PNG, sharing your slides has never been easier. From boardroom meetings to client pitches, this deck can be the secret weapon to leaving a lasting impression.
-
 Implementing Workforce Analytics In Business For Enhancing Employee Retention Rates Data Analytics CD
This complete deck covers various topics and highlights important concepts. It has PPT slides which cater to your business needs. This complete deck presentation emphasizes Implementing Workforce Analytics In Business For Enhancing Employee Retention Rates Data Analytics CD and has templates with professional background images and relevant content. This deck consists of total of one hundred two slides. Our designers have created customizable templates, keeping your convenience in mind. You can edit the color, text and font size with ease. Not just this, you can also add or delete the content if needed. Get access to this fully editable complete presentation by clicking the download button below.
-
 Data Integration For Improved Business Analytics Powerpoint Presentation Slides
Deliver this complete deck to your team members and other collaborators. Encompassed with stylized slides presenting various concepts, this Data Integration For Improved Business Analytics Powerpoint Presentation Slides is the best tool you can utilize. Personalize its content and graphics to make it unique and thought-provoking. All the ninety slides are editable and modifiable, so feel free to adjust them to your business setting. The font, color, and other components also come in an editable format making this PPT design the best choice for your next presentation. So, download now.
-
 Implementing Data Analytics To Enhance Telecom Business Operations Data Analytics CD
Ditch the Dull templates and opt for our engaging Implementing Data Analytics To Enhance Telecom Business Operations Data Analytics CD deck to attract your audience. Our visually striking design effortlessly combines creativity with functionality, ensuring your content shines through. Compatible with Microsoft versions and Google Slides, it offers seamless integration of presentation. Save time and effort with our pre-designed PPT layout, while still having the freedom to customize fonts, colors, and everything you ask for. With the ability to download in various formats like JPG, JPEG, and PNG, sharing your slides has never been easier. From boardroom meetings to client pitches, this deck can be the secret weapon to leaving a lasting impression.
-
 Transformation Toolkit For Data Analytics And Business Intelligence Powerpoint Presentation Slides
Deliver an informational PPT on various topics by using this Transformation Toolkit For Data Analytics And Business Intelligence Powerpoint Presentation Slides. This deck focuses and implements best industry practices, thus providing a birds-eye view of the topic. Encompassed with ninety two slides, designed using high-quality visuals and graphics, this deck is a complete package to use and download. All the slides offered in this deck are subjective to innumerable alterations, thus making you a pro at delivering and educating. You can modify the color of the graphics, background, or anything else as per your needs and requirements. It suits every business vertical because of its adaptable layout.
-
 Enhancing Business Insights Implementing Product Analytics In Organizations Data Analytics CD
Deliver an informational PPT on various topics by using this Enhancing Business Insights Implementing Product Analytics In Organizations Data Analytics CD. This deck focuses and implements best industry practices, thus providing a birds-eye view of the topic. Encompassed with eighty four slides, designed using high-quality visuals and graphics, this deck is a complete package to use and download. All the slides offered in this deck are subjective to innumerable alterations, thus making you a pro at delivering and educating. You can modify the color of the graphics, background, or anything else as per your needs and requirements. It suits every business vertical because of its adaptable layout.
-
 Complete Guide To Business Analytics For Improving Company Operations Complete Deck Data Analytics CD
Step up your game with our enchanting Complete Guide To Business Analytics For Improving Company Operations Complete Deck Data Analytics CD deck, guaranteed to leave a lasting impression on your audience. Crafted with a perfect balance of simplicity, and innovation, our deck empowers you to alter it to your specific needs. You can also change the color theme of the slide to mold it to your company specific needs. Save time with our ready-made design, compatible with Microsoft versions and Google Slides. Additionally, its available for download in various formats including JPG, JPEG, and PNG. Outshine your competitors with our fully editable and customized deck.
-
 Predictive Analytics For Data Driven Business Decision Making Powerpoint Presentation Slides AI CD
Step up your game with our enchanting Predictive Analytics For Data Driven Business Decision Making Powerpoint Presentation Slides AI CD deck, guaranteed to leave a lasting impression on your audience. Crafted with a perfect balance of simplicity, and innovation, our deck empowers you to alter it to your specific needs. You can also change the color theme of the slide to mold it to your company specific needs. Save time with our ready-made design, compatible with Microsoft versions and Google Slides. Additionally, its available for download in various formats including JPG, JPEG, and PNG. Outshine your competitors with our fully editable and customized deck.
-
 Business data analytics powerpoint presentation slides
Enthrall your audience with this Business Data Analytics Powerpoint Presentation Slides. Increase your presentation threshold by deploying this well crafted template. It acts as a great communication tool due to its well researched content. It also contains stylized icons, graphics, visuals etc, which make it an immediate attention grabber. Comprising twenty nine slides, this complete deck is all you need to get noticed. All the slides and their content can be altered to suit your unique business setting. Not only that, other components and graphics can also be modified to add personal touches to this prefabricated set.
-
 100 day plan education platform business credit data analytics
If you require a professional template with great design, then this 100 Day Plan Education Platform Business Credit Data Analytics is an ideal fit for you. Deploy it to enthrall your audience and increase your presentation threshold with the right graphics, images, and structure. Portray your ideas and vision using fourteen slides included in this complete deck. This template is suitable for expert discussion meetings presenting your views on the topic. With a variety of slides having the same thematic representation, this template can be regarded as a complete package. It employs some of the best design practices, so everything is well-structured. Not only this, it responds to all your needs and requirements by quickly adapting itself to the changes you make. This PPT slideshow is available for immediate download in PNG, JPG, and PDF formats, further enhancing its usability. Grab it by clicking the download button.
-
 Three overlapping circle business credit lead generation data analytics
Engage buyer personas and boost brand awareness by pitching yourself using this prefabricated set. This Three Overlapping Circle Business Credit Lead Generation Data Analytics is a great tool to connect with your audience as it contains high-quality content and graphics. This helps in conveying your thoughts in a well-structured manner. It also helps you attain a competitive advantage because of its unique design and aesthetics. In addition to this, you can use this PPT design to portray information and educate your audience on various topics. With fourteen slides, this is a great design to use for your upcoming presentations. Not only is it cost-effective but also easily pliable depending on your needs and requirements. As such color, font, or any other design component can be altered. It is also available for immediate download in different formats such as PNG, JPG, etc. So, without any further ado, download it now.
-
 Data Analytic Icon Business Growth Analysis Gear Magnifying Glass Dashboard
This complete deck can be used to present to your team. It has PPT slides on various topics highlighting all the core areas of your business needs. This complete deck focuses on Data Analytic Icon Business Growth Analysis Gear Magnifying Glass Dashboard and has professionally designed templates with suitable visuals and appropriate content. This deck consists of total of twelve slides. All the slides are completely customizable for your convenience. You can change the colour, text and font size of these templates. You can add or delete the content if needed. Get access to this professionally designed complete presentation by clicking the download button below.
-
 Data Business Analytics Dollar Storage Marketing Dashboard Customers
If you require a professional template with great design, then this Data Business Analytics Dollar Storage Marketing Dashboard Customers is an ideal fit for you. Deploy it to enthrall your audience and increase your presentation threshold with the right graphics, images, and structure. Portray your ideas and vision using twelve slides included in this complete deck. This template is suitable for expert discussion meetings presenting your views on the topic. With a variety of slides having the same thematic representation, this template can be regarded as a complete package. It employs some of the best design practices, so everything is well-structured. Not only this, it responds to all your needs and requirements by quickly adapting itself to the changes you make. This PPT slideshow is available for immediate download in PNG, JPG, and PDF formats, further enhancing its usability. Grab it by clicking the download button.
-
 Data Usage Business Analytics Services Statistics Documenting
Introduce your topic and host expert discussion sessions with this Data Usage Business Analytics Services Statistics Documenting. This template is designed using high-quality visuals, images, graphics, etc, that can be used to showcase your expertise. Different topics can be tackled using the twelve slides included in this template. You can present each topic on a different slide to help your audience interpret the information more effectively. Apart from this, this PPT slideshow is available in two screen sizes, standard and widescreen making its delivery more impactful. This will not only help in presenting a birds-eye view of the topic but also keep your audience engaged. Since this PPT slideshow utilizes well-researched content, it induces strategic thinking and helps you convey your message in the best possible manner. The biggest feature of this design is that it comes with a host of editable features like color, font, background, etc. So, grab it now to deliver a unique presentation every time.
-
 Data Types Analytics Business Programming Financial Government Statistics
Engage buyer personas and boost brand awareness by pitching yourself using this prefabricated set. This Data Types Analytics Business Programming Financial Government Statistics is a great tool to connect with your audience as it contains high-quality content and graphics. This helps in conveying your thoughts in a well-structured manner. It also helps you attain a competitive advantage because of its unique design and aesthetics. In addition to this, you can use this PPT design to portray information and educate your audience on various topics. With twelve slides, this is a great design to use for your upcoming presentations. Not only is it cost-effective but also easily pliable depending on your needs and requirements. As such color, font, or any other design component can be altered. It is also available for immediate download in different formats such as PNG, JPG, etc. So, without any further ado, download it now.
-
 Business Data Sources Product Customer Analytics Organization Generation
Introduce your topic and host expert discussion sessions with this Business Data Sources Product Customer Analytics Organization Generation. This template is designed using high-quality visuals, images, graphics, etc, that can be used to showcase your expertise. Different topics can be tackled using the twelve slides included in this template. You can present each topic on a different slide to help your audience interpret the information more effectively. Apart from this, this PPT slideshow is available in two screen sizes, standard and widescreen making its delivery more impactful. This will not only help in presenting a birds-eye view of the topic but also keep your audience engaged. Since this PPT slideshow utilizes well-researched content, it induces strategic thinking and helps you convey your message in the best possible manner. The biggest feature of this design is that it comes with a host of editable features like color, font, background, etc. So, grab it now to deliver a unique presentation every time.
-
 Data Audit Checklist Analytics Organization Maintenance Management Business
Deliver a lucid presentation by utilizing this Data Audit Checklist Analytics Organization Maintenance Management Business. Use it to present an overview of the topic with the right visuals, themes, shapes, and graphics. This is an expertly designed complete deck that reinforces positive thoughts and actions. Use it to provide visual cues to your audience and help them make informed decisions. A wide variety of discussion topics can be covered with this creative bundle such as Data Audit Checklist, Analytics, Organization, Maintenance, Management. All the twelve slides are available for immediate download and use. They can be edited and modified to add a personal touch to the presentation. This helps in creating a unique presentation every time. Not only that, with a host of editable features, this presentation can be used by any industry or business vertical depending on their needs and requirements. The compatibility with Google Slides is another feature to look out for in the PPT slideshow.
-
 Curved timeline data analytics business development gross profit
Deliver a lucid presentation by utilizing this Curved Timeline Data Analytics Business Development Gross Profit. Use it to present an overview of the topic with the right visuals, themes, shapes, and graphics. This is an expertly designed complete deck that reinforces positive thoughts and actions. Use it to provide visual cues to your audience and help them make informed decisions. A wide variety of discussion topics can be covered with this creative bundle such as Curved Timeline, Data Analytics, Business Development, Gross Profit. All the twelve slides are available for immediate download and use. They can be edited and modified to add a personal touch to the presentation. This helps in creating a unique presentation every time. Not only that, with a host of editable features, this presentation can be used by any industry or business vertical depending on their needs and requirements. The compatibility with Google Slides is another feature to look out for in the PPT slideshow.
-
 Data analytics operations business marketing sale developer community ecosystem
If you require a professional template with great design, then this Data Analytics Operations Business Marketing Sale Developer Community Ecosystem is an ideal fit for you. Deploy it to enthrall your audience and increase your presentation threshold with the right graphics, images, and structure. Portray your ideas and vision using eleven slides included in this complete deck. This template is suitable for expert discussion meetings presenting your views on the topic. With a variety of slides having the same thematic representation, this template can be regarded as a complete package. It employs some of the best design practices, so everything is well-structured. Not only this, it responds to all your needs and requirements by quickly adapting itself to the changes you make. This PPT slideshow is available for immediate download in PNG, JPG, and PDF formats, further enhancing its usability. Grab it by clicking the download button.
-
 Data AI Artificial Intelligence Business Platform Data AI Ascend Tool Visual Analytics AI SS
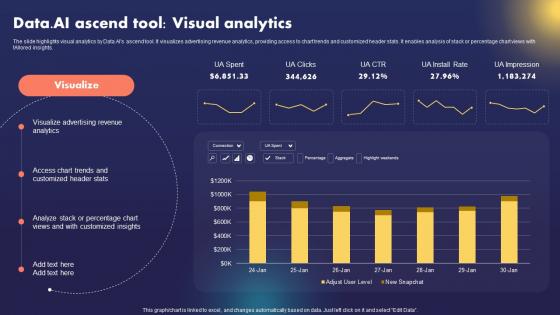
The slide highlights visual analytics by Data.AIs ascend tool. It visualizes advertising revenue analytics, providing access to chart trends and customized header stats. It enables analysis of stack or percentage chart views with tAIlored insights. Deliver an outstanding presentation on the topic using this Data AI Artificial Intelligence Business Platform Data AI Ascend Tool Visual Analytics AI SS. Dispense information and present a thorough explanation of Visual Analytics By Data AI, Visualizes Advertising, Revenue Analytics, Customized Header Stats using the slides given. This template can be altered and personalized to fit your needs. It is also available for immediate download. So grab it now.
-
 Impacts Of Big Data Management On Business Big Data Analytics And Management
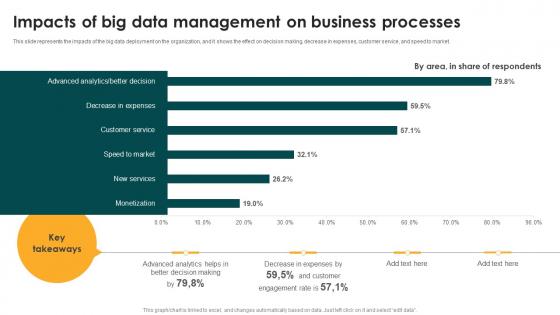
This slide represents the impacts of the big data deployment on the organization, and it shows the effect on decision making, decrease in expenses, customer service, and speed to market. Present the topic in a bit more detail with this Impacts Of Big Data Management On Business Big Data Analytics And Management. Use it as a tool for discussion and navigation on Impacts Of Big Data, Management On Business. This template is free to edit as deemed fit for your organization. Therefore download it now.
-
 Implementing Big Data Analytics How Big Data Analytics Impact Supply Chain Businesses CRP DK SS
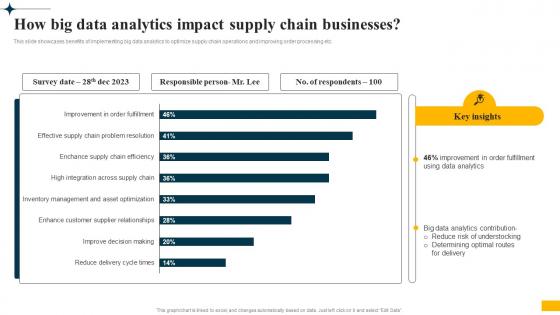
This slide showcases benefits of implementing big data analytics to optimize supply chain operations and improving order processing etc. Deliver an outstanding presentation on the topic using this Implementing Big Data Analytics How Big Data Analytics Impact Supply Chain Businesses CRP DK SS. Dispense information and present a thorough explanation of Big Data Analytics, Supply Chain Operations, Supply Chain Businesses, Reduce Risk Of Understocking using the slides given. This template can be altered and personalized to fit your needs. It is also available for immediate download. So grab it now.
-
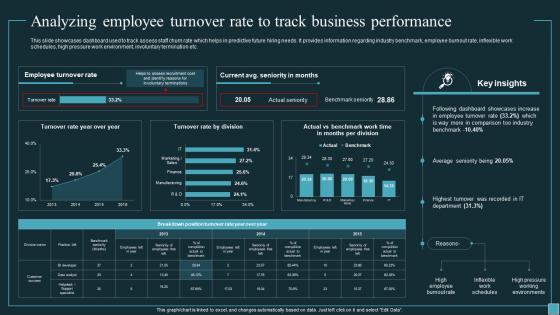 Analyzing Employee Turnover Rate To Track Business Implementing Workforce Analytics Data Analytics SS
This slide showcases dashboard used to track assess staff churn rate which helps in predictive future hiring needs. It provides information regarding industry benchmark, employee burnout rate, inflexible work schedules, high pressure work environment, involuntary termination etc. Present the topic in a bit more detail with this Analyzing Employee Turnover Rate To Track Business Implementing Workforce Analytics Data Analytics SS. Use it as a tool for discussion and navigation on Analyzing Employee Turnover Rate, Track Business Performance, Work Environment, Involuntary Termination. This template is free to edit as deemed fit for your organization. Therefore download it now.
-
 Impact Of Big Data Analytics On Retail Business Performance Data Driven Insights Big Data Analytics SS V
This slide showcases key benefits on implementing big data analytics on business performance efficiency. It provides information regarding KPIs such as marketing ROI, resource allocation, operational efficiency and cost management. Deliver an outstanding presentation on the topic using this Impact Of Big Data Analytics On Retail Business Performance Data Driven Insights Big Data Analytics SS V Dispense information and present a thorough explanation of Pre Implementation, Post Implementation, Marketing ROI using the slides given. This template can be altered and personalized to fit your needs. It is also available for immediate download. So grab it now.
-
 Customer Acquisition Enhancing Business Insights Implementing Product Data Analytics SS V
This slide provides customer data of website ABC aimed at analysing engagement levels. It covers details on visits, pages, churn, bounce rate, device usage, sources of traffic, etc with key insights. Present the topic in a bit more detail with this Customer Acquisition Enhancing Business Insights Implementing Product Data Analytics SS V. Use it as a tool for discussion and navigation on Customer Acquisition, Data Analysis, Ecommerce Website. This template is free to edit as deemed fit for your organization. Therefore download it now.
-
 Global Product Enhancing Business Insights Implementing Product Data Analytics SS V
This slide showcase a graphical representation global product analytics market. It includes present and forecasted values of advanced analytics usage globally with key takeaways on market situation. Present the topic in a bit more detail with this Global Product Enhancing Business Insights Implementing Product Data Analytics SS V. Use it as a tool for discussion and navigation on Key Insights, Global Product Analytics, Reasons. This template is free to edit as deemed fit for your organization. Therefore download it now.
-
 Impact Assessment On Enhancing Business Insights Implementing Product Data Analytics SS V
This slide highlights impact assessment of trend analysis on customer acquisition metrics such as bounce and churn rate. It covers a graph highlighting trend in customer acquisition metrics over four quarters with key insights. Deliver an outstanding presentation on the topic using this Impact Assessment On Enhancing Business Insights Implementing Product Data Analytics SS V. Dispense information and present a thorough explanation of Key Insights, Customer Acquisition, Virtual Assistants using the slides given. This template can be altered and personalized to fit your needs. It is also available for immediate download. So grab it now.
-
 Impact Assessment Enhancing Business Insights Implementing Product Data Analytics SS V
This slide highlights impact of attribution analysis on click through rate aimed at improving effectiveness of call to action button. It covers details on total clicks, impressions, average CTR, position with key insights. Present the topic in a bit more detail with this Impact Assessment Enhancing Business Insights Implementing Product Data Analytics SS V. Use it as a tool for discussion and navigation on Impact Assessment, Click Through Rate. This template is free to edit as deemed fit for your organization. Therefore download it now.
-
 Impact Of Product Analysis Enhancing Business Insights Implementing Product Data Analytics SS V
This slide highlights impact analysis of product analysis on the following product KPIs. It showcases a graph outlining impact on customer acquisition cost, number of active users and churn rate for three successful quarters with key insights. Deliver an outstanding presentation on the topic using this Impact Of Product Analysis Enhancing Business Insights Implementing Product Data Analytics SS V. Dispense information and present a thorough explanation of Key Insights, Customer Acquisition, Churn Rate using the slides given. This template can be altered and personalized to fit your needs. It is also available for immediate download. So grab it now.
-
 Product Analytics Dashboard Enhancing Business Insights Implementing Product Data Analytics SS V
This slide illustrates a dashboard to monitor customer engagement on company website by leveraging product analytics tools aimed at making necessary improvements. It covers insights regarding active monthly users, new users, total completed purchases, screen views, average duration of session, etc. Present the topic in a bit more detail with this Product Analytics Dashboard Enhancing Business Insights Implementing Product Data Analytics SS V. Use it as a tool for discussion and navigation on Product Analytics Dashboard, Track Engagement. This template is free to edit as deemed fit for your organization. Therefore download it now.
-
 Product Analytics Kpi Enhancing Business Insights Implementing Product Data Analytics SS V
This slide illustrates a dashboard to monitor the lead generation on website page using product analytics aimed at making necessary improvements. It covers insights regarding analysis of lead conversions, event retention rate and page views. Deliver an outstanding presentation on the topic using this Product Analytics Kpi Enhancing Business Insights Implementing Product Data Analytics SS V. Dispense information and present a thorough explanation of Product Analytics, KPI Dashboard, Lead Generation using the slides given. This template can be altered and personalized to fit your needs. It is also available for immediate download. So grab it now.
-
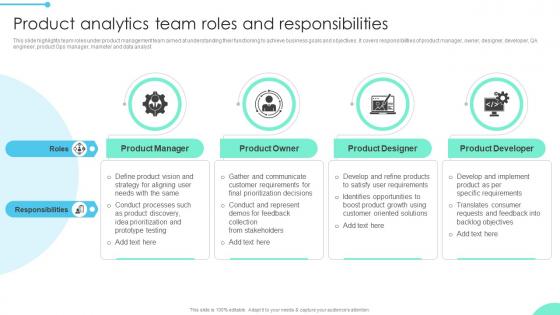 Product Analytics Team Enhancing Business Insights Implementing Product Data Analytics SS V
This slide highlights team roles under product management team aimed at understanding their functioning to achieve business goals and objectives. It covers responsibilities of product manager, owner, designer, developer, QA engineer, product Ops manager, marketer and data analyst. Increase audience engagement and knowledge by dispensing information using Product Analytics Team Enhancing Business Insights Implementing Product Data Analytics SS V. This template helps you present information on four stages. You can also present information on Product Manager, Product Owner, Product Designer using this PPT design. This layout is completely editable so personaize it now to meet your audiences expectations.
-
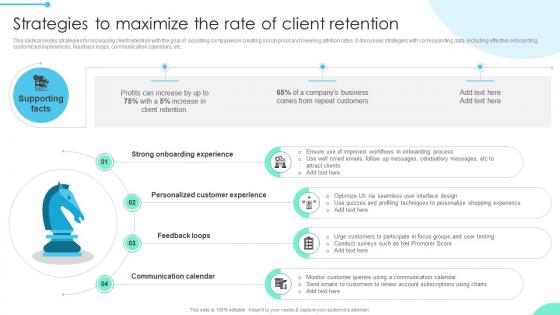 Strategies To Maximize Enhancing Business Insights Implementing Product Data Analytics SS V
This slide provides strategies for increasing client retention with the goal of assisting companies in creating social proof and lowering attrition rates. It discusses strategies with corresponding data, including effective onboarding, customized experiences, feedback loops, communication calendars, etc. Increase audience engagement and knowledge by dispensing information using Strategies To Maximize Enhancing Business Insights Implementing Product Data Analytics SS V. This template helps you present information on four stages. You can also present information on Onboarding Experience, Customer Experience, Feedback Loops using this PPT design. This layout is completely editable so personaize it now to meet your audiences expectations.
-
 Analyzing Company Gross Profit Margin And Order Value Complete Guide To Business Analytics Data Analytics SS
This slide showcases dashboard to evaluate business profit margins which helps in identifying identify revenue streams. It includes elements such as ordered items, average order value, net profit margin, ineffective marketing, competition, pricing, interest rate etc. Deliver an outstanding presentation on the topic using this Analyzing Company Gross Profit Margin And Order Value Complete Guide To Business Analytics Data Analytics SS. Dispense information and present a thorough explanation of Poor Pricing, Increase In Interest Rates, Ineffective Marketing, Ineffective Pricing Strategy, Decrease In Revenue Streams using the slides given. This template can be altered and personalized to fit your needs. It is also available for immediate download. So grab it now.
-
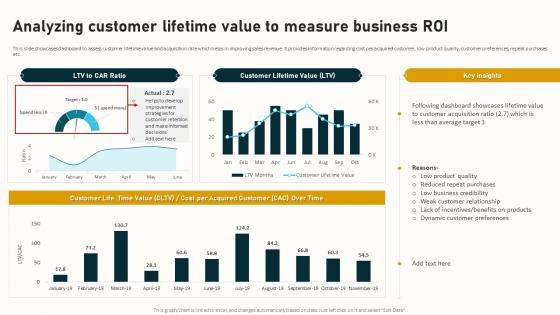 Analyzing Customer Lifetime Value To Measure Complete Guide To Business Analytics Data Analytics SS
This slide showcases dashboard to assess customer lifetime value and acquisition rate which helps in improving sales revenue. It provides information regarding cost per acquired customer, low product quality, customer preferences, repeat purchases etc. Present the topic in a bit more detail with this Analyzing Customer Lifetime Value To Measure Complete Guide To Business Analytics Data Analytics SS. Use it as a tool for discussion and navigation on Analyzing Customer Lifetime, Value To Measure Business, Customer Preferences, Repeat Purchases. This template is free to edit as deemed fit for your organization. Therefore download it now.
-
 Analyzing Customer Repeat Rate To Check Revenue Growth Complete Guide To Business Analytics Data Analytics SS
This slide showcases dashboard for monitoring customer repeat rate which helps in analyzing sales conversion and revenue generation. It includes elements such as customer appreciation, customer service, repeat revenue, customers, lifetime value etc. Deliver an outstanding presentation on the topic using this Analyzing Customer Repeat Rate To Check Revenue Growth Complete Guide To Business Analytics Data Analytics SS. Dispense information and present a thorough explanation of Analyzing Customer Repeat Rate, Check Revenue Growth, Repeat Revenue, Customers using the slides given. This template can be altered and personalized to fit your needs. It is also available for immediate download. So grab it now.
-
 Analyzing Employee Turnover Rate To Check Staffing Levels Complete Guide To Business Analytics Data Analytics SS
This slide showcases dashboard for tracking employee attrition rate which helps in identifying business performance gaps. It provides information regarding KPIs such as average headcount, total departures, annual attrition, total departure cost etc. Present the topic in a bit more detail with this Analyzing Employee Turnover Rate To Check Staffing Levels Complete Guide To Business Analytics Data Analytics SS. Use it as a tool for discussion and navigation on Analyzing Employee Turnover Rate, Total Departures, Annual Attrition, Total Departure Cost. This template is free to edit as deemed fit for your organization. Therefore download it now.
-
 Dashboard To Monitor Employee Performance Complete Guide To Business Analytics Data Analytics SS
This slide showcases dashboard for tracking employee performance at workplace which helps in improving business revenue. It provides information regarding KPIs such as employee productivity, overall labor effectiveness, top employees by attendance, work done, project achievements etc. Deliver an outstanding presentation on the topic using this Dashboard To Monitor Employee Performance Complete Guide To Business Analytics Data Analytics SS. Dispense information and present a thorough explanation of Dashboard To Monitor Employee, Performance Post, Strategy Implementation using the slides given. This template can be altered and personalized to fit your needs. It is also available for immediate download. So grab it now.
-
 Dashboard To Track Business Financial Performance Complete Guide To Business Analytics Data Analytics SS
This slide showcases dashboard illustrating company financial performance which helps in analyzing revenue growth and identifying gaps. It provide information regarding KPIs such as gross profit margin, opex ratio, earning before interest and taxes, vendor payment error rate etc. Present the topic in a bit more detail with this Dashboard To Track Business Financial Performance Complete Guide To Business Analytics Data Analytics SS. Use it as a tool for discussion and navigation on Dashboard To Track Business, Financial Performance, Post Strategy Implementation. This template is free to edit as deemed fit for your organization. Therefore download it now.
-
 Global Business Analytics Market Size Overview Complete Guide To Business Analytics Data Analytics SS
This slide highlights global business analytics market overview which helps in making informed investment decisions. It provides information regarding annual growth rate, key market drivers, major business players and market segmentation. Present the topic in a bit more detail with this Global Business Analytics Market Size Overview Complete Guide To Business Analytics Data Analytics SS. Use it as a tool for discussion and navigation on Global Business Analytics, Market Size Overview, Market Segmentation. This template is free to edit as deemed fit for your organization. Therefore download it now.
-
 Key Statistics Associated With Business Analytics Complete Guide To Business Analytics Data Analytics SS
This slide showcases various teams involved in utilizing business analytics to improve business operations and optimize performance. It provides information regarding sales teams, human resource, finance and senior executives. Deliver an outstanding presentation on the topic using this Key Statistics Associated With Business Analytics Complete Guide To Business Analytics Data Analytics SS. Dispense information and present a thorough explanation of Key Statistics Associated, Business Analytics Market, Data Analytics Influences, Business Operations using the slides given. This template can be altered and personalized to fit your needs. It is also available for immediate download. So grab it now.
-
 Monitoring Inventory Turnover To Check Stock Levels Complete Guide To Business Analytics Data Analytics SS
This slide provides dashboard for tracking inventory or levels which helps in analyzing product demand based on customer needs. It includes elements such as insufficient stocking, bulk orders, lost sales, poor stock management etc. Deliver an outstanding presentation on the topic using this Monitoring Inventory Turnover To Check Stock Levels Complete Guide To Business Analytics Data Analytics SS. Dispense information and present a thorough explanation of Monitoring Inventory Turnover, Insufficient Stocking, Multiple Bulk Orders using the slides given. This template can be altered and personalized to fit your needs. It is also available for immediate download. So grab it now.
-
 Monitoring Staff Absenteeism Rate To Assess Complete Guide To Business Analytics Data Analytics SS
This slide showcases dashboard for analyzing employee absenteeism rate which helps in identifying reasons for high number of leaves. It provides information regarding absenteeism rate, average days on leave by business unit, total leave days, average leave costs , annual leaves balance etc. Present the topic in a bit more detail with this Monitoring Staff Absenteeism Rate To Assess Complete Guide To Business Analytics Data Analytics SS. Use it as a tool for discussion and navigation on Monitoring Staff Absenteeism Rate, Assess Performance Gaps, Work Related Stress, Workplace Harassment. This template is free to edit as deemed fit for your organization. Therefore download it now.
-
 Sales Performance Tracking Dashboard Post Strateg Complete Guide To Business Analytics Data Analytics SS
This slide showcases dashboard for monitoring sales department performance post implementing improvement strategies based on data insights. It provides information regarding revenue generated, current sales pipeline value, sales opportunities, new deals, sales growth by market segment etc. Deliver an outstanding presentation on the topic using this Sales Performance Tracking Dashboard Post Strateg Complete Guide To Business Analytics Data Analytics SS. Dispense information and present a thorough explanation of Sales Performance Tracking, Dashboard Post, Strategy Implementation, Sales Opportunities using the slides given. This template can be altered and personalized to fit your needs. It is also available for immediate download. So grab it now.
-
 Trend 1 Rise In Adoption Of Advanced Analytics Tools Complete Guide To Business Analytics Data Analytics SS
This slide showcases emerging trend of adoption of advanced analytics which helps in real time data processing. It includes elements such as market size, data mining, neural networks, business operations etc. Deliver an outstanding presentation on the topic using this Trend 1 Rise In Adoption Of Advanced Analytics Tools Complete Guide To Business Analytics Data Analytics SS. Dispense information and present a thorough explanation of Rise In Adoption, Advanced Analytics Tools, Market Size, Data Mining, Neural Networks using the slides given. This template can be altered and personalized to fit your needs. It is also available for immediate download. So grab it now.
-
 Trend 2 Rise In Demand For Erp Software Integration Complete Guide To Business Analytics Data Analytics SS
This slide highlights increasing trend of integrating ERP software with other business systems which helps in real time data processing. It provides information regarding market size, streamlining processes, process digitalization, growth rate etc. Deliver an outstanding presentation on the topic using this Trend 2 Rise In Demand For Erp Software Integration Complete Guide To Business Analytics Data Analytics SS. Dispense information and present a thorough explanation of Rise In Demand, Software Integration, Streamlining Processes, Process Digitalization, Growth Rate using the slides given. This template can be altered and personalized to fit your needs. It is also available for immediate download. So grab it now.
-
 Trend 3 Increase In Demand For Cloud Based Complete Guide To Business Analytics Data Analytics SS
This slide showcases rise in usage of cloud based analytics in business which helps in effective data migration and workload management. It provides information regarding market value, expected growth, cloud computing, data enhancement, multi cloud environment, data quality management etc. Present the topic in a bit more detail with this Trend 3 Increase In Demand For Cloud Based Complete Guide To Business Analytics Data Analytics SS. Use it as a tool for discussion and navigation on Increase In Demand, Cloud Based Analytics, Data Enhancement, Multi Cloud Environment. This template is free to edit as deemed fit for your organization. Therefore download it now.
-
 Why Insurance Businesses Require Data Analytics Navigating The Future Of Insurance Data Analytics SS
This slide provides a graph highlighting adoption of data analytics by insurers with the aim of streamlining operations along with key insights and potential impact. Present the topic in a bit more detail with this Why Insurance Businesses Require Data Analytics Navigating The Future Of Insurance Data Analytics SS. Use it as a tool for discussion and navigation on Claims Processing Time, Mainstream Adoption Stage, Data Analytics. This template is free to edit as deemed fit for your organization. Therefore download it now.
-
 Analyzing Business Reach On Various Social Leveraging Digital Analytics To Develop Data Analytics SS
This slide showcases assessment of business reach on Facebook and Instagram channels which helps in tracking customer engagement and brand awareness. It provides information regarding profit visits, reach, lack of connection, marketing campaign, active users etc. Present the topic in a bit more detail with this Analyzing Business Reach On Various Social Leveraging Digital Analytics To Develop Data Analytics SS. Use it as a tool for discussion and navigation on Instagram Profile Visits, Page And Profile Visits, Instagram Reach. This template is free to edit as deemed fit for your organization. Therefore download it now.
-
 Analyzing Customer Bounce Rate For Business Leveraging Digital Analytics To Develop Data Analytics SS
This slide showcases dashboard used to track visitor bounce rate on website which helps in identifying non profitable traffic sources. It provides information regarding KPI metrics such as channels, sessions, new users, bounce rate, pageviews, average session duration etc. Present the topic in a bit more detail with this Analyzing Customer Bounce Rate For Business Leveraging Digital Analytics To Develop Data Analytics SS. Use it as a tool for discussion and navigation on Analyzing Customer Bounce Rate, Business Website. This template is free to edit as deemed fit for your organization. Therefore download it now.
-
 Impact Of Driving Business Insights Using Leveraging Digital Analytics To Develop Data Analytics SS
This slide showcases benefits of informed decision making using digital analytics tools which helps in enhancing business performance. It provides information regarding marketing ROI, customer retention, conversion rates, data security and engagement rates and key takeaways. Present the topic in a bit more detail with this Impact Of Driving Business Insights Using Leveraging Digital Analytics To Develop Data Analytics SS. Use it as a tool for discussion and navigation on Pre Implementation, Post Implementation, Data Security, Engagement Rates. This template is free to edit as deemed fit for your organization. Therefore download it now.
-
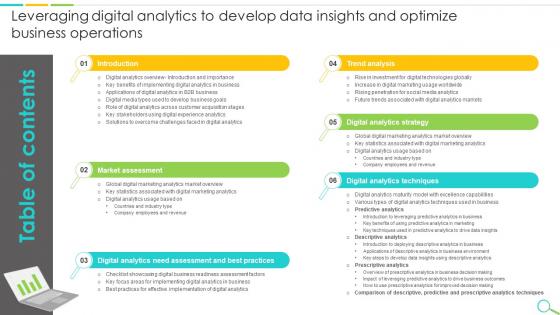 Table Of Contents Leveraging Digital Analytics To Develop Data Insights And Optimize Business Operations
Increase audience engagement and knowledge by dispensing information using Table Of Contents Leveraging Digital Analytics To Develop Data Insights And Optimize Business Operations. This template helps you present information on six stages. You can also present information on Market Assessment, Digital Analytics Strategy, Trend Analysis, Digital Analytics Techniques using this PPT design. This layout is completely editable so personaize it now to meet your audiences expectations.
-
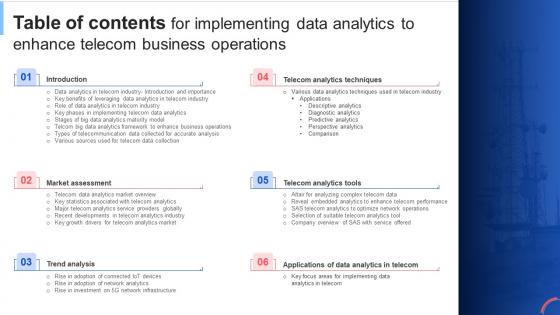 Table Of Contents For Implementing Data Analytics To Enhance Telecom Business Operations Data Analytics SS
Increase audience engagement and knowledge by dispensing information using Table Of Contents For Implementing Data Analytics To Enhance Telecom Business Operations Data Analytics SS. This template helps you present information on six stages. You can also present information on Telecom Analytics Techniques, Telecom Analytics Tools, Applications Of Data Analytics In Telecom using this PPT design. This layout is completely editable so personaize it now to meet your audiences expectations.
-
 Advanced Data Analytics Checklist For Improving Business Research
This slide highlights the important checklist points to be considered during the advanced data analytics process. The purpose of this template is to help the researcher determine the preparedness of the data set and research team before conducting analysis. It includes evaluation of certain points such as identification of project goal, qualities of the data set, and models to be used.Introducing our Advanced Data Analytics Checklist For Improving Business Research set of slides. The topics discussed in these slides are Business Understanding, Data Understanding, Data Modeling . This is an immediately available PowerPoint presentation that can be conveniently customized. Download it and convince your audience.
-
 Advanced Data Analytics Kpis To Measure Business Growth
This slide highlights the major advanced data analytics KPIs to measure business growth. The purpose of this template is to determine the efficiency of the data analytics team and help improve deficiencies through the adoption of appropriate strategies.Introducing our Advanced Data Analytics Kpis To Measure Business Growth set of slides. The topics discussed in these slides are Improvement Methods, Generated Month, Result Generation. This is an immediately available PowerPoint presentation that can be conveniently customized. Download it and convince your audience.
-
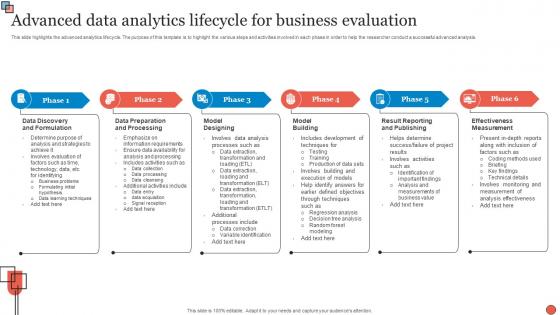 Advanced Data Analytics Lifecycle For Business Evaluation
This slide highlights the advanced analytics lifecycle. The purpose of this template is to highlight the various steps and activities involved in each phase in order to help the researcher conduct a successful advanced analysis.Presenting our well structured Advanced Data Analytics Lifecycle For Business Evaluation. The topics discussed in this slide are Result Reporting, Data Preparation, Data Discovery. This is an instantly available PowerPoint presentation that can be edited conveniently. Download it right away and captivate your audience.
-
 Benefits Of Advanced Data Analytics For Business Growth
This slide highlights the various advantages of integrating advanced data analytics into routine business activities. The purpose of this template is to help business management effectively reduce costs, improve preparedness and facilitate business growth through data analysis.Presenting our well structured Benefits Of Advanced Data Analytics For Business Growth. The topics discussed in this slide are Improved Decision Making, Reduced Business, Increased Business. This is an instantly available PowerPoint presentation that can be edited conveniently. Download it right away and captivate your audience.
-
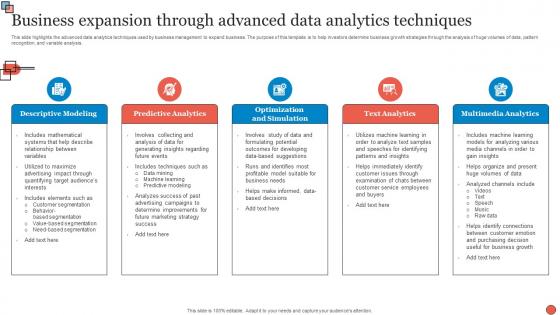 Business Expansion Through Advanced Data Analytics Techniques
This slide highlights the advanced data analytics techniques used by business management to expand business. The purpose of this template is to help investors determine business growth strategies through the analysis of huge volumes of data, pattern recognition, and variable analysis.Introducing our premium set of slides with Business Expansion Through Advanced Data Analytics Techniques. Ellicudate the three stages and present information using this PPT slide. This is a completely adaptable PowerPoint template design that can be used to interpret topics like Descriptive Modeling, Predictive Analytics, Optimization Simulation. So download instantly and tailor it with your information.
-
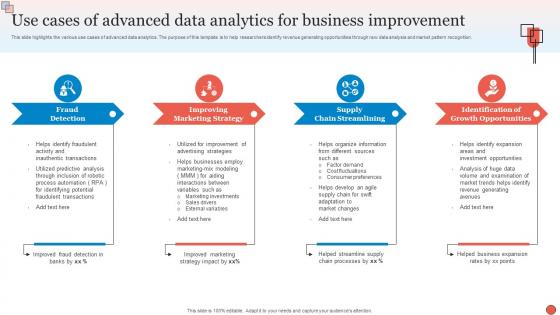 Use Cases Of Advanced Data Analytics For Business Improvement
This slide highlights the various use cases of advanced data analytics. The purpose of this template is to help researchers identify revenue generating opportunities through raw data analysis and market pattern recognition.Presenting our set of slides with Use Cases Of Advanced Data Analytics For Business Improvement. This exhibits information on four stages of the process. This is an easy to edit and innovatively designed PowerPoint template. So download immediately and highlight information on Fraud Detection, Marketing Strategy, Chain Streamlining.
-
 Data Analytics Big Data Business Intelligence Illustration
This colourful PowerPoint icon on Data Analytics is perfect for presentations, reports, and other documents. It features a vibrant blue, green and yellow colour palette and a high-quality design that will bring life to any project. Its the perfect way to illustrate data-driven insights and analytics in a visually appealing way.


