Powerpoint Templates and Google slides for Bar graph
Save Your Time and attract your audience with our fully editable PPT Templates and Slides.
-
 Overlap bar graph of team performance for fy 2019
Presenting this set of slides with name - Overlap Bar Graph Of Team Performance For Fy 2019. This is a two stage process. The stages in this process are Overlap, Business, Management.
-
 Bar graph showing company quarterly increasing trend in revenue
Presenting this set of slides with name Bar Graph Showing Company Quarterly Increasing Trend In Revenue. The topics discussed in these slides are Revenue Trend, Finance, Chart And Graph. This is a completely editable PowerPoint presentation and is available for immediate download. Download now and impress your audience.
-
 Bar graph showing company quarterly revenue trend projection
Presenting this set of slides with name Bar Graph Showing Company Quarterly Revenue Trend Projection. The topics discussed in these slides are Revenue Trend, Finance, Chart And Graph. This is a completely editable PowerPoint presentation and is available for immediate download. Download now and impress your audience.
-
 Customer adoption model with bar graph
Presenting this set of slides with name - Customer Adoption Model With Bar Graph. This is a three stages process. The stages in this process are Customer Adoption, Customer Service, Customer Success.
-
 Graphical histogram bar graph ppt powerpoint presentation inspiration pictures cpb
Presenting our Graphical Histogram Bar Graph Ppt Powerpoint Presentation Inspiration Pictures Cpb PowerPoint template design. This PowerPoint slide showcases four stages. It is useful to share insightful information on Graphical Histogram Bar Graph This PPT slide can be easily accessed in standard screen and widescreen aspect ratios. It is also available in various formats like PDF, PNG, and JPG. Not only this, the PowerPoint slideshow is completely editable and you can effortlessly modify the font size, font type, and shapes according to your wish. Our PPT layout is compatible with Google Slides as well, so download and edit it as per your knowledge.
-
 Statistics icon of data analytics using bar graph
Presenting our set of slides with Statistics Icon Of Data Analytics Using Bar Graph. This exhibits information on four stages of the process. This is an easy-to-edit and innovatively designed PowerPoint template. So download immediately and highlight information on Statistics Icon Of Data Analytics Using Bar Graph.
-
 Employee Performance Improvement Plan Icon With Bar Graph
Introducing our premium set of slides with Employee Performance Improvement Plan Icon With Bar Graph. Ellicudate the three stages and present information using this PPT slide. This is a completely adaptable PowerPoint template design that can be used to interpret topics like Employee Performance Improvement Plan Icon With Bar Graph. So download instantly and tailor it with your information.
-
 Digital Transformation Icon with Bar Graph
Presenting our set of slides with Digital Transformation Icon with Bar Graph. This exhibits information on thrree stages of the process. This is an easy to edit and innovatively designed PowerPoint template. So download immediately and highlight information on Digital Transformation Icon With Bar Graph.
-
 Left skewed distribution bar graph ppt powerpoint presentation pictures layout ideas cpb
Presenting our Left Skewed Distribution Bar Graph Ppt Powerpoint Presentation Pictures Layout Ideas Cpb PowerPoint template design. This PowerPoint slide showcases four stages. It is useful to share insightful information on Left Skewed Distribution Bar Graph This PPT slide can be easily accessed in standard screen and widescreen aspect ratios. It is also available in various formats like PDF, PNG, and JPG. Not only this, the PowerPoint slideshow is completely editable and you can effortlessly modify the font size, font type, and shapes according to your wish. Our PPT layout is compatible with Google Slides as well, so download and edit it as per your knowledge.
-
 Organizational Performance Dashboard Icon With Bar Graph
Introducing our Organizational Performance Dashboard Icon With Bar Graph set of slides. The topics discussed in these slides are Organizational Performance Dashboard Icon With Bar Graph. This is an immediately available PowerPoint presentation that can be conveniently customized. Download it and convince your audience.
-
 Icon Depicting Energy Consumption Bar Graph
Introducing our premium set of slides with Icon Depicting Energy Consumption Bar Graph. Elucidate the three stages and present information using this PPT slide. This is a completely adaptable PowerPoint template design that can be used to interpret topics like Icon Depicting, Energy Consumption, Bar Graph. So download instantly and tailor it with your information.
-
 Forecasted Budget Bar Graph Colored Icon In Powerpoint Pptx Png And Editable Eps Format
Give your next presentation a sophisticated, yet modern look with this 100 percent editable Forecasted budget bar graph colored icon in powerpoint pptx png and editable eps format. Choose from a variety of customizable formats such as PPTx, png, eps. You can use these icons for your presentations, banners, templates, One-pagers that suit your business needs.
-
 Forecasted Budget Bar Graph Monotone Icon In Powerpoint Pptx Png And Editable Eps Format
Make your presentation profoundly eye-catching leveraging our easily customizable Forecasted budget bar graph monotone icon in powerpoint pptx png and editable eps format. It is designed to draw the attention of your audience. Available in all editable formats, including PPTx, png, and eps, you can tweak it to deliver your message with ease.
-
 Employee Quarter Wise Performance Analysis Bar Graph Icon
Presenting our set of slides with Employee Quarter Wise Performance Analysis Bar Graph Icon. This exhibits information on three stages of the process. This is an easy to edit and innovatively designed PowerPoint template. So download immediately and highlight information on Employee, Quarter Wise Performance, Analysis Bar Graph.
-
 Quarterly Sales Revenue Generation Bar Graph Icon
Introducing our premium set of slides with Quarterly Sales Revenue Generation Bar Graph Icon. Ellicudate the four stages and present information using this PPT slide. This is a completely adaptable PowerPoint template design that can be used to interpret topics like Quarterly Sales, Revenue Generation, Bar Graph. So download instantly and tailor it with your information.
-
 Bar Graph Data Colored Icon In Powerpoint Pptx Png And Editable Eps Format
Give your next presentation a sophisticated, yet modern look with this 100 percent editable Bar graph data colored icon in powerpoint pptx png and editable eps format. Choose from a variety of customizable formats such as PPTx, png, eps. You can use these icons for your presentations, banners, templates, One-pagers that suit your business needs.
-
 Bar Graph Data Monotone Icon In Powerpoint Pptx Png And Editable Eps Format
Make your presentation profoundly eye-catching leveraging our easily customizable Bar graph data monotone icon in powerpoint pptx png and editable eps format. It is designed to draw the attention of your audience. Available in all editable formats, including PPTx, png, and eps, you can tweak it to deliver your message with ease.
-
 Bar Graph Icon Showcasing Product Revenue Breakdown
Presenting our set of slides with Bar Graph Icon Showcasing Product Revenue Breakdown. This exhibits information on three stages of the process. This is an easy to edit and innovatively designed PowerPoint template. So download immediately and highlight information on Bar Graph Icon, Product Revenue Breakdown.
-
 Bar Graph Social Media Advertising To Enhance Brand Awareness
Present the topic in a bit more detail with this Bar Graph Social Media Advertising To Enhance Brand Awareness. Use it as a tool for discussion and navigation on Bar Graph. This template is free to edit as deemed fit for your organization. Therefore download it now.
-
 Competitors Analysis Bar Graph Colored Icon In Powerpoint Pptx Png And Editable Eps Format
Give your next presentation a sophisticated, yet modern look with this 100 percent editable Competitors analysis bar graph colored icon in powerpoint pptx png and editable eps format. Choose from a variety of customizable formats such as PPTx, png, eps. You can use these icons for your presentations, banners, templates, One-pagers that suit your business needs.
-
 Competitors Analysis Bar Graph Monotone Icon In Powerpoint Pptx Png And Editable Eps Format
Make your presentation profoundly eye-catching leveraging our easily customizable Competitors analysis bar graph monotone icon in powerpoint pptx png and editable eps format. It is designed to draw the attention of your audience. Available in all editable formats, including PPTx, png, and eps, you can tweak it to deliver your message with ease.
-
 QMS Bar Graph Ppt Infographic Template Themes
Present the topic in a bit more detail with this QMS Bar Graph Ppt Infographic Template Themes. Use it as a tool for discussion and navigation on Bar Graph. This template is free to edit as deemed fit for your organization. Therefore download it now.
-
 2 Year Digital Transformation Map Icon With Bar Graph
Introducing our premium set of slides with 2 Year Digital Transformation Map Icon With Bar Graph. Ellicudate the four stages and present information using this PPT slide. This is a completely adaptable PowerPoint template design that can be used to interpret topics like Digital Transformation, Bar Graph. So download instantly and tailor it with your information.
-
 Sales Data Bar Graph And Analytics Icon
Presenting our set of slides with Sales Data Bar Graph And Analytics Icon. This exhibits information on three stages of the process. This is an easy to edit and innovatively designed PowerPoint template. So download immediately and highlight information on Sales Data Bar Graph, Analytics Icon.
-
 Bar Graph Colored Icon In Powerpoint Pptx Png And Editable Eps Format
Give your next presentation a sophisticated, yet modern look with this 100 percent editable Bar graph colored icon in powerpoint pptx png and editable eps format. Choose from a variety of customizable formats such as PPTx, png, eps. You can use these icons for your presentations, banners, templates, One-pagers that suit your business needs.
-
 Bar Graph Monotone Icon In Powerpoint Pptx Png And Editable Eps Format
Make your presentation profoundly eye-catching leveraging our easily customizable Bar graph monotone icon in powerpoint pptx png and editable eps format. It is designed to draw the attention of your audience. Available in all editable formats, including PPTx, png, and eps, you can tweak it to deliver your message with ease.
-
 Bar Graph Analysis Colored Icon In Powerpoint Pptx Png And Editable Eps Format
Give your next presentation a sophisticated, yet modern look with this 100 percent editable Bar graph analysis colored icon in powerpoint pptx png and editable eps format. Choose from a variety of customizable formats such as PPTx, png, eps. You can use these icons for your presentations, banners, templates, One-pagers that suit your business needs.
-
 Bar Graph Analysis Monotone Icon In Powerpoint Pptx Png And Editable Eps Format
Make your presentation profoundly eye-catching leveraging our easily customizable Bar graph analysis monotone icon in powerpoint pptx png and editable eps format. It is designed to draw the attention of your audience. Available in all editable formats, including PPTx, png, and eps, you can tweak it to deliver your message with ease.
-
 Bar Graph Chart Data Colored Icon In Powerpoint Pptx Png And Editable Eps Format
Give your next presentation a sophisticated, yet modern look with this 100 percent editable Bar graph chart data colored icon in powerpoint pptx png and editable eps format. Choose from a variety of customizable formats such as PPTx, png, eps. You can use these icons for your presentations, banners, templates, One-pagers that suit your business needs.
-
 Bar Graph Chart Data Monotone Icon In Powerpoint Pptx Png And Editable Eps Format
Make your presentation profoundly eye-catching leveraging our easily customizable Bar graph chart data monotone icon in powerpoint pptx png and editable eps format. It is designed to draw the attention of your audience. Available in all editable formats, including PPTx, png, and eps, you can tweak it to deliver your message with ease.
-
 Safe mobile banking gowth bar graph global process flow financial growth time ppt icons graphics
Presenting safe mobile banking gowth bar graph global process flow financial growth time ppt icons graphics. This Power Point icon template has been crafted with graphic of four finance icons. This icon template contains the concept of safe mobile banking and financial growth representation. Use this icon template diagram for finance and business related presentations.
-
 Sh two staged boxes with globe and bar graph powerpoint template
Presenting sh two staged boxes with globe and bar graph powerpoint template. This Power Point template diagram has been crafted with graphic of two staged boxes, globe and bar graph. This PPT diagram contains the concept of business process flow and result analysis representations. Use this PPT diagram for marketing and business related presentations.
-
 Bar graph gears percentage value ppt icons graphics
We are proud to present our bar graph gears percentage value ppt icons graphics. Concept of result analysis has been displayed in this PPT icon diagram. This icon template diagram contains the graphic of bar graph ,gears and percentage value. Use this icon template for business and finance related presentations.
-
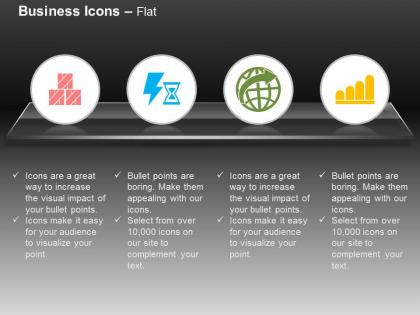 Boxes power globe metal cage bar graph ppt icons graphics
We are proud to present our boxes power globe metal cage bar graph ppt icons graphics. This power point template diagram has been crafted with graphic of four icons .These icons are used to show the concept of result analysis and global management. Use this PPT diagram for business and marketing related presentations.
-
 Business bar graph balance scale building ppt icons graphics
Presenting business bar graph balance scale building ppt icons graphics. This Power Point template diagram slide has been crafted with graphic of business icons . This PPT diagram contains the concept of result analysis and balance representation. Use this PPT diagram for business and finance related presentations.
-
 Checklist growth bar graph business records time management ppt icons graphics
Consistent and excelled PPT template theme perfect for professionals from diverse Companies, Alluring high quality Presentation graphics to the audiences, Manually alterable color, font, PowerPoint Image etc. Easily removable water mark, fully factual with plenty of room to recover the already provided dummy statistics, Steep natured PowerPoint graphics, Innovative and inventive PPT slide designs for use, easy downloading.
-
 Bar graph for analysis growth arrow lock pencil ppt icons graphics
Presenting bar graph for analysis growth arrow lock pencil ppt icons graphics. This Power Point template diagram has been crafted with graphic of bank and finance, bar graph and arrow icons. This PPT icon diagram contains the concept of business result analysis and growth representation. Use this PPT icon diagram for finance and business related presentations.
-
 Bar graph with percentage and icons powerpoint slides
Completely compatible PPT slides with Google slides. Choice to display presentation templates in standard and widescreen view. Fully editable PowerPoint slideshow. Instant download and share when required. Simple to convert into JPEG and PDF document. Useful for Finance professionals, students, professors, accountants.
-
 Bar graph for financial distribution with year based analysis powerpoint slides
Amendable PowerPoint presentation backgrounds. Technology and action oriented diagrams. Clearly describes the business and finance related information without creating any doubts. Performs remarkably and wraps up the entire presentation on time. Enhances the image of the organisation with their impressive layout. Offers orientation and ungrouping the objects. Can be conveniently modified without any specific training.
-
 Bar graph with percentage for financial analysis powerpoint slides
Presenting bar graph with percentage for financial analysis powerpoint slides. This Power Point template slide has been crafted with graphic of bar graph and percentage icons. This PPT slide contains the concept of financial analysis. Use this PPT slide for business and finance related presentations.
-
 Bar graph with business steps and icons powerpoint slides
Presenting bar graph with business steps and icons powerpoint slides. This is a bar graph with business steps and icons powerpoint slides. This is a three stage process. The stages in this process are financials.
-
 Bar graph with percentage values and team powerpoint slides
Presenting bar graph with percentage values and team powerpoint slides. This is a bar graph with percentage values and team powerpoint slides. This is a six stage process. The stages in this process are financials.
-
 Bar graph to showcase financial analysis powerpoint ideas
Presenting bar graph to showcase financial analysis powerpoint ideas. This is a bar graph to showcase financial analysis powerpoint ideas. This is a four stage process. The stages in this process are arrow, financial, analysis, marketing, strategy, business.
-
 Bar graph for sales revenue over the years
Presenting bar graph for sales revenue over the years. This is a bar graph for sales revenue over the years. This is a nine stage process. The stages in this process are business, marketing, growth, bar, years.
-
 Sales growth bar graph powerpoint templates
Presenting sales growth bar graph powerpoint templates. This is a sales growth bar graph powerpoint templates. This is a five stage process. The stages in this process are growth, business, marketing, arrows, management.
-
 Bar graph to highlight financial growth good ppt example
Presenting bar graph to highlight financial growth good ppt example. This is a bar graph to highlight financial growth good ppt example. This is a five stage process. The stages in this process are business, bar graph, finance, marketing, growth, strategy, success.
-
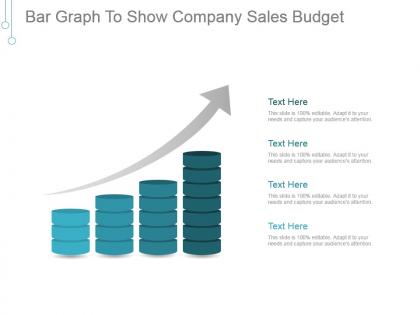 Bar graph to show company sales budget example of ppt
Presenting bar graph to show company sales budget example of ppt. This is a bar graph to show company sales budget example of ppt. This is a four stage process. The stages in this process are business, arrows, growth, marketing, success.
-
 Bar graph for rate of employee turnover example of ppt presentation
Presenting bar graph for rate of employee turnover example of ppt presentation. This is a bar graph for rate of employee turnover example of ppt presentation. This is a five stage process. The stages in this process are rate of turnover, voluntary, total.
-
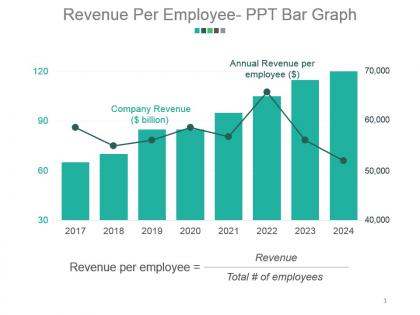 Revenue per employee ppt bar graph powerpoint slide background image
Presenting revenue per employee ppt bar graph powerpoint slide background image. This is a revenue per employee ppt bar graph powerpoint slide background image. This is a eight stage process. The stages in this process are annual revenue per employee, company revenue, revenue per employee, revenue, total number of employees.
-
 Workforce diversity by region clustered bar graph powerpoint slide design templates
Presenting workforce diversity by region clustered bar graph powerpoint slide design templates. This is a workforce diversity by region clustered bar graph powerpoint slide design templates. This is a four stage process. The stages in this process are employees headcount, new employees hire, employees left job.
-
 Bar graph for showing continuous success example of ppt
Presenting bar graph for showing continuous success example of ppt. This is a bar graph for showing continuous success example of ppt. This is a five stage process. The stages in this process are growth, business, arrow, marketing, success.
-
 Bar graph with arrow for career planning ppt summary
Presenting bar graph with arrow for career planning ppt summary. This is a bar graph with arrow for career planning ppt summary. This is a six stage process. The stages in this process are business, finance, marketing, strategy, planning, success, arrow.
-
 Market growth and development bar graph ppt images
Presenting market growth and development bar graph ppt images. This is a market growth and development bar graph ppt images. This is a four stage process. The stages in this process are category, series.
-
 Team target and achievements bar graphs ppt slides
Presenting team target and achievements bar graphs ppt slides. This is a team target and achievements bar graphs ppt slides. This is a six stage process. The stages in this process are jan, feb, mar, apr, may, june, target, achievement.
-
 Absenteeism rate by days data driven bar graph powerpoint show
Presenting absenteeism rate by days data driven bar graph powerpoint show. This is a absenteeism rate by days data driven bar graph powerpoint show. This is a two stage process. The stages in this process are absenteeism rate by days, days lost per employee per annum, monday, tuesday, wednesday, thursday, friday, saturday.
-
 Age group diversity clustered bar graph
Presenting age group diversity clustered bar graph. This is a age group diversity clustered bar graph. This is a three stage process. The stages in this process are by age group, 1500 23 percent of total workforce male 33 percent female 62 percent, 2524 54 percent of total workforce male 40 percent female 60 percent, 2524 54 percent of total workforce male 40 percent female 60 percent, 955 30 percent of total workforce male 55 percent female 45 percent, male employee headcount total and percent, female employee headcount total and percent, new employee hires total and rate, employee who left employment total and rate.
-
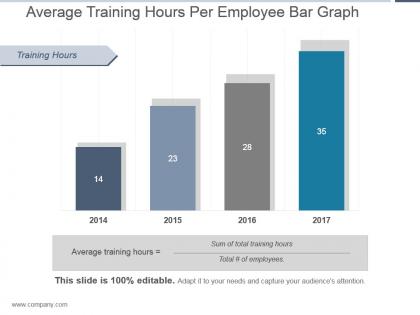 Average training hours per employee bar graph ppt design
Presenting average training hours per employee bar graph ppt design. This is a average training hours per employee bar graph ppt design. This is a four stage process. The stages in this process are training hours, average training hours, sum of total training hours, total of employees.
-
 Staff qualification level bar graph presentation powerpoint
Presenting staff qualification level bar graph presentation powerpoint. This is a staff qualification level bar graph presentation powerpoint. This is a five stage process. The stages in this process are qualification, below bachelor degree, post graduate diploma, bachelor degree, masters degree, doctorate.
-
 Bar graph to show company sales growth powerpoint slide themes
Presenting bar graph to show company sales growth powerpoint slide themes. This is a bar graph to show company sales growth powerpoint slide themes. This is a eight stage process. The stages in this process are business, marketing, bar graph, growth, management.
-
 Quality assurance growth bar graph ppt slides
Presenting quality assurance growth bar graph ppt slides. This is a quality assurance growth bar graph ppt slides. This is a five stage process. The stages in this process are graph, bar chart, chart, business, marketing.


