Powerpoint Templates and Google slides for Bar graph
Save Your Time and attract your audience with our fully editable PPT Templates and Slides.
-
 Progress Icon Circle Arrow Bar Graph Dollar Sign Graph Gear
It covers all the important concepts and has relevant templates which cater to your business needs. This complete deck has PPT slides on Progress Icon Circle Arrow Bar Graph Dollar Sign Graph Gear with well suited graphics and subject driven content. This deck consists of total of ninteen slides. All templates are completely editable for your convenience. You can change the colour, text and font size of these slides. You can add or delete the content as per your requirement. Get access to this professionally designed complete deck presentation by clicking the download button below.
-
 Quarter Bar Graph Powerpoint PPT Template Bundles
If you require a professional template with great design, then this Quarter Bar Graph Powerpoint PPT Template Bundles is an ideal fit for you. Deploy it to enthrall your audience and increase your presentation threshold with the right graphics, images, and structure. Portray your ideas and vision using twelve slides included in this complete deck. This template is suitable for expert discussion meetings presenting your views on the topic. With a variety of slides having the same thematic representation, this template can be regarded as a complete package. It employs some of the best design practices, so everything is well-structured. Not only this, it responds to all your needs and requirements by quickly adapting itself to the changes you make. This PPT slideshow is available for immediate download in PNG, JPG, and PDF formats, further enhancing its usability. Grab it by clicking the download button.
-
 Bar Graph Segmentation Powerpoint PPT Template Bundles
If you require a professional template with great design, then this Bar Graph Segmentation Powerpoint PPT Template Bundles is an ideal fit for you. Deploy it to enthrall your audience and increase your presentation threshold with the right graphics, images, and structure. Portray your ideas and vision using twelve slides included in this complete deck. This template is suitable for expert discussion meetings presenting your views on the topic. With a variety of slides having the same thematic representation, this template can be regarded as a complete package. It employs some of the best design practices, so everything is well-structured. Not only this, it responds to all your needs and requirements by quickly adapting itself to the changes you make. This PPT slideshow is available for immediate download in PNG, JPG, and PDF formats, further enhancing its usability. Grab it by clicking the download button.
-
 Twelve staged lego blocks bar graph and business icons powerpoint template slide
We are proud to present our twelve staged lego blocks bar graph and business icons powerpoint template slide. Twelve staged Lego blocks bar graph and business icons has been used to craft this power point template diagram. This PPT diagram contains the concept of business result analysis techniques .Use this PPT diagram for business and marketing related presentations.
-
 Md eleven staged bar graph with icons business analysis powerpoint template slide
Presenting md eleven staged bar graph with icons business analysis powerpoint template slide. Eleven staged bar graph and icons has been used to craft this power point template diagram. This PPT diagram contains the concept of business result analysis. Use this PPT diagram for marketing and business related presentation.
-
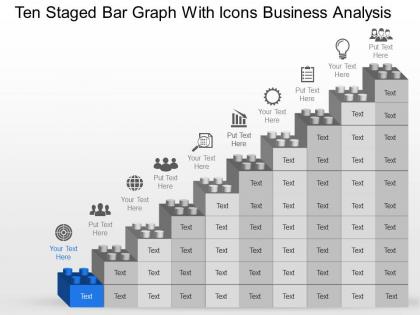 Ng ten staged bar graph with icons business analysis powerpoint template slide
Presenting ng ten staged bar graph with icons business analysis powerpoint template slide. Ten staged bar graph and icons has been used to craft this power point template diagram. This PPT diagram contains the concept of business result analysis. Use this PPT diagram for marketing and business related presentation.
-
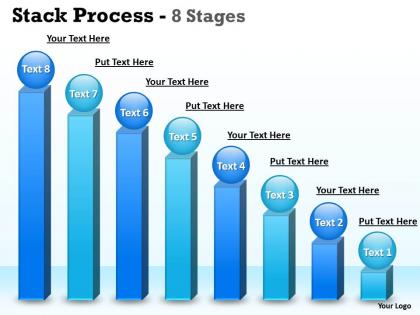 Eight stages stack diagram business bar graph
This template is skillfully designed and is completely editable to suit all the needs and requirements of the user. The color of the font, its size, style, and all other elements can be customized according to the user's desire The text in the PPT placeholder can be replaced with the desired information making this template highly flexible and adaptable as well. This template is also compatible with various Microsoft versions and formats like Google Slides, JPG, PDF, etc so the user will face no issue in saving it in the format of his choice.
-
 Mu nine staged bar graph with icons business analysis powerpoint template slide
Presenting mu nine staged bar graph with icons business analysis powerpoint template slide. Nine staged bar graph and icons has been used to craft this power point template diagram. This PPT diagram contains the concept of business progress analysis. Use this PPT diagram for sales and business related presentation.
-
 Horizontal bar graph powerpoint ppt template bundles
If you require a professional template with great design, then this Horizontal Bar Graph Powerpoint Ppt Template Bundles is an ideal fit for you. Deploy it to enthrall your audience and increase your presentation threshold with the right graphics, images, and structure. Portray your ideas and vision using twelve slides included in this complete deck. This template is suitable for expert discussion meetings presenting your views on the topic. With a variety of slides having the same thematic representation, this template can be regarded as a complete package. It employs some of the best design practices, so everything is well-structured. Not only this, it responds to all your needs and requirements by quickly adapting itself to the changes you make. This PPT slideshow is available for immediate download in PNG, JPG, and PDF formats, further enhancing its usability. Grab it by clicking the download button.
-
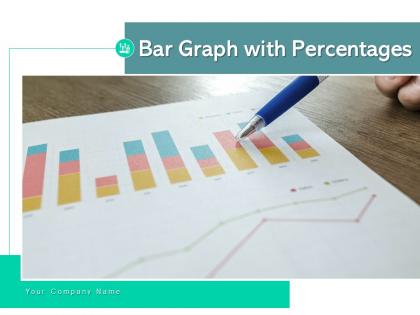 Bar graph with percentages budget allocation representing annual variance weekly product
Deliver a credible and compelling presentation by deploying this Bar Graph With Percentages Budget Allocation Representing Annual Variance Weekly Product. Intensify your message with the right graphics, images, icons, etc. presented in this complete deck. This PPT template is a great starting point to convey your messages and build a good collaboration. The twelve slides added to this PowerPoint slideshow helps you present a thorough explanation of the topic. You can use it to study and present various kinds of information in the form of stats, figures, data charts, and many more. This Bar Graph With Percentages Budget Allocation Representing Annual Variance Weekly Product PPT slideshow is available for use in standard and widescreen aspects ratios. So, you can use it as per your convenience. Apart from this, it can be downloaded in PNG, JPG, and PDF formats, all completely editable and modifiable. The most profound feature of this PPT design is that it is fully compatible with Google Slides making it suitable for every industry and business domain.
-
 Fj eight staged circular bar graph style diagram powerpoint template
Presenting fj eight staged circular bar graph style diagram powerpoint template. Eight staged circular bar graph diagram and icons has been used to design this PPT diagram. This PPT diagram contains the concept of business result analysis. Use this PPT diagram for business and marketing related presentations.
-
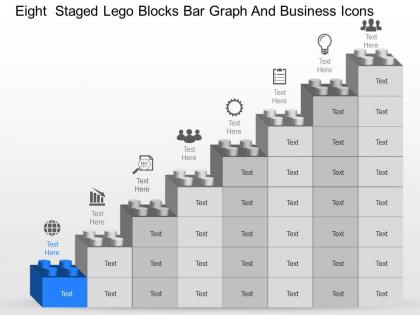 Eight staged lego blocks bar graph and business icons powerpoint template slide
We are proud to present our eight staged lego blocks bar graph and business icons powerpoint template slide. Eight staged Lego blocks and bar graph diagram has been used to craft this power point template diagram. This PPT diagram contains the concept of business result analysis. Use this PPT diagram for business and marketing related presentations.
-
 Mb eight staged bar graph with icons sales planning powerpoint template slide
Presenting mb eight staged bar graph with icons sales planning powerpoint template slide. Eight staged bar graph and icons has been used to craft this power point template diagram. This PPT diagram contains the concept of sales planning. Use this PPT diagram for sales and business related presentation.
-
 Seven staged colored infographics with news mail microscope bar graph flat powerpoint design
Extravagant PPT design patterns for providing the incredible concept realization useful for different business experts from diverse sectors, An exclusive extent of malleable PPT icons and designs , Rearrange able magnitude and intensity for the Presentation images or icons, Flexibility to customize the same into divergent configurations like PDF or JPG , unaffected high resolution Presentation graphics .
-
 Circular progress bar graphics for business customer satisfaction infographic template
Deploy our Circular Progress Bar Graphics For Business Customer Satisfaction Infographic Template to present high quality presentations. It is designed in PowerPoint and is available for immediate download in standard and widescreen sizes. Not only this, but this layout is also 100 percent editable, giving you full control over its applications.
-
 Circular progress bar graphics for marketing plans in strategic management infographic template
This is a single slide titled Circular Progress Bar Graphics For Marketing Plans In Strategic Management Infographic Template. It is crafted using high quality vector based visuals that are 100 percent editable and available for immediate download in standard and widescreen aspect ratios.
-
 Bar graph with seven steps and icons powerpoint template slide
We are proud to present our bar graph with seven steps and icons powerpoint template slide. Graphic of bar graph with seven steps and icons has been used to craft this power point template diagram. This PPT diagram contains the concept of data representation. Use this PPT diagram for business and marketing related presentations.
-
 Mw seven staged bar graph with icons powerpoint template slide
Presenting mw seven staged bar graph with icons powerpoint template slide. Seven staged bar graph and icons has been used to craft this power point template diagram. This PPT diagram contains the concept of business result analysis. Use this PPT diagram for marketing and business related presentation.
-
 Workforce assessment result icon with bar graph
Presenting our set of slides with Workforce Assessment Result Icon With Bar Graph. This exhibits information on three stages of the process. This is an easy to edit and innovatively designed PowerPoint template. So download immediately and highlight information on Workforce Assessment Result Icon With Bar Graph.
-
 Gold Bar Graph Colored Icon In Powerpoint Pptx Png And Editable Eps Format
This eye-catching gold trading PowerPoint icon is a perfect visual aid for presentations. It features a bright yellow gold bar with a green up arrow, to represent a successful gold trading venture. Use this icon to convey success and prosperity in your presentations.
-
 Gold Bar Graph Monotone Icon In Powerpoint Pptx Png And Editable Eps Format
This Monotone Powerpoint Icon on Gold Trading is a stylish and modern vector graphic that is perfect for presentations related to gold trading. It features a gold bar and coins in a black and white color scheme, giving it a professional and sleek look.
-
 Quantitative Research Icon Showcasing Bar Graph
Presenting our set of slides with Quantitative Research Icon Showcasing Bar Graph. This exhibits information on three stages of the process. This is an easy to edit and innovatively designed PowerPoint template. So download immediately and highlight information on Quantitative Research, Showcasing Bar Graph.
-
 Financial Growth Bar Graph Objective Icon
Introducing our premium set of slides with Financial Growth Bar Graph Objective Icon Ellicudate the three stages and present information using this PPT slide. This is a completely adaptable PowerPoint template design that can be used to interpret topics like Financial Growth, Bar Graph, Objective Icon So download instantly and tailor it with your information.
-
 Eu six staged bar graph and icons powerpoint template
Presenting eu six staged bar graph and icons powerpoint template. Six staged bar graph and icons has been used to craft this power point template diagram. This PPT diagram contains the concept of business result analysis representation. This PPT diagram can be used for business and marketing related presentations.
-
 Six staged bar graph with icons powerpoint template slide
We are proud to present our six staged bar graph with icons powerpoint template slide. Six staged bar graph diagram with icons has been used to craft this power point template diagram. This PPT diagram contains the concept of business result analysis. Use this PPT diagram for business and marketing related presentations.
-
 Na six staged arrow bar graph business deal idea generation powerpoint template slide
Presenting na six staged arrow bar graph business deal idea generation powerpoint template slide. Six staged arrow, bar graph and icons has been used to craft this power point template diagram. This PPT diagram contains the concept of business deal and idea generation. Use this PPT diagram for marketing and business related presentation.
-
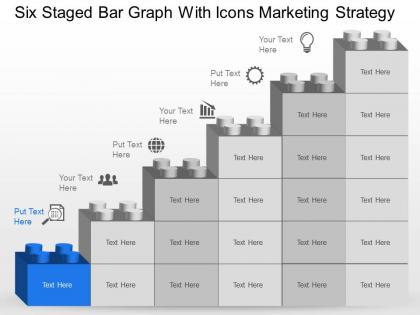 Nb six staged bar graph with icons marketing strategy powerpoint template slide
Presenting nb six staged bar graph with icons marketing strategy powerpoint template slide. Six staged bar graph and icons has been used to craft this power point template diagram. This PPT diagram contains the concept of marketing strategy. Use this PPT diagram for marketing and business related presentation.
-
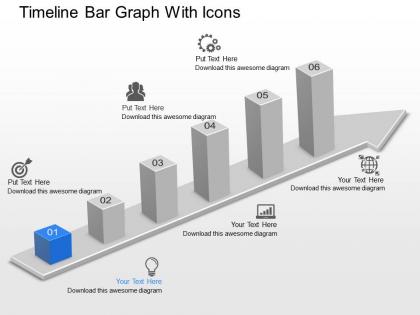 Du timeline bar graph with icons powerpoint template
Presenting du timeline bar graph with icons powerpoint template. Presenting du timeline bar graph with icons powerpoint template. Presenting du timeline bar graph with icons powerpoint template. This Power Point template diagram has been crafted with graphic of timeline and bar graph diagram. This PPT diagram contains the concept of business result analysis. Use this PPT diagram for business and marketing related presentations.
-
 Ve colored bar graph for business result analysis powerpoint template
We are proud to present our ve colored bar graph for business result analysis powerpoint template. Graphic of colored bar graph has been used to design this power point template diagram. This PPT diagram contains the concept of business result analysis representation This PPT diagram can be used for business and marketing related presentations.
-
 Ai five staged bar graph and icons powerpoint template
Presenting ai five staged bar graph and icons powerpoint template. Five staged bar graph diagram and icons has been used to craft this power point template diagram. This PPT diagram contains the concept of sales result analysis. Use this PPT diagram for business and sales related presentations.
-
 Kj five staged circular bar graph diagram powerpoint template
Presenting kj five staged circular bar graph diagram powerpoint template. Five staged circular bar graph diagram has been used to craft this Power Point template diagram. This PPT diagram contains the concept of business growth analysis representation. Use this PPT diagram for business and marketing related presentations.
-
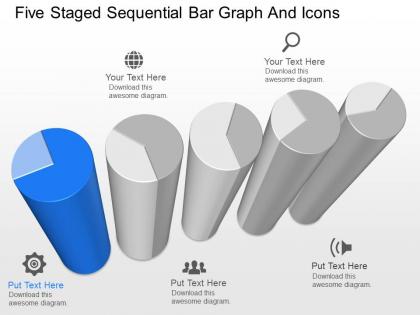 Km five staged sequential bar graph and icons powerpoint template
Presenting km five staged sequential bar graph and icons powerpoint template. Five staged sequential bar graph diagram and icons has been used to craft this Power Point template diagram. This PPT diagram contains the concept of business data representation. Use this PPT diagram for business and finance related presentations.
-
 Mh five staged bar graph with growth arrow powerpoint template slide
Presenting mh five staged bar graph with growth arrow powerpoint template slide. Five staged bar graph and growth arrow diagram has been used to craft this power point template diagram. This PPT diagram contains the concept of business growth analysis. Use this PPT diagram for marketing and business related presentation.
-
 Nu two level bar graph lego block diagram powerpoint template slide
Presenting nu two level bar graph lego block diagram powerpoint template slide. Two level Lego blocks diagram with bar graph has been used to design this power point template diagram. This PPT diagram contains the concept of business result analysis and planning. Use this PPT diagram for business and marketing related presentations.
-
 Is five staged bar graph and icons powerpoint template
Presenting is five staged bar graph and icons powerpoint template. Graphic of five staged bar graph and icons has been used to craft this power point template diagram. This PPT diagram contains concept of business result analysis representation. Use this PPT diagram for business and marketing related presentations.
-
 Iy five staged sequential bar graph for process flow powerpoint template
Presenting iy five staged sequential bar graph for process flow powerpoint template. Five staged sequential bar graph has been used to craft this power point template diagram. This PPT diagram contains the concept of business result analysis representation. Use this PPT diagram for business and marketing related presentations.
-
 Folders bar graph pie chart on puzzle square flat powerpoint design
We are proud to present our folders bar graph pie chart on puzzle square flat powerpoint design. Graphic of folders and bar graph with pie graph on square chart puzzle has been used to design this power point template diagram. This PPT diagram contains the concept of business problem solving. Use this PPT diagram for business and marketing related presentations.
-
 Dx four staged bar graph result growth analysis powerpoint template
Presenting dx four staged bar graph result growth analysis powerpoint template. Graphic of four staged bar graph has been used to craft this power point template diagram. This PPT diagram contains the concept of result and growth analysis representation. This PPT diagram can be used for business and marketing related presentations.
-
 Lp four stage book design bar graph and icons powerpoint template
Presenting lp four stage book design bar graph and icons powerpoint template. Four staged book design bar graph diagram has been used to craft this power point template diagram. This PPT diagram contains the concept of business result analysis representation. Use this PPT diagram for business and marketing related presentations.
-
 Ks four staged gear bar graph and icons powerpoint template
Presenting ks four staged gear bar graph and icons powerpoint template. Four staged gear, bar graph and icons has been used to craft this Power Point template diagram. This PPT diagram contains the concept of process control and result analysis representation. Use this PPT diagram for business and marketing related presentations.
-
 Four staged stack bar graph powerpoint template slide
We are proud to present our four staged stack bar graph powerpoint template slide. Four staged stack bar graph has been used to craft this power point template diagram. This PPT diagram contains the concept of process flow and result analysis representation. Use this PPT diagram for business and marketing related presentations.
-
 Mq four staged lego blocks bar graph with icons powerpoint template slide
Presenting mq four staged lego blocks bar graph with icons powerpoint template slide. Four staged Lego block and bar graph has been used to craft this power point template diagram. This PPT diagram contains the concept of business strategy and result analysis. Use this PPT diagram for marketing and business related presentations.
-
 Mt four steps lego blocks bar graph with icons powerpoint template slide
Presenting mt four steps lego blocks bar graph with icons powerpoint template slide. Four staged Lego block and bar graph with icons has been used to craft this power point template diagram. This PPT diagram contains the concept of business planning and result analysis. Use this PPT diagram for marketing and business related presentations.
-
 Md bar graph on mobile screen for business growth analysis powerpoint temptate
Presenting md bar graph on mobile screen for business growth analysis powerpoint temptate. This Power Point template diagram has been crafted with graphic of mobile screen and bar graph diagram. This PPT diagram contains the concept of business growth analysis representation. Use this PPT diagram for business and marketing related presentations.
-
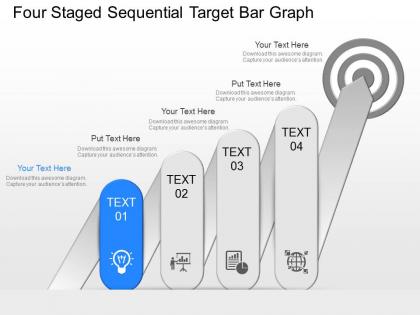 Gh four staged sequential target bar graph powerpoint template
Presenting gh four staged sequential target bar graph powerpoint template. Four staged sequential target bar graph diagram has been used to craft this Power Point template diagram. This PPT diagram contains the concept of business target selection .Use this PPT diagram for business and marketing related presentations.
-
 New teamwork bar graph for idea generation and result analysis powerpoint template
Perfect resolution of the icons and the pictures in the slides. Allow instant downloading of the slide template. Trouble-free insertion of the brand name in the background. Compatible with Microsoft Office programs and Google Slides. Offer 100% access to edit and modify the slide design. Beneficial for the Sales and Marketing professionals and the business managers.
-
 Magnifier with tools and bar graph ppt examples slides
Presenting magnifier with tools and bar graph ppt examples slides. This is a magnifier with tools and bar graph ppt examples slides. This is four stage process. The stages in this process are magnifier, icons, search, strategy, business, success.
-
 Magnifier with tools and bar graph powerpoint slide templates download
Presenting magnifier with tools and bar graph powerpoint slide templates download. Presenting magnifier with tools and bar graph powerpoint slide templates download. This is a magnifier with tools and bar graph powerpoint slide templates download. This is four stage process. The stages in this process are magnifier, icons, marketing, find, business.
-
 Magnifier with tools and bar graph powerpoint templates
Presenting magnifier with tools and bar graph powerpoint templates. Presenting magnifier with tools and bar graph powerpoint templates . This is a magnifier with tools and bar graph powerpoint templates. This is a five stage process. The stages in this process are business, management, marketing, icons, arrow, magnifier, technology.
-
 Magnifier with tools and bar graph powerpoint slide themes
Presenting magnifier with tools and bar graph powerpoint slide themes. This is a magnifier with tools and bar graph powerpoint slide themes. This is a four stage process. The stages in this process are magnifier, business, marketing, strategy, management.
-
 Bar graph depicting integrated planning across organization
Introducing our Bar Graph Depicting Integrated Planning Across Organization set of slides. The topics discussed in these slides are Bar Graph Depicting Integrated Planning Across Organization. This is an immediately available PowerPoint presentation that can be conveniently customized. Download it and convince your audience.
-
 Employee morale scorecard department wise employee morale scorecard with bar graphs
Present the topic in a bit more detail with this Employee Morale Scorecard Department Wise Employee Morale Scorecard With Bar Graphs. Use it as a tool for discussion and navigation on Finance Department, Sales Department, Target. This template is free to edit as deemed fit for your organization. Therefore download it now.
-
 Auto sales scorecard bar graph for regional performance comparison
Present the topic in a bit more detail with this Auto Sales Scorecard Bar Graph For Regional Performance Comparison. Use it as a tool for discussion and navigation on Auto Sales Scorecard Bar Graph For Regional Performance Comparison. This template is free to edit as deemed fit for your organization. Therefore download it now.
-
 Bar Graph Representing Importance Of HR Cloud Automation System
This slide shows the graphical representation of cloud automation system for human resource which includes the benefits to organization such as better employee experience, real-time data, strategic functions, less training needs, better employee insights, etc. Introducing our Bar Graph Representing Importance Of HR Cloud Automation System set of slides. The topics discussed in these slides are Better Employee Experience, Real Time Data And Dashboards, Increased HR Tech Innovation, Better Employee Insights. This is an immediately available PowerPoint presentation that can be conveniently customized. Download it and convince your audience.
-
 Sales representatives scorecard bar graph for sku performance comparison
Deliver an outstanding presentation on the topic using this Sales Representatives Scorecard Bar Graph For SKU Performance Comparison. Dispense information and present a thorough explanation of Sales Representatives Scorecard Bar Graph For SKU Performance Comparison using the slides given. This template can be altered and personalized to fit your needs. It is also available for immediate download. So grab it now.
-
 Quarterly Sales Plan With Bar Graph
This slide shows the sales plan of the two products from a same company of four quarters. It is been depicted in the form of graph. Introducing our Quarterly Sales Plan With Bar Graph set of slides. The topics discussed in these slides are Quarterly Sales Plan With Bar Graph. This is an immediately available PowerPoint presentation that can be conveniently customized. Download it and convince your audience.
-
 Bar Graph Representing Macroeconomic Employment Change By Industry
This slide focuses on the graphical presentation of macroeconomic indicator such as employment rate of different industries which includes service providing and goods producing industries which includes healthcare and social assistance, construction, manufacturing industry, etc. Introducing our Bar Graph Representing Macroeconomic Employment Change By Industry set of slides. The topics discussed in these slides are Goods Producing, Service Providing, Businesses, Growth. This is an immediately available PowerPoint presentation that can be conveniently customized. Download it and convince your audience.
-
 Technology assessment scorecard with bar graph ppt slides image
This graph or chart is linked to excel, and changes automatically based on data. Just left click on it and select Edit Data. Present the topic in a bit more detail with this Technology Assessment Scorecard With Bar Graph Ppt Slides Image. Use it as a tool for discussion and navigation on CPU Utilization, Memory Utilization, Packet Loss. This template is free to edit as deemed fit for your organization. Therefore download it now.
-
 Employee Quarterly Sales And Revenue Generation Bar Graph
This slide depicts annual sales percentage and revenue generated by employee. It provides information regarding overall employee performance for yearly appraisal process. Presenting our well structured Employee Quarterly Sales And Revenue Generation Bar Graph. The topics discussed in this slide are Employee Quarterly Sales, Revenue Generation, Bar Graph. This is an instantly available PowerPoint presentation that can be edited conveniently. Download it right away and captivate your audience.
-
 Employees Quarter Wise Head Count Bar Graph
This slide depicts number of existing and new hires in company. It provides details of total male and female employees for 4 quarters and key insights. Introducing our Employees Quarter Wise Head Count Bar Graph set of slides. The topics discussed in these slides are Employees, Quarter Wise Head Count, Bar Graph. This is an immediately available PowerPoint presentation that can be conveniently customized. Download it and convince your audience.


