Powerpoint Templates and Google slides for Average
Save Your Time and attract your audience with our fully editable PPT Templates and Slides.
-
 Staffing Planning Resourcing Dashboard With Average Selection Time
This slide shows analysis of average time company takes to hire a candidate and number of applicants that pass through at each step of hiring process to speed up the whole function. It further includes details about departments, sources, locations, job roles, rejection and decline reason, etc. Introducing our Staffing Planning Resourcing Dashboard With Average Selection Time set of slides. The topics discussed in these slides are Rejection Reason, Offer Decline Reason, By Department. This is an immediately available PowerPoint presentation that can be conveniently customized. Download it and convince your audience.
-
 Bitcoin Mining Statistics With Electricity Consumption And Average Revenue
This slide showcases statistics of bitcoin mining that can help in identifying the monthly average revenue of miners and electricity cost incurred worldwide. It also showcases electricity consumption and mining pools hash rate distribution. Presenting our well structured Bitcoin Mining Statistics With Electricity Consumption And Average Revenue. The topics discussed in this slide are Revenue Bitcoin Miners, Electricity Cost, Mining Pools Hash Rate Distribution. This is an instantly available PowerPoint presentation that can be edited conveniently. Download it right away and captivate your audience.
-
 Average Return Of Real Estate Investment Trust By Market Capitalization
The following slide displays statistics to analyze income generated by REIT to review return potential. It further includes details about micro, small, mid and large cap. Introducing our Average Return Of Real Estate Investment Trust By Market Capitalization set of slides. The topics discussed in these slides are Average Return, Real Estate Investment, Trust By Market Capitalization. This is an immediately available PowerPoint presentation that can be conveniently customized. Download it and convince your audience.
-
 Yearly Status Report For Average CES Assessment
The slide carries a summary report to assess average CES for predicting the customer behaviour and purchasing habits. Various elements included are average rating, yearly graphs and key takeaways. Introducing our Yearly Status Report For Average CES Assessment set of slides. The topics discussed in these slides are Yearly Status Report, Average CES Assessment. This is an immediately available PowerPoint presentation that can be conveniently customized. Download it and convince your audience.
-
 Assessing Average Transaction Size And Units Efficient Management Retail Store Operations
Mentioned graph illustrates informational stats about average transaction size and units per customer of the firm in 2023. Here the graphs indicates that average transaction price recorded in 2023 is doller 61 9. Present the topic in a bit more detail with this Assessing Average Transaction Size And Units Efficient Management Retail Store Operations. Use it as a tool for discussion and navigation on Average Transaction, Avg Price, Per Transaction. This template is free to edit as deemed fit for your organization. Therefore download it now.
-
 Assessing Average Transaction Size And Units Per Customer Managing Retail Business Operations
Mentioned graph illustrates informational stats about average transaction size and units per customer of the firm in 2023. Here the graphs indicates that average transaction price recorded in 2023 is doller 61.9. Present the topic in a bit more detail with this Assessing Average Transaction Size And Units Per Customer Managing Retail Business Operations. Use it as a tool for discussion and navigation on Average Transaction, Per Transaction, Per Customer. This template is free to edit as deemed fit for your organization. Therefore download it now.
-
 Determine Average Sales Cycle In Pipeline Chanel Sales Pipeline Management
This slide provides information regarding average sales cycle existing in sales pipeline. The department will consistently monitor sales cycle to ensure on time closure of deal. Present the topic in a bit more detail with this Determine Average Sales Cycle In Pipeline Chanel Sales Pipeline Management. Use it as a tool for discussion and navigation on Determine Average, Sales Cycle, Pipeline. This template is free to edit as deemed fit for your organization. Therefore download it now.
-
 Key Statistics Highlighting Average Employee Turnover Effective Employee Retention
The purpose of this slide is to graphically represent the average staff turnover rate in multiple industries. The industries covered in the slide are construction, manufacturing, transportation, information, financial, hospitality, and health services along with key observations. Deliver an outstanding presentation on the topic using this Key Statistics Highlighting Average Employee Turnover Effective Employee Retention. Dispense information and present a thorough explanation of Employee Turnover, Observations, Industries using the slides given. This template can be altered and personalized to fit your needs. It is also available for immediate download. So grab it now.
-
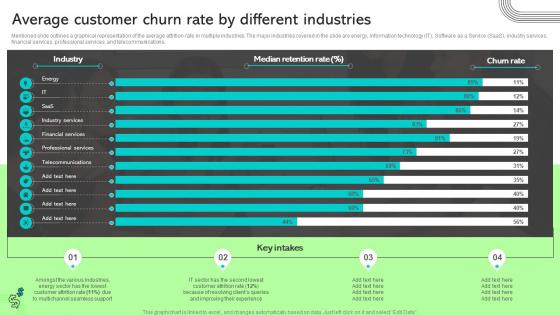 Average Customer Churn Rate By Different Industries Ways To Improve Customer Acquisition Cost
Mentioned slide outlines a graphical representation of the average attrition rate in multiple industries. The major industries covered in the slide are energy, information technology IT, Software as a Service SaaS, industry services, financial services, professional services, and telecommunications. Present the topic in a bit more detail with this Average Customer Churn Rate By Different Industries Ways To Improve Customer Acquisition Cost. Use it as a tool for discussion and navigation on Telecommunications, Professional, Financial. This template is free to edit as deemed fit for your organization. Therefore download it now.
-
 Employee Retention Strategies Key Statistics Highlighting Average Employee Turnover Rate
The purpose of this slide is to graphically represent the average staff turnover rate in multiple industries. The industries covered in the slide are construction, manufacturing, transportation, information, financial, hospitality, and health services along with key observations. Deliver an outstanding presentation on the topic using this Employee Retention Strategies Key Statistics Highlighting Average Employee Turnover Rate. Dispense information and present a thorough explanation of Observations, Employee Turnover Rate, Financial Industry using the slides given. This template can be altered and personalized to fit your needs. It is also available for immediate download. So grab it now.
-
 Key Statistics Highlighting Average Employee Turnover Rate In Staff Retention Tactics For Healthcare
Present the topic in a bit more detail with this Key Statistics Highlighting Average Employee Turnover Rate In Staff Retention Tactics For Healthcare. Use it as a tool for discussion and navigation on Companies, Salary, Survey Findings. This template is free to edit as deemed fit for your organization. Therefore download it now.
-
 Analysis Of Employee Average Tenure Succession Planning To Prepare Employees For Leadership Roles
This slide highlights current analysis of employee average tenure and attrition rate in organization. It showcases increase in attrition rate and decline in average employee tenure. Deliver an outstanding presentation on the topic using this Analysis Of Employee Average Tenure Succession Planning To Prepare Employees For Leadership Roles. Dispense information and present a thorough explanation of Analysis, Development, Opportunities using the slides given. This template can be altered and personalized to fit your needs. It is also available for immediate download. So grab it now.
-
 Key Statistics Highlighting Average Employee Turnover Ultimate Guide To Employee Retention Policy
The purpose of this slide is to graphically represent the average staff turnover rate in multiple industries. The industries covered in the slide are construction, manufacturing, transportation, information, financial, hospitality, and health services along with key observations. Deliver an outstanding presentation on the topic using this Key Statistics Highlighting Average Employee Turnover Ultimate Guide To Employee Retention Policy. Dispense information and present a thorough explanation of Industries, Employee, Statistics using the slides given. This template can be altered and personalized to fit your needs. It is also available for immediate download. So grab it now.
-
 Assessing Average Transaction Optimizing Retail Operations By Efficiently Handling Inventories
Mentioned graph illustrates informational stats about average transaction size and units per customer of the firm in 2023. Here the graphs indicates that average transaction price recorded in 2023 is dollar 61.9. Present the topic in a bit more detail with this Assessing Average Transaction Optimizing Retail Operations By Efficiently Handling Inventories. Use it as a tool for discussion and navigation on Customer, Transaction, Average. This template is free to edit as deemed fit for your organization. Therefore download it now.
-
 Key Statistics Highlighting Average Employee Turnover Employee Retention Strategies To Reduce Staffing Cost
The purpose of this slide is to graphically represent the average staff turnover rate in multiple industries. The industries covered in the slide are construction, manufacturing, transportation, information, financial, hospitality, and health services along with key observations. Present the topic in a bit more detail with this Key Statistics Highlighting Average Employee Turnover Employee Retention Strategies To Reduce Staffing Cost. Use it as a tool for discussion and navigation on Statistics, Observations, Information. This template is free to edit as deemed fit for your organization. Therefore download it now.
-
 Leadership Training And Development Average Expenditure On Leadership Development Per Person
The following slide showcases the average expenditure on per person basis for leadership development of senior managers, mid level managers, first time managers and potential future leaders. Deliver an outstanding presentation on the topic using this Leadership Training And Development Average Expenditure On Leadership Development Per Person. Dispense information and present a thorough explanation of Average Expenditure, Leadership, Development using the slides given. This template can be altered and personalized to fit your needs. It is also available for immediate download. So grab it now.
-
 Techniques To Enhance Support Impact 1 Decline In Average Response Time
This slide showcases the impact of good support service on the company. The metrics covered are average response time and first call resolution. Present the topic in a bit more detail with this Techniques To Enhance Support Impact 1 Decline In Average Response Time. Use it as a tool for discussion and navigation on Average Response, Average Response Time. This template is free to edit as deemed fit for your organization. Therefore download it now.
-
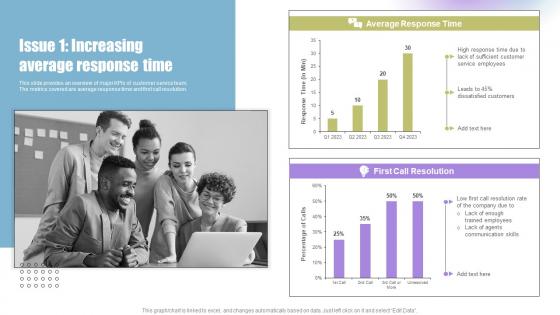 Techniques To Enhance Support Issue 1 Increasing Average Response Time
This slide provides an overview of major KPIs of customer service team. The metrics covered are average response time and first call resolution. Deliver an outstanding presentation on the topic using this Techniques To Enhance Support Issue 1 Increasing Average Response Time. Dispense information and present a thorough explanation of Average Response Time, First Call Resolution using the slides given. This template can be altered and personalized to fit your needs. It is also available for immediate download. So grab it now.
-
 Average Length Of Hospital Stay By Operation
This slide showcases the average hospital stay length by the procedure evaluating both the hospitalist management and individual hospitalist performance. It also includes various operations such as knee arthroplasty, hip arthroplasty, etc. Presenting our well structured Average Length Of Hospital Stay By Operation. The topics discussed in this slide are Patients, Amputation, Stayed. This is an instantly available PowerPoint presentation that can be edited conveniently. Download it right away and captivate your audience.
-
 Average Length Of Stay In Hospital By Patients In EU Member States
This slide showcases patients average hospital stay in EU member countries. It includes data of member countries such as sweden, ireland, denmark, cyprus, germany, etc. Introducing our Average Length Of Stay In Hospital By Patients In EU Member States set of slides. The topics discussed in these slides are Czechia, Greatest, Average. This is an immediately available PowerPoint presentation that can be conveniently customized. Download it and convince your audience.
-
 Comparison Of Average Length Of Stay In Different Years
This slide showcases an analysis of the average length of stay in different years. It also includes a decrease observed in the average length of years in the mentioned the years. Presenting our well structured Comparison Of Average Length Of Stay In Different Years. The topics discussed in this slide are According, Average, Decreased. This is an instantly available PowerPoint presentation that can be edited conveniently. Download it right away and captivate your audience.
-
 Country Wise Data Of Average Length Of Hospital Stay After Giving Birth
This slide showcases the average length of hospital stay based on the diagnosis to understand issues and enhance patient acute care management. It also includes the length of womens hospital stays in different nations. Introducing our Country Wise Data Of Average Length Of Hospital Stay After Giving Birthset of slides. The topics discussed in these slides are Women, Straightforward, Significant. This is an immediately available PowerPoint presentation that can be conveniently customized. Download it and convince your audience.
-
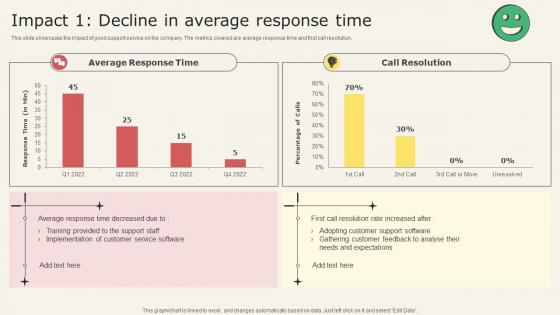 Analyzing Metrics To Improve Customer Experience Impact 1 Decline In Average Response Time
This slide showcases the impact of good support service on the company. The metrics covered are average response time and first call resolution. Present the topic in a bit more detail with this Analyzing Metrics To Improve Customer Experience Impact 1 Decline In Average Response Time. Use it as a tool for discussion and navigation on Customer Needs And Expectations, Adopting Customer, Support Software, Customer Feedback. This template is free to edit as deemed fit for your organization. Therefore download it now.
-
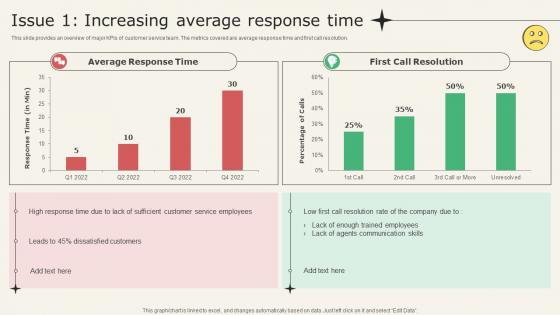 Analyzing Metrics To Improve Customer Experience Issue 1 Increasing Average Response Time
This slide provides an overview of major KPIs of customer service team. The metrics covered are average response time and first call resolution. Present the topic in a bit more detail with this Analyzing Metrics To Improve Customer Experience Issue 1 Increasing Average Response Time. Use it as a tool for discussion and navigation on Average Response Time, First Call Resolution, Communication Skills. This template is free to edit as deemed fit for your organization. Therefore download it now.
-
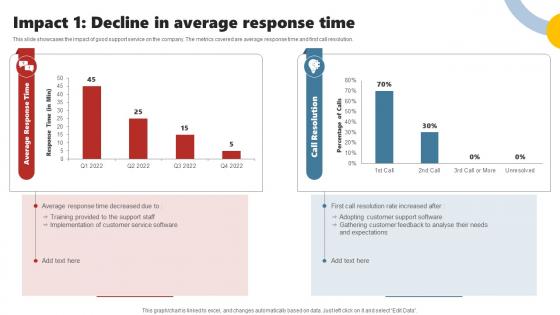 Impact 1 Decline In Average Response Time Enhancing Customer Experience Using Improvement
This slide showcases the impact of good support service on the company. The metrics covered are average response time and first call resolution. Deliver an outstanding presentation on the topic using this Impact 1 Decline In Average Response Time Enhancing Customer Experience Using Improvement. Dispense information and present a thorough explanation of Customer Service Software, Support Staff, Expectations, Customer Feedback using the slides given. This template can be altered and personalized to fit your needs. It is also available for immediate download. So grab it now.
-
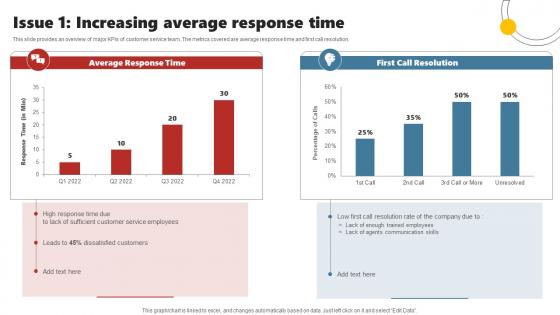 Issue 1 Increasing Average Response Time Enhancing Customer Experience Using Improvement
This slide provides an overview of major KPIs of customer service team. The metrics covered are average response time and first call resolution. Present the topic in a bit more detail with this Issue 1 Increasing Average Response Time Enhancing Customer Experience Using Improvement. Use it as a tool for discussion and navigation on Customer Service Employees, Dissatisfied Customers, Communication Skills. This template is free to edit as deemed fit for your organization. Therefore download it now.
-
 Best Practices For Effective Call Center Call Center Action Plan Dashboard Highlighting Average Answer
This slide showcases call center action plan dashboard which highlights first call resolution, unresolved calls, customers call report, response time by weekday and average answer time. Present the topic in a bit more detail with this Best Practices For Effective Call Center Call Center Action Plan Dashboard Highlighting Average Answer. Use it as a tool for discussion and navigation on Resolutions, Response Time, Average Answer Time. This template is free to edit as deemed fit for your organization. Therefore download it now.
-
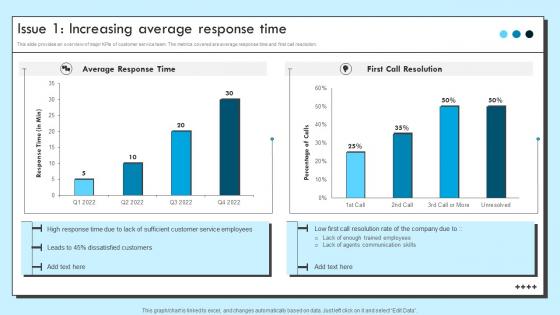 Issue 1 Increasing Average Response Time Improvement Strategies For Support
This slide provides an overview of major KPIs of customer service team. The metrics covered are average response time and first call resolution. Deliver an outstanding presentation on the topic using this Issue 1 Increasing Average Response Time Improvement Strategies For Support. Dispense information and present a thorough explanation of Average Response Time, First Call Resolution using the slides given. This template can be altered and personalized to fit your needs. It is also available for immediate download. So grab it now.
-
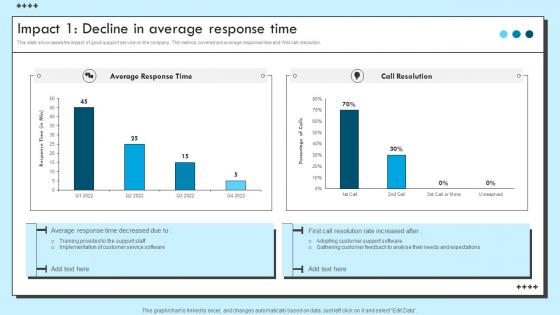 Impact 1 Decline In Average Response Time Improvement Strategies For Support
This slide showcases the impact of good support service on the company. The metrics covered are ticket backlog and support cost. Deliver an outstanding presentation on the topic using this Impact 1 Decline In Average Response Time Improvement Strategies For Support. Dispense information and present a thorough explanation of Average Response Time, Call Resolution using the slides given. This template can be altered and personalized to fit your needs. It is also available for immediate download. So grab it now.
-
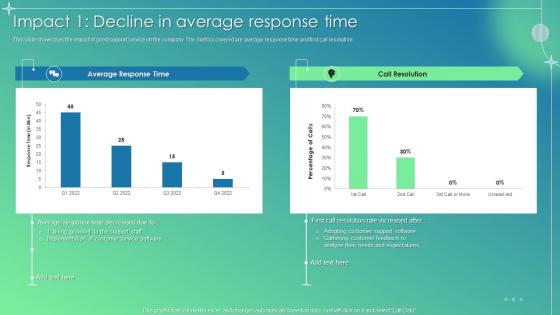 Customer Service Improvement Plan Impact 1 Decline In Average Response Time
This slide showcases the impact of good support service on the company. The metrics covered are average response time and first call resolution. Present the topic in a bit more detail with this Customer Service Improvement Plan Impact 1 Decline In Average Response Time. Use it as a tool for discussion and navigation on Call Resolution, Training Provided, Support Staff, Customer Service Software. This template is free to edit as deemed fit for your organization. Therefore download it now.
-
 Customer Service Improvement Plan Issue 1 Increasing Average Response Time
This slide provides an overview of major KPIs of customer service team. The metrics covered are average response time and first call resolution. Deliver an outstanding presentation on the topic using this Customer Service Improvement Plan Issue 1 Increasing Average Response Time. Dispense information and present a thorough explanation of Average Response Time, First Call Resolution, Agents Communication Skills using the slides given. This template can be altered and personalized to fit your needs. It is also available for immediate download. So grab it now.
-
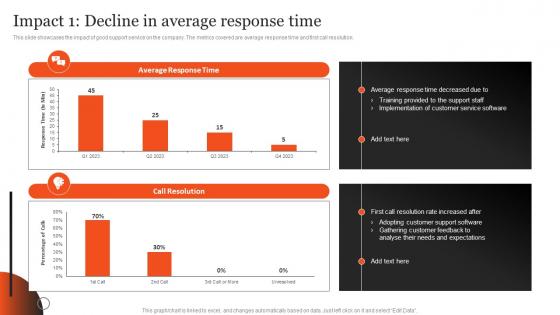 Impact 1 Decline In Average Response Time Plan Optimizing After Sales Services
This slide showcases the impact of good support service on the company. The metrics covered are average response time and first call resolution.Deliver an outstanding presentation on the topic using this Impact 1 Decline In Average Response Time Plan Optimizing After Sales Services. Dispense information and present a thorough explanation of Implementation Customer, Adopting Customer, Needs Expectations using the slides given. This template can be altered and personalized to fit your needs. It is also available for immediate download. So grab it now.
-
 Issue 1 Increasing Average Response Time Plan Optimizing After Sales Services
This slide provides an overview of major KPIs of customer service team. The metrics covered are average response time and first call resolution.Present the topic in a bit more detail with this Issue 1 Increasing Average Response Time Plan Optimizing After Sales Services. Use it as a tool for discussion and navigation on Average Response, Call Resolution, Dissatisfied Customers. This template is free to edit as deemed fit for your organization. Therefore download it now.
-
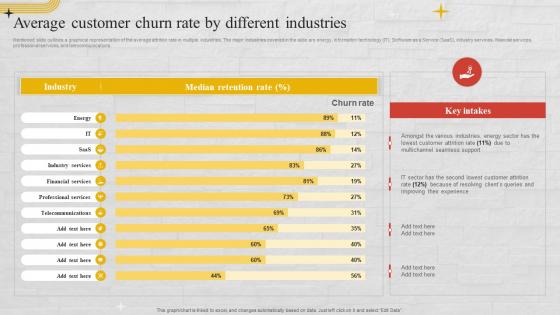 Average Customer Churn Rate By Different Industries Churn Management Techniques
Mentioned slide outlines a graphical representation of the average attrition rate in multiple industries. The major industries covered in the slide are energy, information technology IT, Software as a Service SaaS, industry services, financial services, professional services, and telecommunications. Deliver an outstanding presentation on the topic using this Average Customer Churn Rate By Different Industries Churn Management Techniques. Dispense information and present a thorough explanation of Median Retention Rate, Customer Churn Rate, Seamless Support using the slides given. This template can be altered and personalized to fit your needs. It is also available for immediate download. So grab it now.
-
 Average Revenue Per Customer Online Streaming Service Company Profile CP SS V
The following slide highlights the quarterly revenue generated from each customer. The average revenue depicted is from domestic customers, international customers and Disney plus Hotstar customers. Deliver an outstanding presentation on the topic using this Average Revenue Per Customer Online Streaming Service Company Profile CP SS V Dispense information and present a thorough explanation of Average Revenue, Domestic Market, Customers using the slides given. This template can be altered and personalized to fit your needs. It is also available for immediate download. So grab it now.
-
 Key Statistics Highlighting Average Employee Turnover Rate In Different Industries
The purpose of this slide is to graphically represent the average staff turnover rate in multiple industries. The industries covered in the slide are construction, manufacturing, transportation, information, financial, hospitality, and health services along with key observations. Deliver an outstanding presentation on the topic using this Key Statistics Highlighting Average Employee Turnover Rate In Different Industries. Dispense information and present a thorough explanation of Average Employee, Hospitality Industry using the slides given. This template can be altered and personalized to fit your needs. It is also available for immediate download. So grab it now.
-
 Average Employee Turnover Cost By Profession
This slide illustrates a survey report of professionals facing high turnover cost along with the average rate of all roles. It includes professions such as human resources, research, product management, marketing and consulting. Introducing our Average Employee Turnover Cost By Profession set of slides. The topics discussed in these slides are Profession, Turnover Cost This is an immediately available PowerPoint presentation that can be conveniently customized. Download it and convince your audience.
-
 Key Statistics Highlighting Average Employee Turnover Developing Employee Retention Program
The purpose of this slide is to graphically represent the average staff turnover rate in multiple industries. The industries covered in the slide are construction, manufacturing, transportation, information, financial, hospitality, and health services along with key observations. Present the topic in a bit more detail with this Key Statistics Highlighting Average Employee Turnover Developing Employee Retention Program. Use it as a tool for discussion and navigation on Industries, Employee, Statistics. This template is free to edit as deemed fit for your organization. Therefore download it now.
-
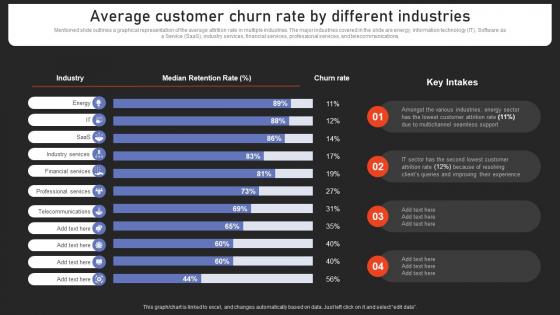 Average Customer Churn Rate By Different Industries Strengthening Customer Loyalty By Preventing
Mentioned slide outlines a graphical representation of the average attrition rate in multiple industries. The major industries covered in the slide are energy, information technology IT, Software as a Service SaaS, industry services, financial services, professional services, and telecommunications. Deliver an outstanding presentation on the topic using this Average Customer Churn Rate By Different Industries Strengthening Customer Loyalty By Preventing. Dispense information and present a thorough explanation of Customer, Industries, Churn Rate using the slides given. This template can be altered and personalized to fit your needs. It is also available for immediate download. So grab it now.
-
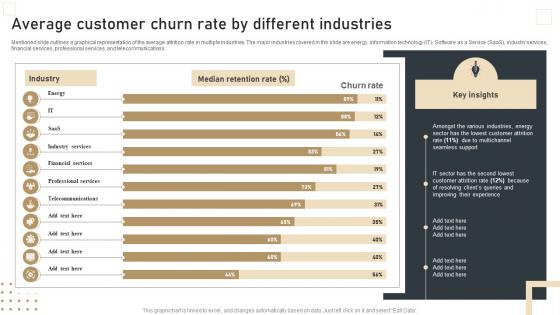 Average Customer Churn Rate By Different Effective Churn Management Strategies For B2B
Mentioned slide outlines a graphical representation of the average attrition rate in multiple industries. The major industries covered in the slide are energy, information technology IT, Software as a Service SaaS, industry services, financial services, professional services, and telecommunications. Present the topic in a bit more detail with this Average Customer Churn Rate By Different Effective Churn Management Strategies For B2B. Use it as a tool for discussion and navigation on Improving Their Experience, Seamless Support, Customer Attrition. This template is free to edit as deemed fit for your organization. Therefore download it now.
-
 Video On Demand Service Company Profile Average Revenue Per Customer CP SS V
The following slide highlights the quarterly revenue generated from each customer. The average revenue depicted is from domestic customers, international customers and Disney plus Hotstar customers. Present the topic in a bit more detail with this Video On Demand Service Company Profile Average Revenue Per Customer CP SS V. Use it as a tool for discussion and navigation on Average Revenue Per Customer, International, International Customer, Domestic Market. This template is free to edit as deemed fit for your organization. Therefore download it now.
-
 Average Revenue Per Customer Ott Media Network Company Profile Cp Cd V
The following slide highlights the quarterly revenue generated from each customer. The average revenue depicted is from domestic customers, international customers and Disney plus Hotstar customers.Deliver an outstanding presentation on the topic using this Average Revenue Per Customer Ott Media Network Company Profile Cp Cd V. Dispense information and present a thorough explanation of Average Revenue, International Customers, Eight Quarters using the slides given. This template can be altered and personalized to fit your needs. It is also available for immediate download. So grab it now.
-
 Manufacturing Operations Key Result Areas With Average Scores
The following slide highlights various indicators in manufacturing operations. The key components are- average result area score of manufacturing and production targets, capacity utilizations, operating efficiency etc.Introducing our Manufacturing Operations Key Result Areas With Average Scores set of slides. The topics discussed in these slides are Manufacturing Production, Operating Efficiency, Manufacturing Facility. This is an immediately available PowerPoint presentation that can be conveniently customized. Download it and convince your audience.
-
 OTT Platform Company Profile Average Revenue Per Customer Ppt Icon Demonstration CP SS V
The following slide highlights the quarterly revenue generated from each customer. The average revenue depicted is from domestic customers, international customers and Disney plus Hotstar customers. Deliver an outstanding presentation on the topic using this OTT Platform Company Profile Average Revenue Per Customer Ppt Icon Demonstration CP SS V. Dispense information and present a thorough explanation of Average Revenue, Per Customer, Paid Subscriber, International Customers using the slides given. This template can be altered and personalized to fit your needs. It is also available for immediate download. So grab it now.
-
 Execution Of Shopping Mall Average Customer Spending In Shopping Malls MKT SS
This slide represents average spending by customers in shopping malls on products and services. It covers information regarding customer buying behavior, sensory emotions, merchandizing offering etc. Present the topic in a bit more detail with this Execution Of Shopping Mall Average Customer Spending In Shopping Malls MKT SS. Use it as a tool for discussion and navigation on Mall Atmosphere, Elicits Positive Perception, Merchandizing Offering, Emotions In Customers. This template is free to edit as deemed fit for your organization. Therefore download it now.
-
 Average Revenue Per Customer OTT Service Technology Company Profile CP SS V
The following slide highlights the quarterly revenue generated from each customer. The average revenue depicted is from domestic customers, international customers and Disney plus Hotstar customers. Deliver an outstanding presentation on the topic using this Average Revenue Per Customer OTT Service Technology Company Profile CP SS V. Dispense information and present a thorough explanation of Average, Revenue, Customer using the slides given. This template can be altered and personalized to fit your needs. It is also available for immediate download. So grab it now.
-
 Impact Increase In Average Customer Spending Deployment Of Effective Credit Stratergy Ss
This slide represents impact of credit card marketing a rise in average customer spending. It includes details regarding rewards, bonuses, cashback, etc.Present the topic in a bit more detail with this Impact Increase In Average Customer Spending Deployment Of Effective Credit Stratergy Ss. Use it as a tool for discussion and navigation on Customer Spending, Each Purchase, Redeemable Points. This template is free to edit as deemed fit for your organization. Therefore download it now.
-
 Call Center Action Plan Dashboard Highlighting Average Bpo Performance Improvement Action Plan
This slide showcases call center action plan dashboard which highlights first call resolution, unresolved calls, customers call report, response time by weekday and average answer time. Present the topic in a bit more detail with this Call Center Action Plan Dashboard Highlighting Average Bpo Performance Improvement Action Plan. Use it as a tool for discussion and navigation on Resolutions, Dashboard, Response. This template is free to edit as deemed fit for your organization. Therefore download it now.
-
 Influencer Marketing Strategy To Attract Potential Global Average Spending
This slide represents global average spending on influencer marketing by organizations. It covers details regarding social media popularity, traditional marketing effectiveness, etc. Present the topic in a bit more detail with this Influencer Marketing Strategy To Attract Potential Global Average Spending. Use it as a tool for discussion and navigation on Average, Influencer, Marketing. This template is free to edit as deemed fit for your organization. Therefore download it now.
-
 Key Statistics Highlighting Average Employee Human Resource Retention Strategies For Business Owners
The purpose of this slide is to graphically represent the average staff turnover rate in multiple industries. The industries covered in the slide are construction, manufacturing, transportation, information, financial, hospitality, and health services along with key observations. Present the topic in a bit more detail with this Key Statistics Highlighting Average Employee Human Resource Retention Strategies For Business Owners. Use it as a tool for discussion and navigation on Construction, Manufacturing, Transportation. This template is free to edit as deemed fit for your organization. Therefore download it now.
-
 Facebook KPI To Measure Average Cost Per Click By Industry
This slide showcases statistical report to measure Facebook ad KPI for various industries for formulating brand awareness strategies. It includes areas such as apparel, auto, B2B, beauty, education, technology, legal, healthcare, fitness, etc. Presenting our well structured Facebook KPI To Measure Average Cost Per Click By Industry. The topics discussed in this slide are Facebook KPI, Measure Average, Cost Per, Click By Industry. This is an instantly available PowerPoint presentation that can be edited conveniently. Download it right away and captivate your audience.
-
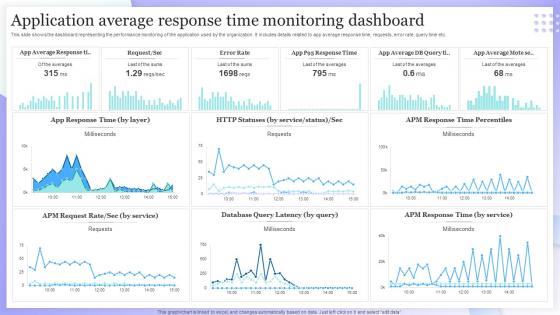 Application Average Response Time Monitoring Dashboard
This slide shows the dashboard representing the performance monitoring of the application used by the organization. It includes details related to app average response time, requests, error rate, query time etc. Introducing our Application Average Response Time Monitoring Dashboard set of slides. The topics discussed in these slides are App Response Time, Database Query Latency. This is an immediately available PowerPoint presentation that can be conveniently customized. Download it and convince your audience.
-
 Social Media Data Based On Average Monthly Users
The following slide showcases social media users in different communities on monthly basis. It presents information related to Facebook, twitter, YouTube, etc. Introducing our Social Media Data Based On Average Monthly Users set of slides. The topics discussed in these slides are Monthly, Average, Media. This is an immediately available PowerPoint presentation that can be conveniently customized. Download it and convince your audience.
-
 Impact Increase In Average Customer Implementation Of Successful Credit Card Strategy SS V
This slide represents impact of credit card marketing a rise in average customer spending. It includes details regarding rewards, bonuses, cashback, etc. Present the topic in a bit more detail with this Impact Increase In Average Customer Implementation Of Successful Credit Card Strategy SS V. Use it as a tool for discussion and navigation on Increase In Average, Customer Spending This template is free to edit as deemed fit for your organization. Therefore download it now.
-
 Hospital KPI Dashboard With Average Waiting Time Strategic Healthcare Marketing Plan Strategy SS
The following slide outlines key performance indicator KPI dashboard that can be used by healthcare professionals to evaluate hospital performance. The metrics outlined in slide are total patients, average treatment costs, available staff, patients by division, etc. Deliver an outstanding presentation on the topic using this Hospital KPI Dashboard With Average Waiting Time Strategic Healthcare Marketing Plan Strategy SS. Dispense information and present a thorough explanation of Outpatients, Inpatients Trend, Patient By Division using the slides given. This template can be altered and personalized to fit your needs. It is also available for immediate download. So grab it now.
-
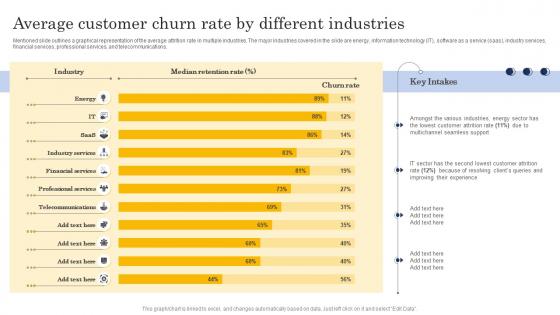 Average Customer Churn Rate By Different Industries Customer Churn Analysis
Mentioned slide outlines a graphical representation of the average attrition rate in multiple industries. The major industries covered in the slide are energy, information technology IT, software as a service saas, industry services, financial services, professional services, and telecommunications. Present the topic in a bit more detail with this Average Customer Churn Rate By Different Industries Customer Churn Analysis Use it as a tool for discussion and navigation on Multichannel Seamless Support, Improving Their Experience This template is free to edit as deemed fit for your organization. Therefore download it now.
-
 Average Customer Spending In Shopping Development And Implementation Of Shopping Center MKT SS V
This slide represents average spending by customers in shopping malls on products and services. It covers information regarding customer buying behavior, sensory emotions, merchandizing offering etc. Present the topic in a bit more detail with this Average Customer Spending In Shopping Development And Implementation Of Shopping Center MKT SS V. Use it as a tool for discussion and navigation on Average, Customer, Shopping. This template is free to edit as deemed fit for your organization. Therefore download it now.
-
 Starbucks Corporation Company Profile Starbucks Product Price Comparison With Average CP SS
Mentioned slide provides insights into differences between Starbucks product pricing with average industry prices. It includes products such as cappuccino, Frappuccino, iced chai tea latte, hot chocolate, iced coffee, etc. Deliver an outstanding presentation on the topic using this Starbucks Corporation Company Profile Starbucks Product Price Comparison With Average CP SS. Dispense information and present a thorough explanation of Pricing Method, Premium Pricing Strategy, Average Market Rate using the slides given. This template can be altered and personalized to fit your needs. It is also available for immediate download. So grab it now.
-
 Impact Increase In Average Customer Spending Building Credit Card Promotional Campaign Strategy SS V
This slide represents impact of credit card marketing a rise in average customer spending. It includes details regarding rewards, bonuses, cashback, etc. Deliver an outstanding presentation on the topic using this Impact Increase In Average Customer Spending Building Credit Card Promotional Campaign Strategy SS V. Dispense information and present a thorough explanation of Impact Increase In Average, Customer Spending using the slides given. This template can be altered and personalized to fit your needs. It is also available for immediate download. So grab it now.
-
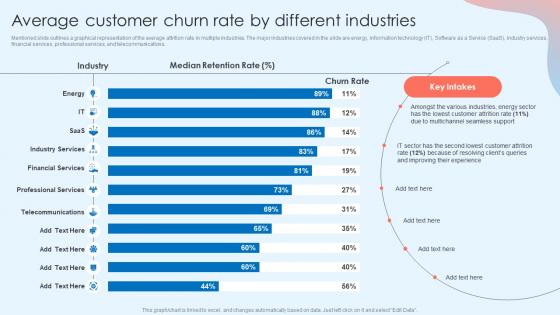 Average Customer Churn Rate By Different Industries Customer Attrition Rate Prevention
Mentioned slide outlines a graphical representation of the average attrition rate in multiple industries. The major industries covered in the slide are energy, information technology IT, Software as a Service SaaS, industry services, financial services, professional services, and telecommunications. Present the topic in a bit more detail with this Average Customer Churn Rate By Different Industries Customer Attrition Rate Prevention. Use it as a tool for discussion and navigation on Median Retention Rate, Average Customer, Different Industries. This template is free to edit as deemed fit for your organization. Therefore download it now.


