Powerpoint Templates and Google slides for Analytical.
Save Your Time and attract your audience with our fully editable PPT Templates and Slides.
-
 Marketing Analytics Dashboard To Evaluate Social Media Startup Marketing Strategies To Increase Strategy SS V
The following slide showcases performance key performance indicator KPI dashboard through which marketing team can measure social media campaign performance. The KPIs highlighted are YouTube channel views, Facebook daily reach, LinkedIn clicks and likes, etc. Deliver an outstanding presentation on the topic using this Marketing Analytics Dashboard To Evaluate Social Media Startup Marketing Strategies To Increase Strategy SS V. Dispense information and present a thorough explanation of Facebook Daily Reach, Youtube Channel Views using the slides given. This template can be altered and personalized to fit your needs. It is also available for immediate download. So grab it now.
-
 Social Media Analytics Dashboard To Track Implementing Strategies To Make Videos
This slides showcases social media analytics dashboard to track viral keywords. It provides details about daily volume, keyword searches, keyword volume, etc. which can effectively guide digital marketers to craft potential campaigns Deliver an outstanding presentation on the topic using this Social Media Analytics Dashboard To Track Implementing Strategies To Make Videos. Dispense information and present a thorough explanation of Social Media, Dashboard using the slides given. This template can be altered and personalized to fit your needs. It is also available for immediate download. So grab it now.
-
 Financial Fraud Analytics Dashboard Of Companies
Following slides show the dashboard of financial fraud analytics of organization which will assist in preventing a foreseeing frauds. This includes KPI such as clients alert, risk entity, etc. Deliver an outstanding presentation on the topic using this Financial Fraud Analytics Dashboard Of Companies. Dispense information and present a thorough explanation of Total Alerts, Clients Alerts, Organization Alerts using the slides given. This template can be altered and personalized to fit your needs. It is also available for immediate download. So grab it now.
-
 Web analytics kpi for active average group joined members powerpoint slide
Presenting, web analytics kpi for active average group joined members PowerPoint slide. Performance indication bar editable for your personalization. Simply convertible in JPEG/PDF format. Promote it through projectors for widescreen visions in meetings. Alter visuals, icons, colors and text. High quality images and the graphics. Insertion of logo and trademarks for more personalization. Quick to download and save. Simple to edit and customize as per your needs. Useful for industry professionals, technologists, managers, executives, researchers, sales people, etc.
-
 Web analytics kpi for people in network active users page impressions ppt slide
Presenting web analytics kpi for people in network active users page impressions ppt slide. This presentation slide shows three Key Performance Indicators or KPIs in a Dashboard style design. The first KPI that can be shown is Average Number of Friends People in Network. The second KPI is Average Age of Active Users and the third is Number of Impressions of Your Posts in News Feed or Ticker or on Your Page. These KPI Powerpoint graphics are all data driven, and the shape automatically adjusts according to your data. Just right click on the KPI graphic, enter the right value and the shape will adjust automatically. Make a visual impact with our KPI slides.
-
 Analytics kpi for average group members groups joined user comments powerpoint slide
Presenting analytics kpi for average group members groups joined user comments powerpoint slide. This presentation slide shows three Key Performance Indicators or KPIs in a Dashboard style design. The first KPI that can be shown is Average Number of Group Members. The second KPI is Average Number of Groups That Member Joined and the third is Average Comments User. These KPI Powerpoint graphics are all data driven, and the shape automatically adjusts according to your data. Just right click on the KPI graphic, enter the right value and the shape will adjust automatically. Make a visual impact with our KPI slides.
-
 Analytics kpi for friend requests people network active members ppt slide
Presenting analytics kpi for friend requests people network active members ppt slide. This presentation slide shows three Key Performance Indicators or KPIs in a Dashboard style design. The first KPI that can be shown is Average Number of Friend Requests. The second KPI is Average Number of Friends People in Network and the third is percentage of Members Active in Groups. These KPI Powerpoint graphics are all data driven, and the shape automatically adjusts according to your data. Just right click on the KPI graphic, enter the right value and the shape will adjust automatically. Make a visual impact with our KPI slides.
-
 Web analytics kpi for number percentage of returning visitors ppt slide
Presenting web analytics kpi for number percentage of returning visitors ppt slide. This presentation slide shows two Key Performance Indicators or KPIs in a Dashboard style design. The first KPI that can be shown is Number of Returning Visitors. The second KPI is Percentage of Returning Visitors. These KPI Powerpoint graphics are all data driven, and the shape automatically adjusts according to your data. Just right click on the KPI graphic, enter the right value and the shape will adjust automatically. Make a visual impact with our KPI slides.
-
 Web analytics kpi for page views page request single access pages presentation slide
Presenting web analytics kpi for page views page request single access pages presentation slide. This presentation slide shows three Key Performance Indicators or KPIs in a Dashboard style design. The first KPI that can be shown is Average Number of Page Views Per Visitor Session. The second KPI is Average Number of Page Request Per Visitor and the third is Number of Single Access Pages. These KPI Powerpoint graphics are all data driven, and the shape automatically adjusts according to your data. Just right click on the KPI graphic, enter the right value and the shape will adjust automatically. Make a visual impact with our KPI slides.
-
 Data analytics kpi for page viewed stories domain impressions presentation slide
Presenting data analytics kpi for page viewed stories domain impressions presentation slide. This presentation slide shows two Key Performance Indicators or KPIs in a Dashboard style design. The first KPI that can be shown is Number of Times People Viewed Stories That Link to Your Site in News Feed or Page. The second KPI is Number of Comments Box Impressions on Your Domain. These KPI Powerpoint graphics are all data driven, and the shape automatically adjusts according to your data. Just right click on the KPI graphic, enter the right value and the shape will adjust automatically. Make a visual impact with our KPI slides.
-
 Female executive profile hiring feedback and analytics
Presenting this set of slides with name - Female Executive Profile Hiring Feedback And Analytics. This is a one stage process. The stages in this process are Company Profiling, Executive Profile, Company Introduction.
-
 Financial comparison business chart analytics and dashboard
Presenting this set of slides with name - Financial Comparison Business Chart Analytics And Dashboard. This is a one stage process. The stages in this process are Financial Comparison, Financial Analysis, Financial Statement.
-
 Financial comparison business report data analytics
Presenting this set of slides with name - Financial Comparison Business Report Data Analytics. This is a one stage process. The stages in this process are Financial Comparison, Financial Analysis, Financial Statement.
-
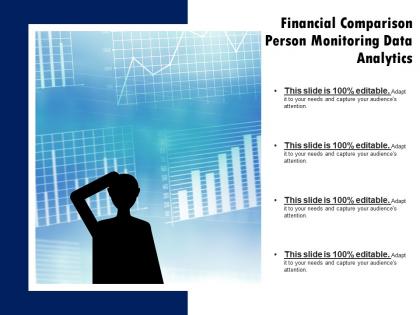 Financial comparison person monitoring data analytics
Presenting this set of slides with name - Financial Comparison Person Monitoring Data Analytics. This is a two stage process. The stages in this process are Financial Comparison, Financial Analysis, Financial Statement.
-
 Integrated planning business team working on marketing analytics
Presenting this set of slides with name - Integrated Planning Business Team Working On Marketing Analytics. This is a four stage process. The stages in this process are Integrated Planning, Integrated Business Planning, Strategic Management.
-
 Mobile analytics dashboard showing daily and weekly retention
Presenting this set of slides with name - Mobile Analytics Dashboard Showing Daily And Weekly Retention. This is a four stage process. The stages in this process are Mobile Analytics, Mobile Tracking, Mobile Web Analytics.
-
 Analytic data chart of business kpi image showing employee working on desktop
Presenting this set of slides with name - Analytic Data Chart Of Business Kpi Image Showing Employee Working On Desktop. This is a three stage process. The stages in this process are Business Kpi, Business Dashboard, Business Metrics.
-
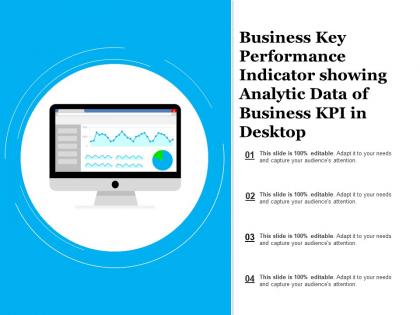 Business key performance indicator showing analytic data of business kpi in desktop
Presenting this set of slides with name - Business Key Performance Indicator Showing Analytic Data Of Business Kpi In Desktop. This is a four stage process. The stages in this process are Business Kpi, Business Dashboard, Business Metrics.
-
 Business kpi contain visualization aid of analytic data in form of bar chart
Presenting this set of slides with name - Business Kpi Contain Visualization Aid Of Analytic Data In Form Of Bar Chart. This is a four stage process. The stages in this process are Business Kpi, Business Dashboard, Business Metrics.
-
 Vendor kpi dashboard showing store analytics sales by product and product stats
Presenting this set of slides with name - Vendor Kpi Dashboard Showing Store Analytics Sales By Product And Product Stats. This is a four stage process. The stages in this process are Vendor, Supplier, Retailer.
-
 Business intelligence market analytics and performance dashboard
Presenting this set of slides with name - Business Intelligence Market Analytics And Performance Dashboard. This is a three stage process. The stages in this process are Business Understanding, Business Intelligence, Business Knowledge.
-
 Business intelligence with analytics report image
Presenting this set of slides with name - Business Intelligence With Analytics Report Image. This is a one stage process. The stages in this process are Business Understanding, Business Intelligence, Business Knowledge.
-
 Business intelligence with data analytics report
Presenting this set of slides with name - Business Intelligence With Data Analytics Report. This is a one stage process. The stages in this process are Business Understanding, Business Intelligence, Business Knowledge.
-
 Business intelligence with discussion on analytics report
Presenting this set of slides with name - Business Intelligence With Discussion On Analytics Report. This is a one stage process. The stages in this process are Business Understanding, Business Intelligence, Business Knowledge.
-
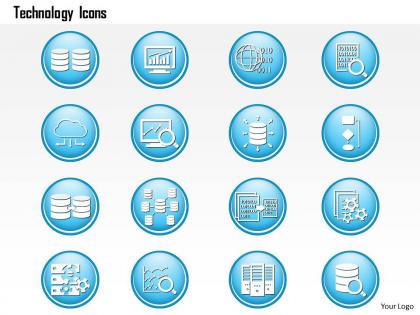 0914 Big Data Technology Icons Analytics Storage Replication Dashboard Magnify Ppt Slide
Gracefully and delicately designed PPT visual. Convenience to modify the design as per the communal constraint. Spotless quality of pictures and images used in the designing. Access to add business details such as insignia, design or portrait. Brisk download and easy to share with large set of viewers. Flexible presentation background as slickly adjustable into JPG and PDF format. Presentation illustration downloadable in standard and widescreen display view.
-
 Digital analytics account campaign performance
Presenting this set of slides with name - Digital Analytics Account Campaign Performance. This is a five stage process. The stages in this process are Digital Analytics, Digital Dashboard, Digital Kpis.
-
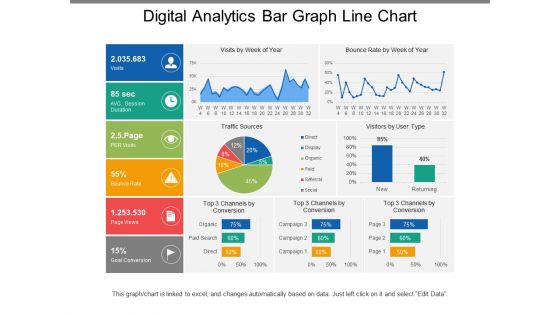 Digital analytics bar graph line chart
Presenting this set of slides with name - Digital Analytics Bar Graph Line Chart. This is a five stage process. The stages in this process are Digital Analytics, Digital Dashboard, Digital Kpis.
-
 Digital analytics dashboard pie chart
Presenting this set of slides with name - Digital Analytics Dashboard Pie Chart. This is a five stage process. The stages in this process are Digital Analytics, Digital Dashboard, Digital Kpis.
-
 Digital analytics magnifying glass interlinked nodes
Presenting this set of slides with name - Digital Analytics Magnifying Glass Interlinked Nodes. This is a five stage process. The stages in this process are Digital Analytics, Digital Dashboard, Digital Kpis.
-
 Digital analytics organic direct search referral social
Presenting this set of slides with name - Digital Analytics Organic Direct Search Referral Social. This is a five stage process. The stages in this process are Digital Analytics, Digital Dashboard, Digital Kpis.
-
 Digital analytics organic direct search referral social ppt example
Presenting this set of slides with name - Digital Analytics Organic Direct Search Referral Social Ppt Example. This is a five stage process. The stages in this process are Digital Analytics, Digital Dashboard, Digital Kpis.
-
 Digital analytics session traffic course conversion
Presenting this set of slides with name - Digital Analytics Session Traffic Course Conversion. This is a five stage process. The stages in this process are Digital Analytics, Digital Dashboard, Digital Kpis.
-
 Innovation technology laptop touchscreen analytics image
Presenting this set of slides with name - Innovation Technology Laptop Touchscreen Analytics Image. This is a one stage process. The stages in this process are Innovation Idea, Innovation Management, Concept.
-
 Conversion cost click rate market analytics dashboard with icons
Presenting this set of slides with name - Conversion Cost Click Rate Market Analytics Dashboard With Icons. This is a three stage process. The stages in this process are Marketing Analytics, Marketing Performance, Marketing Discovery.
-
 Management analytical results expand new markets identifying stakeholders cpb
Presenting this set of slides with name - Management Analytical Results Expand New Markets Identifying Stakeholders Cpb. This is an editable one stages graphic that deals with topics like Management Analytical Results, Expand New Markets, Identifying Stakeholders to help convey your message better graphically. This product is a premium product available for immediate download, and is 100 percent editable in Powerpoint. Download this now and use it in your presentations to impress your audience.
-
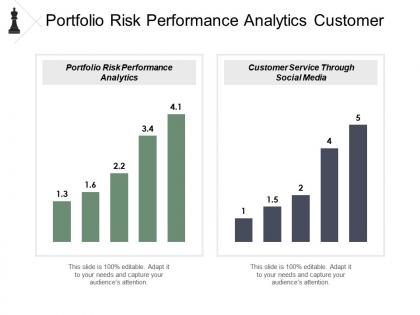 Portfolio risk performance analytics customer service through social media cpb
Presenting this set of slides with name - Portfolio Risk Performance Analytics Customer Service Through Social Media Cpb. This is an editable two stages graphic that deals with topics like Portfolio Risk Performance Analytics, Customer Service Through Social Media to help convey your message better graphically. This product is a premium product available for immediate download, and is 100 percent editable in Powerpoint. Download this now and use it in your presentations to impress your audience.
-
 Web-based data visualization and analytics on mobile devices
Presenting this set of slides with name - Web-Based Data Visualization And Analytics On Mobile Devices. This is a two stage process. The stages in this process are Data Visualization, Data Management, Data Representation.
-
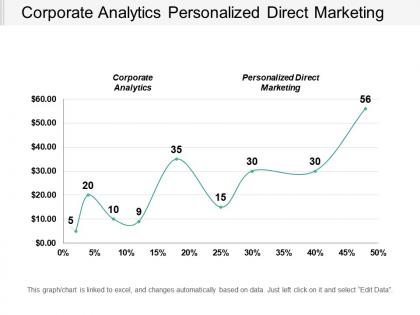 Corporate analytics personalized direct marketing financial performance work management cpb
Presenting this set of slides with name - Corporate Analytics Personalized Direct Marketing Financial Performance Work Management Cpb. This is an editable two stages graphic that deals with topics like Corporate Analytics, Personalized Direct Marketing Financial Performance, Work Management to help convey your message better graphically. This product is a premium product available for immediate download, and is 100 percent editable in Powerpoint. Download this now and use it in your presentations to impress your audience.
-
 Management stock plan finance opportunities presentation solution predictive analytics cpb
This is an editable two stages graphic that deals with topics like Management Stock Plan, Finance Opportunities, Presentation Solution, Predictive Analytics to help convey your message better graphically. This product is a premium product available for immediate download, and is 100 percent editable in Powerpoint. Download this now and use it in your presentations to impress your audience.
-
 Distribution channel strategy downsizing effects ads analytics hr analytics cpb
This is an editable three stages graphic that deals with topics like Distribution Channel Strategy, Downsizing Effects, Ads Analytics, Hr Analytics to help convey your message better graphically. This product is a premium product available for immediate download, and is 100 percent editable in Powerpoint. Download this now and use it in your presentations to impress your audience.
-
 Digital content showing laptop with analytics monitor image
This is a three stage process. The stages in this process are Digital Content, Digital Information, Digital Data.
-
 Strategic digital marketing marketing analytics assessment hybrid cloud cpb
This is an editable two stages graphic that deals with topics like Strategic Digital Marketing, Marketing Analytics Assessment, Hybrid Cloud to help convey your message better graphically. This product is a premium product available for immediate download, and is 100 percent editable in Powerpoint. Download this now and use it in your presentations to impress your audience.
-
 Business analytics dashboard snapshot customer share and balance by region
This is a four stage process. The stages in this process are Business Analytics, BA, Organizations Data.
-
 Business analytics dashboard snapshot with net sales product inventory purchases and performance
This is a five stage process. The stages in this process are Business Analytics, BA, Organizations Data.
-
 Business analytics dashboard snapshot with online sales tracking and product profit per unit
This is a two stage process. The stages in this process are Business Analytics, BA, Organizations Data.
-
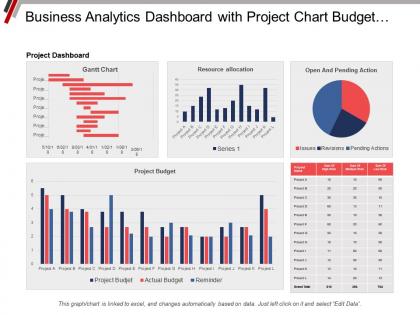 Business analytics dashboard snapshot with project chart budget resource allocation and pending actions
This is a five stage process. The stages in this process are Business Analytics, BA, Organizations Data.
-
 Business analytics dashboard snapshot with revenue by month and region
This is a two stage process. The stages in this process are Business Analytics, BA, Organizations Data.
-
 Business analytics dashboard snapshot with revenue per product line and detailed profit
This is a eight stage process. The stages in this process are Business Analytics, BA, Organizations Data.
-
 Business analytics dashboard with supply chain overview and sales in unit price increase or decrease
This is a three stage process. The stages in this process are Business Analytics, BA, Organizations Data.
-
 Business analytics dashboard with total leads sales and new customers
This is a three stage process. The stages in this process are Business Analytics, BA, Organizations Data.
-
 Data analytics testing social media crisis management strategy cpb
Presenting this set of slides with name - Data Analytics Testing Social Media Crisis Management Strategy Cpb. This is an editable four stages graphic that deals with topics like Data Analytics Testing, Social Media Crisis Management Strategy to help convey your message better graphically. This product is a premium product available for immediate download, and is 100 percent editable in Powerpoint. Download this now and use it in your presentations to impress your audience.
-
 Cross functional communication conversion optimisation organizational competence predictive analytics cpb
Presenting this set of slides with name - Cross Functional Communication Conversion Optimisation Organizational Competence Predictive Analytics Cpb. This is an editable two stages graphic that deals with topics like Cross Functional Communication, Conversion Optimisation, Organizational Competence, Predictive Analytics to help convey your message better graphically. This product is a premium product available for immediate download, and is 100 percent editable in Powerpoint. Download this now and use it in your presentations to impress your audience.
-
 Brand marketing automation mobile product development operational analytics cpb
Presenting this set of slides with name - Brand Marketing Automation Mobile Product Development Operational Analytics Cpb. This is an editable two stages graphic that deals with topics like Brand Marketing Automation, Mobile Product Development, Operational Analytics to help convey your message better graphically. This product is a premium product available for immediate download,and is 100 percent editable in Powerpoint. Download this now and use it in your presentations to impress your audience.
-
 Processing strategy product lifecycle sentiment analytics relationships marketing cpb
Presenting this set of slides with name - Processing Strategy Product Lifecycle Sentiment Analytics Relationships Marketing Cpb. This is an editable one stages graphic that deals with topics like Processing Strategy, Product Lifecycle, Sentiment Analytics, Relationships Marketing to help convey your message better graphically. This product is a premium product available for immediate download,and is 100 percent editable in Powerpoint. Download this now and use it in your presentations to impress your audience.
-
 Company valuation model customer service analytics product liability cpb
Presenting this set of slides with name - Company Valuation Model Customer Service Analytics Product Liability Cpb. This is an editable four stages graphic that deals with topics like Company Valuation Model, Customer Service Analytics, Product Liability to help convey your message better graphically. This product is a premium product available for immediate download,and is 100 percent editable in Powerpoint. Download this now and use it in your presentations to impress your audience.
-
 Predictive customer analytics ppt powerpoint presentation file example cpb
Presenting this set of slides with name - Predictive Customer Analytics Ppt Powerpoint Presentation File Example Cpb. This is an editable three stages graphic that deals with topics like Predictive Customer Analytics to help convey your message better graphically. This product is a premium product available for immediate download, and is 100 percent editable in Powerpoint. Download this now and use it in your presentations to impress your audience.
-
 Sales analytics business ppt powerpoint presentation inspiration infographics cpb
Presenting this set of slides with name - Sales Analytics Business Ppt Powerpoint Presentation Inspiration Infographics Cpb. This is an editable four stages graphic that deals with topics like Sales Analytics Business to help convey your message better graphically. This product is a premium product available for immediate download, and is 100 percent editable in Powerpoint. Download this now and use it in your presentations to impress your audience.
-
 Business analytics ppt powerpoint presentation infographic template inspiration cpb
Presenting this set of slides with name - Business Analytics Ppt Powerpoint Presentation Infographic Template Inspiration Cpb. This is an editable two stages graphic that deals with topics like Business Analytics to help convey your message better graphically. This product is a premium product available for immediate download, and is 100 percent editable in Powerpoint. Download this now and use it in your presentations to impress your audience.
-
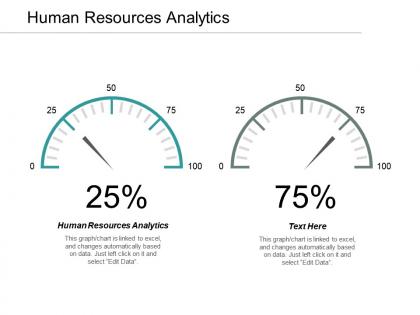 Human resources analytics ppt powerpoint presentation infographic template themes cpb
Presenting this set of slides with name - Human Resources Analytics Ppt Powerpoint Presentation Infographic Template Themes Cpb. This is an editable two stages graphic that deals with topics like Human Resources Analytics to help convey your message better graphically. This product is a premium product available for immediate download, and is 100 percent editable in Powerpoint. Download this now and use it in your presentations to impress your audience.
-
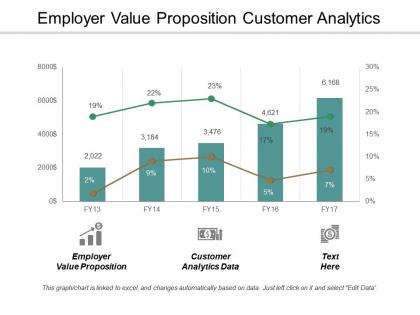 Employer value proposition customer analytics data strategy five steps cpb
Presenting this set of slides with name - Employer Value Proposition Customer Analytics Data Strategy Five Steps Cpb. This is an editable three stages graphic that deals with topics like Employer Value Proposition, Customer Analytics Data, Strategy Five Steps to help convey your message better graphically. This product is a premium product available for immediate download, and is 100 percent editable in Powerpoint. Download this now and use it in your presentations to impress your audience.


