Data analytics kpi for page viewed stories domain impressions presentation slide
The data analytics powerpoint templates provided by Slideteam are a great way to get started with data visualization. With these templates, you can easily create graphs, charts, and other visuals that will help you understand your data better. Not only are the templates easy to use, but they also look professional and polished. So if you’re looking for a way to improve your data analysis skills, be sure to check out Slideteam’s library of templates.
You must be logged in to download this presentation.
 Impress your
 audience
Editable
of Time
PowerPoint presentation slides
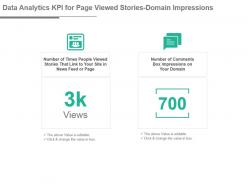
Presenting data analytics kpi for page viewed stories domain impressions presentation slide. This presentation slide shows two Key Performance Indicators or KPIs in a Dashboard style design. The first KPI that can be shown is Number of Times People Viewed Stories That Link to Your Site in News Feed or Page. The second KPI is Number of Comments Box Impressions on Your Domain. These KPI Powerpoint graphics are all data driven, and the shape automatically adjusts according to your data. Just right click on the KPI graphic, enter the right value and the shape will adjust automatically. Make a visual impact with our KPI slides.
People who downloaded this PowerPoint presentation also viewed the following :
Data analytics kpi for page viewed stories domain impressions presentation slide with all 6 slides:
Use our Data Analytics Kpi For Page Viewed Stories Domain Impressions Presentation Slide to effectively help you save your valuable time. They are readymade to fit into any presentation structure.
-
Innovative and attractive designs.
-
Unique and attractive product design.
-
The Designed Graphic are very professional and classic.


