- Sub Categories
-
 Audit kpi dashboard of operating systems manufacturer report and model report
Presenting this set of slides with name - Audit Kpi Dashboard Of Operating Systems Manufacturer Report And Model Report. This is a five stage process. The stages in this process are Audit, Examine, Survey.
-
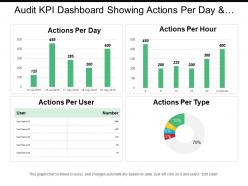 Audit kpi dashboard showing actions per day and actions per hour
Presenting this set of slides with name - Audit Kpi Dashboard Showing Actions Per Day And Actions Per Hour. This is a five stage process. The stages in this process are Audit, Examine, Survey.
-
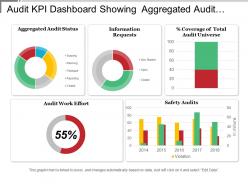 Audit kpi dashboard showing aggregated audit status and audit work effort
Presenting this set of slides with name - Audit Kpi Dashboard Showing Aggregated Audit Status And Audit Work Effort. This is a five stage process. The stages in this process are Audit, Examine, Survey.
-
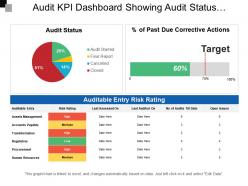 Audit kpi dashboard showing audit status auditable entry risk rating
Presenting this set of slides with name - Audit Kpi Dashboard Showing Audit Status Auditable Entry Risk Rating. This is a four stage process. The stages in this process are Audit, Examine, Survey.
-
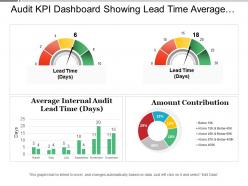 Audit kpi dashboard showing lead time average entry variance and amount contribution
Presenting this set of slides with name - Audit Kpi Dashboard Showing Lead Time Average Entry Variance And Amount Contribution. This is a four stage process. The stages in this process are Audit, Examine, Survey.
-
 Audit kpi dashboard showing overall assurance internal audit and results
Presenting audit kpi dashboard showing overall assurance internal audit and results presentation slide. The PPT layout is extremely easy to understand as it enables you to roll out various improvements to the editable slides. You can change the text dimension, textual style and furthermore the textual style shading according to your prerequisites. Layout slide can be downloaded rapidly and taxi be spared in configuration of PDF or JPG effectively. The format slide in the wake of being downloaded can be seen in extensive screen show proportion of 16:9 or standard size presentation proportion of 4:3.
-
 Audit kpi dashboard showing recurring audit finding instances and audit finding summary
Presenting this set of slides with name - Audit Kpi Dashboard Showing Recurring Audit Finding Instances And Audit Finding Summary. This is a four stage process. The stages in this process are Audit, Examine, Survey.
-
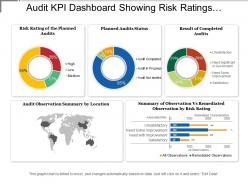 Audit kpi dashboard showing risk ratings planned audit status
Presenting this set of slides with name - Audit Kpi Dashboard Showing Risk Ratings Planned Audit Status. This is a five stage process. The stages in this process are Audit, Examine, Survey.
-
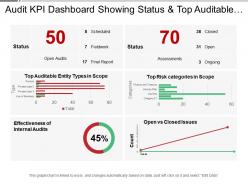 Audit kpi dashboard showing status and top auditable entity types
Presenting this set of slides with name - Audit Kpi Dashboard Showing Status And Top Auditable Entity Types. This is a six stage process. The stages in this process are Audit, Examine, Survey.
-
 Social media audit kpi dashboard showing followers activity summary and activity leads
This PPT template is very useful for your business PowerPoint presentation. It is fully editable and has editable features like editable font, font size, font color, etc. There are many shapes to choose from like squares, triangles, circles, rectangles, pentagon and many more shapes in order to edit this presentation in PowerPoint. All the images in this PPT are 100% editable. The excel-linked charts in this PPT template can also be edited with ease. It can be viewed and saved in JPG or PDF format. It is fully compatible with Google slides as well.
-
 Call center kpi dashboard showing abandon percentage total queue entries
PowerPoint shape easy to amend as color, text, font etc are amendable. Notable quality presentation template. Well-adjusted online software programs such as JPG and PDF. Extra-ordinary picture quality as pixels don’t break when viewed in widescreen view. PPT design goes well with Google slides. Matching designs available with different nodes and stages. Handy presentation design saves you valuable time. Show the PowerPoint diagram with your corporate sign and title. Easy to download and can be saved for future reference.
-
 Call center kpi dashboard showing abandoned calls group calls group statistics
Presenting this set of slides with name - Call Center Kpi Dashboard Showing Abandoned Calls Group Calls Group Statistics. This is a four stage process. The stages in this process are Call Center Agent, Customer Care, Client Support.
-
 Call center kpi dashboard showing agent talking longest call waiting call handling
Presenting this set of slides with name - Call Center Kpi Dashboard Showing Agent Talking Longest Call Waiting Call Handling. This is a five stage process. The stages in this process are Call Center Agent, Customer Care, Client Support.
-
 Call center kpi dashboard showing budget call volume agent costs percentage sales target
Presenting this set of slides with name - Call Center Kpi Dashboard Showing Budget Call Volume Agent Costs Percentage Sales Target. This is a four stage process. The stages in this process are Call Center Agent, Customer Care, Client Support.
-
 Call center kpi dashboard showing call resolution currently active and waiting
Presenting this set of slides with name - Call Center Kpi Dashboard Showing Call Resolution Currently Active And Waiting. This is a one stage process. The stages in this process are Call Center Agent, Customer Care, Client Support.
-
 Call center kpi dashboard showing first call resolution response time
Presenting call center KPI dashboard showing first call resolution response time. This deck offers you plenty of space to put in titles and sub titles. This template is Excel linked just right click to input your information. High resolution-based layout, does not change the image even after resizing. This presentation icon is fully compatible with Google slides. Quick downloading speed and simple editing options in color text and fonts.PPT icons can easily be changed into JPEG and PDF applications.
-
 Call center kpi dashboard snapshot showing key metrics customer satisfaction
Introducing call center kpi dashboard snapshot showing key metrics customer satisfaction presentation template. Slide designs quality does not deflect when opened on a wide screen show. Inconvenience free fuse of tweaked shading, content and illustrations. Slide incorporates instructional slides to give direction to change the graphical substance. Spare the presentation graphics in JPG or PDF organize. Successfully valuable for the systems administration experts, mediators and the procedure architects, it administrators, data innovation firms. Format slide with various stages or hubs are accessible. Simplicity of download.
-
 Call center kpi dashboard showing longest call waiting and average talk time
Presenting this set of slides with name - Call Center Kpi Dashboard Showing Longest Call Waiting And Average Talk Time. This is a three stage process. The stages in this process are Call Center Agent, Customer Care, Client Support.
-
 Call center kpi dashboard showing satisfaction index customer retention
Presenting this set of slides with name - Call Center Kpi Dashboard Showing Satisfaction Index Customer Retention. This is a five stage process. The stages in this process are Call Center Agent, Customer Care, Client Support.
-
 Call center kpi dashboard showing total calls average answer speed abandon rate
Presenting this set of slides with name - Call Center Kpi Dashboard Showing Total Calls Average Answer Speed Abandon Rate. This is a five stage process. The stages in this process are Call Center Agent, Customer Care, Client Support.
-
 Call center kpi dashboard showing total revenue customer satisfaction costs per support
Presenting this set of slides with name - Call Center Kpi Dashboard Showing Total Revenue Customer Satisfaction Costs Per Support. This is a four stage process. The stages in this process are Call Center Agent, Customer Care, Client Support.
-
 Maintenance kpi dashboard showing average maintenance costs
Presenting this set of slides with name - Maintenance Kpi Dashboard Showing Average Maintenance Costs. This is a one stage process. The stages in this process are Maintenance, Preservation, Conservation.
-
 Maintenance kpi dashboard snapshot showing estimates awaiting approval
Presenting maintenance KPI dashboard snapshot showing estimates awaiting approval PPT slide. This layout is fully compatible with Google slides and data driven. User can edit the data in linked excel sheet and the design will change accordingly. Easy to put in company logo, trademark or name; accommodate words to support the key points. Images do no distort out even when they are projected on large screen. Adjust colors, text and fonts as per your business requirements.
-
 Maintenance kpi dashboard showing machine downtime and alert type
Presenting this set of slides with name - Maintenance Kpi Dashboard Showing Machine Downtime And Alert Type. This is a three stage process. The stages in this process are Maintenance, Preservation, Conservation.
-
 Maintenance kpi dashboard showing overdue work orders by priority and department
Presenting this set of slides with name - Maintenance Kpi Dashboard Showing Overdue Work Orders By Priority And Department. This is a four stage process. The stages in this process are Maintenance, Preservation, Conservation.
-
 Maintenance kpi dashboard showing preventive maintenance
Presenting this set of slides with name - Maintenance Kpi Dashboard Showing Preventive Maintenance. This is a six stage process. The stages in this process are Maintenance, Preservation, Conservation.
-
 Project status kpi dashboard snapshot showing delivery roadmap and resource allocation
Presenting project status KPI dashboard snapshot showing delivery roadmap and resource allocation. Simple data input with linked Excel chart, just right click to input values. This PowerPoint theme is fully supported by Google slides. Picture quality of these slides does not change even when project on large screen. Fast downloading speed and formats can be easily changed to JPEG and PDF applications. This template is suitable for marketing, sales persons, business managers and entrepreneurs. Adjust PPT layout, font, text and color as per your necessity.
-
 Project status kpi dashboard showing performance and resource capacity
Presenting this set of slides with name - Project Status Kpi Dashboard Showing Performance And Resource Capacity. This is a six stage process. The stages in this process are Project Health Card, Project Performance, Project Status.
-
 Project status kpi dashboard showing portfolio statistics and workflow phase
Presenting Project Status Kpi Dashboard Showing Portfolio Statistics And Workflow Phase PPT template. All around planned layout slide. This template slide is completely perfect with Google. Tend to upgrade the general effect of your introduction. Introduced to be spared in JPEG, JPG or PDF arrange whenever required. Space accessible to include your organization data as and when required. The format slide is famous and popular because of its simple utilize and openness. Basic and accommodating downloading by following clear advances. This slide keeps up the demonstrable skill of the introduction.
-
 Project status kpi dashboard showing project plan and burndown chart
Presenting status KPI dashboard showing project plan and burndown chart PowerPoint slides. This layout is Compatible with Google slides. Easy to put in company logo, trademark or name; accommodate words to support the key points. Images do no blur out even when they are projected on large screen.PPT template can be utilized by sales and marketing teams and business managers. Instantly downloadable slide and supports formats like JPEG and PDF. Adjust colors, text and fonts as per your business requirements.
-
 Project status kpi dashboard showing project timeline and budget
Presenting this set of slides with name - Project Status Kpi Dashboard Showing Project Timeline And Budget. This is a five stage process. The stages in this process are Project Health Card, Project Performance, Project Status.
-
 Project status kpi dashboard showing task summary
Presentation template is attainable in standard and widescreen view. Presentation slides created with high quality resolution design. Totally variable design as color, text and font can be edited with ease. PPT slide easy to download with different slides. Easy to transmute the presentation slide into JPEG and PDF document. Download is quick. PowerPoint slide helps you to save time and effort. Just enter the business information and share with your shareholders, clients, team etc. Professionally crafted with concept in mind.
-
 Financial due diligence ppt slide show
Presenting this set of slides with name - Financial Due Diligence Ppt Slide Show. This is a one stage process. The stages in this process are Finance, Marketing, Strategy, Analysis, Business.
-
 Activity ratios powerpoint slide
Presenting this set of slides with name - Activity Ratios Powerpoint Slide. This is a two stage process. The stages in this process are Business, Finance, Marketing, Strategy, Analysis.
-
 Area chart powerpoint slide templates download
Presenting this set of slides with name - Area Chart Powerpoint Slide Templates Download. This is a two stage process. The stages in this process are Area Chart, Finance, Marketing, Strategy, Analysis.
-
 Balance sheet kpis ppt examples professional
Presenting this set of slides with name - Balance Sheet Kpis Ppt Examples Professional. This is a four stage process. The stages in this process are Balance Sheet, Finance, Marketing, Strategy, Analysis.
-
 Bubble chart powerpoint slide presentation examples
Presenting this set of slides with name - Bubble Chart Powerpoint Slide Presentation Examples. This is a two stage process. The stages in this process are Bubble Chart, Finance, Marketing, Strategy, Analysis.
-
 Cash flow statement kpis powerpoint slide show
Presenting this set of slides with name - Cash Flow Statement Kpis Powerpoint Slide Show. This is a four stage process. The stages in this process are Cash Flow Statement, Finance, Marketing, Strategy, Analysis.
-
 Key financial ratios template 1 powerpoint slide background designs
Presenting this set of slides with name - Key Financial Ratios Template 1 Powerpoint Slide Background Designs. This is a four stage process. The stages in this process are Business, Donut Chart, Finance, Marketing, Strategy, Analysis.
-
 Liquidity ratios powerpoint slide template
Presenting this set of slides with name - Liquidity Ratios Powerpoint Slide Template. This is a two stage process. The stages in this process are Liquidity Ratios, Finance, Marketing, Strategy, Analysis.
-
 P and l kpis powerpoint slide designs download
Presenting this set of slides with name - P And L Kpis Powerpoint Slide Designs Download. This is a four stage process. The stages in this process are Business, Finance, Marketing, Strategy, Analysis.
-
 Profitability ratios powerpoint slide backgrounds
Presenting this set of slides with name - Profitability Ratios Powerpoint Slide Backgrounds. This is a two stage process. The stages in this process are Profitability Ratios, Finance, Marketing, Strategy, Analysis.
-
 Radar chart generic suffixes
Presenting this set of slides with name - Radar Chart Generic Suffixes. This is a two stage process. The stages in this process are Radar Chart, Finance, Marketing, Strategy, Analysis.
-
 Solvency ratios powerpoint show
Presenting this set of slides with name - Solvency Ratios Powerpoint Show. This is a two stage process. The stages in this process are Solvency Ratios, Finance, Marketing, Strategy, Analysis.
-
 Business kpi dashboard showing gross profit margin opex ratio and ebit margin
Presenting this set of slides with name - Business Kpi Dashboard Showing Gross Profit Margin Opex Ratio And Ebit Margin. This is a three stage process. The stages in this process are Business Dashboard, Business Kpi, Business Performance.
-
 Business kpi dashboard showing lead to opportunity ratio
Presenting this set of slides with name - Business Kpi Dashboard Showing Lead To Opportunity Ratio. This is a three stage process. The stages in this process are Business Dashboard, Business Kpi, Business Performance.
-
 Business kpi dashboard showing marketing spend and return on investment
Presenting this set of slides with name - Business Kpi Dashboard Showing Marketing Spend And Return On Investment. This is a three stage process. The stages in this process are Business Dashboard, Business Kpi, Business Performance.
-
 Business kpi dashboard snapshot showing net promoter score
Presenting this set of slides with name - Business Kpi Dashboard Snapshot Showing Net Promoter Score. This is a two stage process. The stages in this process are Business Dashboard, Business Kpi, Business Performance.
-
 Business kpi dashboard showing project budget overdue tasks and workload
Presenting this set of slides with name - Business Kpi Dashboard Showing Project Budget Overdue Tasks And Workload. This is a two stage process. The stages in this process are Business Dashboard, Business Kpi, Business Performance.
-
 Business kpi dashboard showing return on assets debt-equity ratio
Presenting this set of slides with name - Business Kpi Dashboard Showing Return On Assets Debt-Equity Ratio. This is a six stage process. The stages in this process are Business Dashboard, Business Kpi, Business Performance.
-
 Business kpi dashboard showing revenue and customer lifetime value
Presenting this set of slides with name - Business Kpi Dashboard Showing Revenue And Customer Lifetime Value. This is a four stage process. The stages in this process are Business Dashboard, Business Kpi, Business Performance.
-
 Business kpi dashboard showing sales cycle length and sales funnel
Presenting this set of slides with name - Business Kpi Dashboard Showing Sales Cycle Length And Sales Funnel. This is a three stage process. The stages in this process are Business Dashboard, Business Kpi, Business Performance.
-
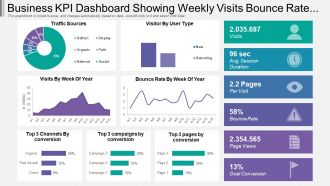 Business Kpi Dashboard Snapshot Showing Weekly Visits Bounce Rate And Traffic Source
Presentation graphic is totally compatible with Google slides. Multiple display options i.e. standard and widescreen. 100 percent editable designs to show your creativity. Similar designs available with different nodes and stages. Easy to download and convert into JPEG or PDF format. Alteration can be done in color, text and shape. Pre-designed PPT slide just download and insert it in the presentation. Quick download with easy to save. Choice to add company logo and replace text as required. High resolution quality ensures no pixilation.
-
 Compliance And Legal Kpi Dashboard Showing Cases By Due Date
Presenting this set of slides with name - Compliance And Legal Kpi Dashboard Showing Cases By Due Date. This is a four stage process. The stages in this process are Compliance And Legal, Legal Governance, Risk Management.
-
 Compliance and legal kpi dashboard showing compliance issues and resolution time
Presenting this set of slides with name - Compliance And Legal Kpi Dashboard Showing Compliance Issues And Resolution Time. This is a three stage process. The stages in this process are Compliance And Legal, Legal Governance, Risk Management.
-
 Compliance and legal kpi dashboard showing high priority violations
Presenting this set of slides with name - Compliance And Legal Kpi Dashboard Showing High Priority Violations. This is a six stage process. The stages in this process are Compliance And Legal, Legal Governance, Risk Management.
-
 Compliance and legal kpi dashboard showing outcome comparison
Presenting this set of slides with name - Compliance And Legal Kpi Dashboard Showing Outcome Comparison. This is a three stage process. The stages in this process are Compliance And Legal, Legal Governance, Risk Management.
-
 Compliance and legal kpi dashboard showing overall compliance maturity level
Presenting this set of slides with name - Compliance And Legal Kpi Dashboard Showing Overall Compliance Maturity Level. This is a three stage process. The stages in this process are Compliance And Legal, Legal Governance, Risk Management.
-
 Compliance and legal kpi dashboard showing overall compliance status
Presenting this set of slides with name - Compliance And Legal Kpi Dashboard Showing Overall Compliance Status. This is a three stage process. The stages in this process are Compliance And Legal, Legal Governance, Risk Management.
-
 Compliance and legal kpi dashboard showing regulatory compliance
Presenting this set of slides with name - Compliance And Legal Kpi Dashboard Showing Regulatory Compliance. This is a four stage process. The stages in this process are Compliance And Legal, Legal Governance, Risk Management.
-
Unique design & color.
-
Very unique and reliable designs.
-
Excellent Designs.
-
Presentation Design is very nice, good work with the content as well.
-
Understandable and informative presentation.
-
Great experience, I would definitely use your services further.
-
Wonderful templates design to use in business meetings.
-
Awesome use of colors and designs in product templates.
-
Unique design & color.
-
Great product with effective design. Helped a lot in our corporate presentations. Easy to edit and stunning visuals.


