Ship kpi for turnaround time voyage deviation cargo damaged presentation slide
Create conditions for frequent gatherings with our Ship Kpi For Turnaround Time Voyage Deviation Cargo Damaged Presentation Slide. Increase the amount of interaction.
You must be logged in to download this presentation.
 Impress your
 audience
Editable
of Time
PowerPoint presentation slides
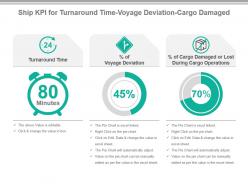
Presenting ship kpi for turnaround time voyage deviation cargo damaged presentation slide. This presentation slide shows three Key Performance Indicators or KPIs in a Dashboard style design. The first KPI that can be shown is Turnaround Time. The second KPI is percentage of Voyage Deviation and the third is percentage of Cargo Damaged or Lost During Cargo Operations. These KPI Powerpoint graphics are all data driven, and the shape automatically adjusts according to your data. Just right click on the KPI graphic, enter the right value and the shape will adjust automatically. Make a visual impact with our KPI slides.
People who downloaded this PowerPoint presentation also viewed the following :
Ship kpi for turnaround time voyage deviation cargo damaged presentation slide with all 6 slides:
Come across as extremely grounded with our Ship Kpi For Turnaround Time Voyage Deviation Cargo Damaged Presentation Slide. They will be encouraged to believe.
-
Helpful product design for delivering presentation.
-
Amazing product with appealing content and design.


