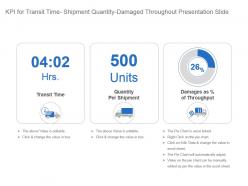
Kpi for transit time shipment quantity damaged throughout presentation slide
Get folks to deal with irreconcilable differences through our Kpi For Transit Time Shipment Quantity Damaged Throughout Presentation Slide. Bring an end to any animosity.
You must be logged in to download this presentation.
 Impress your
 audience
Editable
of Time
PowerPoint presentation slides
Presenting kpi for transit time shipment quantity damaged throughout presentation slide. This presentation slide shows three Key Performance Indicators or KPIs in a Dashboard style design. The first KPI that can be shown is Transit Time. The second KPI is Quantity Per Shipment and the third is Damages as percentage of Throughput. These KPI Powerpoint graphics are all data driven, and the shape automatically adjusts according to your data. Just right click on the KPI graphic, enter the right value and the shape will adjust automatically. Make a visual impact with our KPI slides.
People who downloaded this PowerPoint presentation also viewed the following :
Kpi for transit time shipment quantity damaged throughout presentation slide with all 6 slides:
Give in to the audience with our Kpi For Transit Time Shipment Quantity Damaged Throughout Presentation Slide. Answer their call for a bit of brilliance.
-
Great product with effective design. Helped a lot in our corporate presentations. Easy to edit and stunning visuals.
-
The content is very helpful from business point of view.


