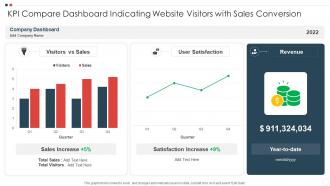
KPI Dashboard, Excel and Metrics PPT Templates
-
 New product performance evaluation product performance dashboards
The following slide displays the dashboard which highlights the performance of the product, multiple metrics such as Revenues, New customer, gross profit, customer satisfaction and global sales breakdown Present the topic in a bit more detail with this New Product Performance Evaluation Product Performance Dashboards. Use it as a tool for discussion and navigation on Product Performance Dashboards. This template is free to edit as deemed fit for your organization. Therefore download it now.
-
 Social media platform engagement kpi dashboard
Presenting our well structured Social Media Platform Engagement Kpi Dashboard. The topics discussed in this slide are Social Media Platform Engagement KPI Dashboard. This is an instantly available PowerPoint presentation that can be edited conveniently. Download it right away and captivate your audience.
-
 Cost benefits iot digital twins implementation dashboard depicting supply chain metrics
This slide depicts the dashboard that shows supply chain metrics that covers net sales, supply chain costs, average cash-to-cash cycle, carrying costs of inventory, etc. Deliver an outstanding presentation on the topic using this Cost Benefits Iot Digital Twins Implementation Dashboard Depicting Supply Chain Metrics. Dispense information and present a thorough explanation of Dashboard Depicting Supply Chain Metrics using the slides given. This template can be altered and personalized to fit your needs. It is also available for immediate download. So grab it now.
-
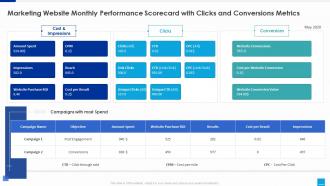 Marketing website marketing website monthly performance scorecard clicks conversions metrics
Present the topic in a bit more detail with this Marketing Website Marketing Website Monthly Performance Scorecard Clicks Conversions Metrics. Use it as a tool for discussion and navigation on Performance, Scorecard, Conversions. This template is free to edit as deemed fit for your organization. Therefore download it now.
-
 Scale out strategy for data inventory system action plan for organization data repository upgradation
This slide indicates the plan of action for the organization data repository expansion and optimization project providing information regarding multiple stages, time required, activities to perform, and key deliverables. Present the topic in a bit more detail with this Scale Out Strategy For Data Inventory System Action Plan For Organization Data Repository Upgradation. Use it as a tool for discussion and navigation on Planning, Organization, Requirements. This template is free to edit as deemed fit for your organization. Therefore download it now.
-
 Scale out strategy for data inventory system existing data repository performance metrics
This slide presents the information regarding organizations current data repository system performance metrices such as throughput rate, response time, count of open connections etc. Present the topic in a bit more detail with this Scale Out Strategy For Data Inventory System Existing Data Repository Performance Metrics. Use it as a tool for discussion and navigation on Performance, Database, Server. This template is free to edit as deemed fit for your organization. Therefore download it now.
-
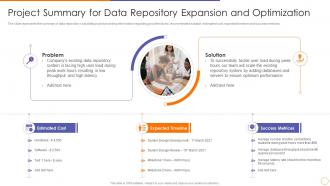 Scale out strategy for data inventory system project summary for data repository expansion and optimization
The slide represents the summary of data repository scalability project providing information regarding problem faced, recommended solution, estimated cost, expected timeline and success metrices. Introducing Scale Out Strategy For Data Inventory System Project Summary For Data Repository Expansion And Optimization to increase your presentation threshold. Encompassed with three stages, this template is a great option to educate and entice your audience. Dispence information on Expansion, Optimization, Performance, using this template. Grab it now to reap its full benefits.
-
 Company financial performance corporate program improving work team productivity
This slide highlights KPI dashboard exhibiting overall improvement in the financial performance of company as the consequences of program implementation. Deliver an outstanding presentation on the topic using this Company Financial Performance Corporate Program Improving Work Team Productivity. Dispense information and present a thorough explanation of Company Financial Performance Dashboard using the slides given. This template can be altered and personalized to fit your needs. It is also available for immediate download. So grab it now.
-
 Team kpi dashboard corporate program improving work team productivity
Following slide demonstrates team KPI dashboard for evaluating team performance based on parameters such as conflict resolution, projects completion, workload management, team motivation etc. Deliver an outstanding presentation on the topic using this Team Kpi Dashboard Corporate Program Improving Work Team Productivity. Dispense information and present a thorough explanation of Team KPI Dashboard using the slides given. This template can be altered and personalized to fit your needs. It is also available for immediate download. So grab it now.
-
 Real estate marketing dashboard ppt powerpoint presentation outline inspiration
This template covers KPI dashboard for real estate marketing plan including website visitors, page review, top referrals, traffic sources, email campaign etc. Deliver an outstanding presentation on the topic using this Real Estate Marketing Dashboard Ppt Powerpoint Presentation Outline Inspiration. Dispense information and present a thorough explanation of Real Estate Marketing Dashboard using the slides given. This template can be altered and personalized to fit your needs. It is also available for immediate download. So grab it now.
-
 Supplier performance management kpi vendor relationship management strategies
This slide covers supplier performance management KPI dashboards along with metrics such as suppliers availability, supplier ratings, suppliers defence rate and type etc. Deliver an outstanding presentation on the topic using this Supplier Performance Management KPI Vendor Relationship Management Strategies. Dispense information and present a thorough explanation of Supplier Direct Rate, Supplier Availability, Lead Time using the slides given. This template can be altered and personalized to fit your needs. It is also available for immediate download. So grab it now
-
 Campaign performance measuring kpi dashboard effective brand building strategy
Present the topic in a bit more detail with this Campaign Performance Measuring KPI Dashboard Effective Brand Building Strategy. Use it as a tool for discussion and navigation on Campaign Performance Measuring KPI DashboardFollowing slide covers campaign performance dashboard of the firm. It includes metrics such as total spend, total impressions, total clicks, total acquisitions and cost per acquisition. . This template is free to edit as deemed fit for your organization. Therefore download it now.
-
 Role of digital twin and iot dashboard depicting supply chain metrics
This slide depicts the dashboard that shows supply chain metrics that covers net sales, supply chain costs, average cash to cash cycle, carrying costs of inventory, etc. Present the topic in a bit more detail with this Role Of Digital Twin And Iot Dashboard Depicting Supply Chain Metrics. Use it as a tool for discussion and navigation on Dashboard Depicting Supply Chain Metrics. This template is free to edit as deemed fit for your organization. Therefore download it now.
-
 Kpi dashboard to track security risk events managing cyber risk in a digital age
This slide displays KPI dashboard that company will use to track multiple risk events. Metrics covered in the dashboard are residual risks by period and risk category by total risk rating. Deliver an outstanding presentation on the topic using this Kpi Dashboard To Track Security Risk Events Managing Cyber Risk In A Digital Age. Dispense information and present a thorough explanation of KPI Dashboard To Track Security Risk Events using the slides given. This template can be altered and personalized to fit your needs. It is also available for immediate download. So grab it now.
-
 Google SEO Analytics Major Metrics Traffic Bounce Rate Page Speed Landing Pages Custom Dashboards And More Edu Ppt
Presenting Google SEO Analytics Major Metrics, Traffic, Bounce Rate, Page Speed, Landing Pages, Custom Dashboards and more. Our PowerPoint experts have included all the necessary templates, designs, icons, graphs, and other essential material. This deck is well crafted by an extensive research. Slides consist of amazing visuals and appropriate content. These PPT slides can be instantly downloaded with just a click. Compatible with all screen types and monitors. Supports Google Slides. Premium Customer Support available. Suitable for use by managers, employees, and organizations. These slides are easily customizable. You can edit the color, text, icon, and font size to suit your requirements.
-
 Corporate KPI Dashboard Showing Bounce Rate With New Users Data
This graph or chart is linked to excel, and changes automatically based on data. Just left click on it and select Edit Data. Presenting our well structured Corporate KPI Dashboard Showing Bounce Rate With New Users Data. The topics discussed in this slide are New Sessions, Unique Pageviews, Time on Page, Bounce Rate, User Demographics, Visitor Statistics. This is an instantly available PowerPoint presentation that can be edited conveniently. Download it right away and captivate your audience.
-
 Hospital Performance Dashboard With KPI
This slide covers the dashboard of hospital KPI which includes monthly stays, quarterly admissions and readmission rate, average treatment costs with acquired infections, patients having private insurance, etc. Presenting our well structured Hospital Performance Dashboard With KPI. The topics discussed in this slide are Avg Length Of Stay, Avg Treatment Costs All Ages, Stays By Payer, Average Treatment Costs, Admissions And Readmission Rate, Hospital Acquired Infections, Length Of Stay. This is an instantly available PowerPoint presentation that can be edited conveniently. Download it right away and captivate your audience.
-
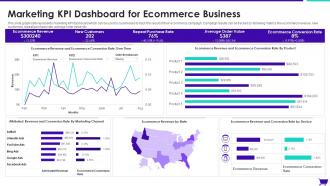 Marketing KPI Dashboard For Ecommerce Business
This slide graphically represents marketing KPI dashboard which can be used by businesses to track the result of their ecommerce campaign. Campaign results can be tracked by following metrics like ecommerce revenue, new customers, repeat purchase rate, average order value etc. Introducing our Marketing KPI Dashboard For Ecommerce Business set of slides. The topics discussed in these slides are Average, Purchase Rate, Customers. This is an immediately available PowerPoint presentation that can be conveniently customized. Download it and convince your audience.
-
 Kpi Dashboard For Tracking Supply Chain Costs Industry Report For Food Manufacturing Sector
This slide represents the KPI Dashboard to track the Multiple Cost Associated with Supply Chain in Food Manufacturing Industry. It includes information regarding Cash to Cash Cycle in days, Carry Cost of Inventory along with details of Net Sales. Present the topic in a bit more detail with this Kpi Dashboard For Tracking Supply Chain Costs Industry Report For Food Manufacturing Sector. Use it as a tool for discussion and navigation on Carrying Costs Of Inventory, Cash To Cash Cycle, Supply Chain Costs. This template is free to edit as deemed fit for your organization. Therefore download it now.
-
 Digital Marketing KPI Dashboard With Conversion And Bounce Rate
The following slide showcases a comprehensive marketing KPI dashboard. Marketers can monitor and optimize the campaign performance after tracking metrics such as total sessions, conversion rate, average time spent on site, bounce rate etc. Presenting our well structured Digital Marketing KPI Dashboard With Conversion And Bounce Rate. The topics discussed in this slide are Today Lead By Program, Lead Breakdown, Today Lead By Program. This is an instantly available PowerPoint presentation that can be edited conveniently. Download it right away and captivate your audience.
-
 Digital Marketing KPI Dashboard Snapshot With Engagement Rate
The following slide showcases a comprehensive KPI dashboard which allows the company to track the digital marketing performance. Total visits, cost per click, engagement rate, total impressions, product sales trend, revenue by various channels are some of the key metrics mentioned in the slide. Introducing our Digital Marketing KPI Dashboard Snapshot With Engagement Rate set of slides. The topics discussed in these slides are Product Sales Trend, Revenue By Channel, Top Website Referral Channels, Website Demographics, Engagement Rate, Impressions Total. This is an immediately available PowerPoint presentation that can be conveniently customized. Download it and convince your audience.
-
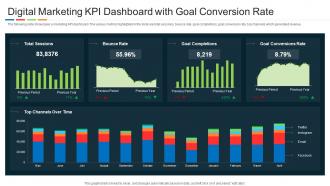 Digital Marketing KPI Dashboard With Goal Conversion Rate
The following slide showcases a marketing KPI dashboard. The various metrics highlighted in the slide are total sessions, bounce rate, goal completions, goal conversion rate, top channels which generated revenue. Presenting our well structured Digital Marketing KPI Dashboard With Goal Conversion Rate. The topics discussed in this slide are Total Sessions, Bounce Rate, Goal Completions, Goal Conversions Rate, Top Channels Over Time. This is an instantly available PowerPoint presentation that can be edited conveniently. Download it right away and captivate your audience.
-
 Email Marketing Kpi Dashboard With Bounce Rate
The following slide showcases KPI dashboard which allows marketers to track the email marketing campaign performance. Information covered in this slide is related to total subscribers, types of email sent, open, clicks, bounces and unsubscribed etc. Introducing our Email Marketing KPI Dashboard With Bounce Rate set of slides. The topics discussed in these slides are Direct Sessions, Organic Sessions, Paid Sessions, Referral Session. This is an immediately available PowerPoint presentation that can be conveniently customized. Download it and convince your audience.
-
 KPI Dashboard Highlighting Results Of SEO Campaign
The following slide showcases marketing KPI dashboard which shows the performance measuring metrics of SEO campaign. The metrics covered in the slide are most viewed pages from SEO, most search engines used, traffic type, top known keywords etc. Presenting our well structured KPI Dashboard Highlighting Results Of SEO Campaign. The topics discussed in this slide are Total Visits From SEO, Main Search Engines Used, Traffic Type, Most Viewed Pages From SEO. This is an instantly available PowerPoint presentation that can be edited conveniently. Download it right away and captivate your audience.
-
 KPI Dashboard To Analyze Social Media Marketing Campaign Performance
The following slide showcases KPI dashboard which can be used by marketing manager to track social media performance. The metrics covered in the slide are YouTube channel views, LinkedIn clicks, likes and shares, Facebook daily reach etc. Presenting our well structured KPI Dashboard To Analyze Social Media Marketing Campaign Performance. The topics discussed in this slide are Linkedin Shares, Facebook Daily Reach 90 Days, Key Statistics, Instagram Overview. This is an instantly available PowerPoint presentation that can be edited conveniently. Download it right away and captivate your audience.
-
 Marketing KPI Dashboard With Cost Per Click
The following slide showcases a comprehensive KPI dashboard used to analyze the pay per click advertising performance. The KPIs covered in the slide are total ad cost, total clicks, impressions, cost per conversion, conversion rate, cost per click etc. Presenting our well structured Marketing KPI Dashboard With Cost Per Click. The topics discussed in this slide are Clicks Impression, Click Though Rate, Conversion Rate, Cost Per, Click, Cost Per, Thousand Impressop. This is an instantly available PowerPoint presentation that can be edited conveniently. Download it right away and captivate your audience.
-
 Performance KPI Dashboard Showing Results Of Pay Per Click Marketing
The following slide showcases online marketing KPI dashboard which will assist companies to effectively monitor the performance of pay per click campaign. The metrics highlighted in the slide are total impressions, clicks, conversions, costs, click through rate etc. Presenting our well structured Performance KPI Dashboard Showing Results Of Pay Per Click Marketing. The topics discussed in this slide are Impressions, Clicks, Conversions, Costs, Cost Per Conversion, Conversion Ratio, CPC. This is an instantly available PowerPoint presentation that can be edited conveniently. Download it right away and captivate your audience.
-
 Social Media Playbook Kpi Analytics Measurement
This template covers key performance indicator KPI to determine the performance against the company objectives. These Social media KPIs would be focusing on social engagements, content reach, purchase leads and conversions. Deliver an outstanding presentation on the topic using this Social Media Playbook Kpi Analytics Measurement. Dispense information and present a thorough explanation of Analytics, Measurement, Performance using the slides given. This template can be altered and personalized to fit your needs. It is also available for immediate download. So grab it now.
-
 Warehouse Management Inventory Control Comparison Between Warehouses
The slide provides information regarding performance comparison of two warehouses. The comparison is done based on usage of warehouse management system on parameters such as pick accuracy, appointment scheduling. Present the topic in a bit more detail with this Warehouse Management Inventory Control Comparison Between Warehouses. Use it as a tool for discussion and navigation on Performance Metrics, Management, System. This template is free to edit as deemed fit for your organization. Therefore download it now.
-
 Warehouse Management Inventory Control Determine Warehouse Performance Metrics
The slide demonstrates information regarding the warehouse performance metrics that firm will use in order to analyze firms performance in handling warehouse, inventory. Present the topic in a bit more detail with this Warehouse Management Inventory Control Determine Warehouse Performance Metrics. Use it as a tool for discussion and navigation on Order Fulfillment, Inventory Management, Warehouse Productivity. This template is free to edit as deemed fit for your organization. Therefore download it now.
-
 High Fuel Costs Logistics Company Key Performance Indicators Of XYZ Logistics Company
The slide shows the key Performance Indicator KPIs which will help the company to track the success rate of implemented strategies. Some of the KPIs are On Time Shipping, Customer Back Order Rate, Inventory Turnover Ratio, Number Of Shipments, Average Cycle Time in Days, On Time Delivery etc. Deliver an outstanding presentation on the topic using this High Fuel Costs Logistics Company Key Performance Indicators Of XYZ Logistics Company. Dispense information and present a thorough explanation of Company Revenue, Transportation Costs, Customer using the slides given. This template can be altered and personalized to fit your needs. It is also available for immediate download. So grab it now.
-
 Digital Marketing Process With Customer Painpoints
This slide exhibits digital marketing process with customer painpoints which can be referred by marketers to create new campaigns focusing on catering to customer needs. It contains information about brand strategy, digital marketing plan, values and key performance indicators KPIs. Presenting our set of slides with Digital Marketing Process With Customer Painpoints. This exhibits information on three stages of the process. This is an easy to edit and innovatively designed PowerPoint template. So download immediately and highlight information on Brand Strategy, Digital Marketing Plan, Target, Prices.
-
 Major SEO Metrics Analyzed By Google Analytics Edu Ppt
Presenting Major SEO Metrics analyzed by Google Analytics. These slides are 100 percent made in PowerPoint and are compatible with all screen types and monitors. They also support Google Slides. Premium Customer Support available. Suitable for use by managers, employees, and organizations. These slides are easily customizable. You can edit the color, text, icon, and font size to suit your requirements.
-
 Comparing Hospital Metrics With Competitors Healthcare Inventory Management System
This slide shows the comparison of hospital metrics with competitors such as average length of patient stay, time to service, patient satisfaction, physician performance, patient readmission rate, operating margin, etc.Deliver an outstanding presentation on the topic using this Comparing Hospital Metrics With Competitors Healthcare Inventory Management System Dispense information and present a thorough explanation of Patient Satisfaction, Physician Performance, Patient Readmission using the slides given. This template can be altered and personalized to fit your needs. It is also available for immediate download. So grab it now.
-
 Hospital Discharge Summary Of Patient Healthcare Inventory Management System
This slide shows the hospital discharge summary of patient that covers patient name, medical record number, admission and discharge rate, patient history, medications and instructions.Present the topic in a bit more detail with this Hospital Discharge Summary Of Patient Healthcare Inventory Management System Use it as a tool for discussion and navigation on Dashboards And Metrics, Impact Of Improving, Costs Involved In Improving This template is free to edit as deemed fit for your organization. Therefore download it now.
-
 Metrics To Measure Impact Of Improving Healthcare Inventory Management System
This slide covers the metrics to measure impact of improving hospital management system such as medication errors, patient wait time, overall patient satisfaction, time to receive medical bill, etc.Present the topic in a bit more detail with this Metrics To Measure Impact Of Improving Healthcare Inventory Management System Use it as a tool for discussion and navigation on Reason For Hospitalization, Provided Procedures And Treatments, Patient And Family Instruction This template is free to edit as deemed fit for your organization. Therefore download it now.
-
 Healthcare Project Management KPI Tracking Sheet
Introducing our Healthcare Project Management KPI Tracking Sheet set of slides. The topics discussed in these slides are Healthcare Project Management KPI Tracking Sheet. This is an immediately available PowerPoint presentation that can be conveniently customized. Download it and convince your audience.
-
 Social Media Marketing Communication Funnel
This slide displays the funnel for marketing the product or services through social media and engage audience to sale more quantity. It also includes channels, activities and metrics of social media. Presenting our set of slides with Social Media Marketing Communication Funnel. This exhibits information on three stages of the process. This is an easy to edit and innovatively designed PowerPoint template. So download immediately and highlight information on Brand Awareness, Engagement, Action.
-
 Email Marketing Dashboard Illustrating Campaign Performance Results
Mentioned slide displays email campaign dashboard which can be used by marketers to track performance of their marketing campaigns. Marketers can track metrics such as total subscribers growth, overall bounce rate, unsubscribe rate, open rate, click rate etc. Presenting our well structured Email Marketing Dashboard Illustrating Campaign Performance Results. The topics discussed in this slide are Email Marketing Dashboard Illustrating Campaign Performance Results. This is an instantly available PowerPoint presentation that can be edited conveniently. Download it right away and captivate your audience
-
 Kpi Dashboard Highlighting The Results Of Email Marketing Strategy
This slide exhibits a comprehensive dashboard showing the email marketing strategy results. It contains information about various metrics such as total emails sent, successful deliveries, abuse reports, comparison between click rate and open rate, investment and revenue performance of marketing campaigns etc. Presenting our well structured KPI Dashboard Highlighting The Results Of Email Marketing Strategy. The topics discussed in this slide are Investment, Revenue Performance, Marketing Campaigns. This is an instantly available PowerPoint presentation that can be edited conveniently. Download it right away and captivate your audience
-
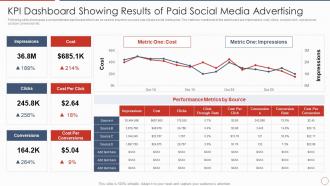 KPI Dashboard Showing Results Of Paid Social Media Advertising
Following slide showcases a comprehensive dashboard which can be used to examine success rate of paid social media plan. The metrices mentioned in the dashboard are impressions, cost, clicks, cost per click, conversions, cost per conversion etc. Presenting our well structured KPI Dashboard Showing Results Of Paid Social Media Advertising. The topics discussed in this slide are KPI Dashboard Showing Results Of Paid Social Media Advertising. This is an instantly available PowerPoint presentation that can be edited conveniently. Download it right away and captivate your audience.
-
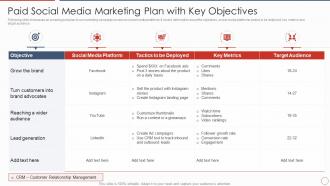 Paid Social Media Marketing Plan With Key Objectives
Following slide showcases an amazing paid plan to run marketing campaign on various social media platforms. It covers information about the objectives, social media platforms, tactics to be deployed, key metrics and target audience. Presenting our well structured Paid Social Media Marketing Plan With Key Objectives. The topics discussed in this slide are Target Audience, Key Metrics, Social Media Platform. This is an instantly available PowerPoint presentation that can be edited conveniently. Download it right away and captivate your audience.
-
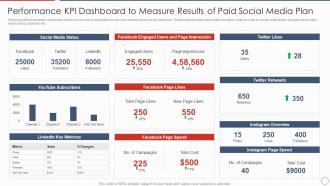 Performance KPI Dashboard To Measure Results Of Paid Social Media Plan
Following slide showcases a dashboard which can be used by organization to track the results of paid social media plan. The template provides information about key metrices such as social media status, engaged users, page impressions, page likes etc. Presenting our well structured Performance KPI Dashboard To Measure Results Of Paid Social Media Plan. The topics discussed in this slide are Performance KPI Dashboard To Measure Results Of Paid Social Media Plan. This is an instantly available PowerPoint presentation that can be edited conveniently. Download it right away and captivate your audience.
-
 Digital Marketing Key Performance Indicator Framework
This slide outlines relevant information about digital marketing key performance indicator framework. It includes different stages of brand journey such as reach, act, convert and engage along with kips, indicators and segments. Presenting our well structured Digital Marketing Key Performance Indicator Framework. The topics discussed in this slide are Digital Objective, Stages Of Brand Journey, Segments. This is an instantly available PowerPoint presentation that can be edited conveniently. Download it right away and captivate your audience.
-
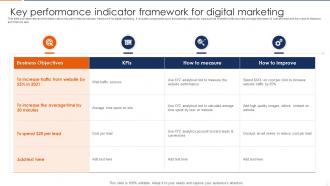 Key Performance Indicator Framework For Digital Marketing
This slide provides relevant information about key performance indicator framework for digital marketing. It includes components such as business objectives, kips such as website traffic sources, average time spent and cost per lead and the ways to measure and improve kips. Introducing our Key Performance Indicator Framework For Digital Marketing set of slides. The topics discussed in these slides are Business Objectives, Traffic Sources, Average Time. This is an immediately available PowerPoint presentation that can be conveniently customized. Download it and convince your audience.
-
 Key Performance Indicator Framework For Healthcare Industry
The following slide illustrates the key performance indicator framework for healthcare industry such as operational, financial and public healthcare. All indicators plays a crucial part in determining the success of healthcare industry. Introducing our Key Performance Indicator Framework For Healthcare Industry set of slides. The topics discussed in these slides are Operational, Public Healthcare, Financial. This is an immediately available PowerPoint presentation that can be conveniently customized. Download it and convince your audience.
-
 Key Performance Indicator Framework For Retail Business
The following slide shows the key performance indicator Framework for tracking retail business. This includes metrics like sales, stock and customer. All metrics are affected by the growth of retail sector. Introducing our premium set of slides with Key Performance Indicator Framework For Retail Business. Ellicudate the three stages and present information using this PPT slide. This is a completely adaptable PowerPoint template design that can be used to interpret topics like Total Sales, Inventory Management, Customer Metrics. So download instantly and tailor it with your information.
-
 Reducing Cost Of Operations Through Iot And Dashboard Depicting Supply Chain Metrics
This slide depicts the dashboard that shows supply chain metrics that covers net sales, supply chain costs, average cash-to-cash cycle, carrying costs of inventory, etc. Deliver an outstanding presentation on the topic using this Reducing Cost Of Operations Through Iot And Dashboard Depicting Supply Chain Metrics. Dispense information and present a thorough explanation of Dashboard Depicting Supply Chain Metrics using the slides given. This template can be altered and personalized to fit your needs. It is also available for immediate download. So grab it now.
-
 Social Marketing Of Product In Sales Organization
This slide represents the social marketing strategy for product sales in an organization illustrating customer journey, objectives, social media strategy, social activity, social KPI, and business impact. Presenting our well structured Social Marketing Of Product In Sales Organization. The topics discussed in this slide are Awareness, Consideration, Decision. This is an instantly available PowerPoint presentation that can be edited conveniently. Download it right away and captivate your audience.
-
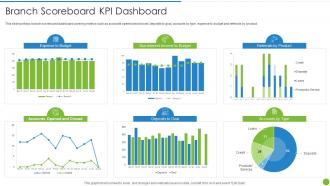 Offering Digital Financial Facility To Existing Customers Branch Scoreboard Kpi Dashboard
This slide portrays branch scoreboard dashboard covering metrics such as accounts opened and closed, deposits to goal, accounts by type, expense to budget and referrals by product. Present the topic in a bit more detail with this Offering Digital Financial Facility To Existing Customers Branch Scoreboard Kpi Dashboard. Use it as a tool for discussion and navigation on Branch Scoreboard Kpi Dashboard. This template is free to edit as deemed fit for your organization. Therefore download it now.
-
 Kpi Dashboard For Tracking Business AI Playbook Accelerate Digital Transformation
Mentioned slide portrays KPI dashboard that can be used by organizations to measure their business performance post AI introduction. KPIS covered here are progress, Before versus After AI Implementation, risks and issues. Present the topic in a bit more detail with this Kpi Dashboard For Tracking Business AI Playbook Accelerate Digital Transformation . Use it as a tool for discussion and navigation on KPI Dashboard For Tracking Business Performance . This template is free to edit as deemed fit for your organization. Therefore download it now.
-
 Supplier Performance Management KPI Dashboards Ppt Powerpoint Presentation Layouts
This slide covers supplier performance management KPI dashboards along with metrics such as suppliers availability, supplier ratings, suppliers defence rate and type etc. Present the topic in a bit more detail with this Supplier Performance Management KPI Dashboards Ppt Powerpoint Presentation Layouts. Use it as a tool for discussion and navigation on Supplier Ratings, Supplier Availability, Supplier Direct Rate. This template is free to edit as deemed fit for your organization. Therefore download it now.
-
 Website Statistics Powerpoint Ppt Template Bundles
Engage buyer personas and boost brand awareness by pitching yourself using this prefabricated set. This Website Statistics Powerpoint Ppt Template Bundles is a great tool to connect with your audience as it contains high-quality content and graphics. This helps in conveying your thoughts in a well-structured manner. It also helps you attain a competitive advantage because of its unique design and aesthetics. In addition to this, you can use this PPT design to portray information and educate your audience on various topics. With sixteen slides, this is a great design to use for your upcoming presentations. Not only is it cost-effective but also easily pliable depending on your needs and requirements. As such color, font, or any other design component can be altered. It is also available for immediate download in different formats such as PNG, JPG, etc. So, without any further ado, download it now.
-
 Monthly Report Of Email Marketing Campaign Results
The purpose of this slide is to showcase results of email marketing campaign. Open rate, click-through rate, conversion rate, bounce rate and number of unsubscribes are the key metrics which will assist company to measure the performance of email marketing. Introducing our Monthly Report Of Email Marketing Campaign Results set of slides. The topics discussed in these slides are Monthly Report Of Email Marketing Campaign Results. This is an immediately available PowerPoint presentation that can be conveniently customized. Download it and convince your audience.
-
 Performance Kpi Dashboard Highlighting Marketing Campaign Results
The purpose of this slide is to highlight results of marketing campaign through KPI dashboard. It provides information about total revenue generated, marketing expenditure, profit, cost per acquisition by different channels, return on investment etc. Presenting our well-structured Performance Kpi Dashboard Highlighting Marketing Campaign Results. The topics discussed in this slide are Performance, Dashboard, Highlighting, Marketing. This is an instantly available PowerPoint presentation that can be edited conveniently. Download it right away and captivate your audience.
-
 Social Media Marketing Results With Kpi Scorecard
The purpose of this slide is to outline the results of different social media marketing channels through KPIs. Followers, impressions, link counts, engagement rate, average order value are some of the key KPIs which are used to measure the marketing results. Presenting our well-structured Social Media Marketing Results With Kpi Scorecard. The topics discussed in this slide are Social Media Marketing Results With KPI Scorecard. This is an instantly available PowerPoint presentation that can be edited conveniently. Download it right away and captivate your audience.
-
 4 Week Roadmap For Website Statistics Improvement
This slide showcases roadmap for website statistics improvement that can help to decide the weekly milestones to enhance the website performance metrics and visitors experience. Its key steps are - measure website statistics, leverage strategies, measure progress and review progress regularly. Presenting our set of slides with name 4 Week Roadmap For Website Statistics Improvement. This exhibits information on four stages of the process. This is an easy-to-edit and innovatively designed PowerPoint template. So download immediately and highlight information on Leverage Strategiesreview Progress Regularly, Measure Progress, Website Statistics.
-
 Website Statistics By Social Media Platforms With Improvement Strategies
This slide showcases website statistics assessment that can help to invest the advertisement money in platform that is generating maximum amount of traffic. Its key metrics are total traffic from platform, unique visitors from platform, avg session duration of platform user and conversion rate from platform. Introducing our Website Statistics By Social Media Platforms With Improvement Strategies set of slides. The topics discussed in these slides are Improvement, Strategies, Statistics. This is an immediately available PowerPoint presentation that can be conveniently customized. Download it and convince your audience.
-
 Website Statistics Yearly Comparison With Percentage Change
This slide showcases yearly comparison table that can help organization to identify the change in current year website statistics as compared to previous year. Its key metrics are total traffic, conversion rate, pages or session, pageviews and bounce rate Introducing our Website Statistics Yearly Comparison With Percentage Change set of slides. The topics discussed in these slides are Statistics, Comparison, Percentage. This is an immediately available PowerPoint presentation that can be conveniently customized. Download it and convince your audience.
-
Very well designed and informative templates.
-
Great quality slides in rapid time.
-
Excellent design and quick turnaround.
-
Designs have enough space to add content.
-
Graphics are very appealing to eyes.
-
Best Representation of topics, really appreciable.
-
Thanks for all your great templates they have saved me lots of time and accelerate my presentations. Great product, keep them up!
-
Great quality slides in rapid time.
-
Appreciate the research and its presentable format.
-
Content of slide is easy to understand and edit.


