Powerpoint Templates and Google slides for Operational Dashboards
Save Your Time and attract your audience with our fully editable PPT Templates and Slides.
-
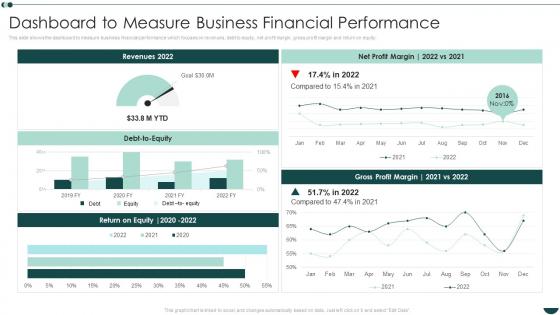 Dashboard To Measure Business Financial Performance Business Process Reengineering Operational Efficiency
This slide shows the dashboard to measure business financial performance which focuses on revenues, debt to equity, net profit margin, gross profit margin and return on equity. Deliver an outstanding presentation on the topic using this Dashboard To Measure Business Financial Performance Business Process Reengineering Operational Efficiency. Dispense information and present a thorough explanation of Business, Financial, Performance using the slides given. This template can be altered and personalized to fit your needs. It is also available for immediate download. So grab it now.
-
 Logistics Iot Fleet Management Dashboard Deploying Internet Logistics Efficient Operations
This slide showcases logistics internet of things IoT fleet management dashboard. It provides information about gas usage, electric usage, messages, settings, sound volume, weather, etc. Present the topic in a bit more detail with this Logistics Iot Fleet Management Dashboard Deploying Internet Logistics Efficient Operations. Use it as a tool for discussion and navigation on Management, Dashboard, Information. This template is free to edit as deemed fit for your organization. Therefore download it now.
-
 Hr Talent Management Key Metrics Dashboard Snapshot Implementing Business Enhancing Hr Operation
This slide represents the KPI dashboard snapshot to track and monitor management of talent by the HR department. It includes details related to talent satisfaction, talent turnover rate, fired talents etc. Deliver an outstanding presentation on the topic using this Hr Talent Management Key Metrics Dashboard Implementing Business Enhancing Hr Operation. Dispense information and present a thorough explanation of Management, Dashboard, Satisfaction using the slides given. This template can be altered and personalized to fit your needs. It is also available for immediate download. So grab it now.
-
 Implementing Business Enhancing Hr Operation Employee Engagement Key Performance Metrics Dashboard
This slide represents key metrics dashboard to analyze the engagement of employees in the organization. It includes details related to KPIs such as engagement score, response rate, net promoter score etc. Deliver an outstanding presentation on the topic using this Implementing Business Enhancing Hr Operation Employee Engagement Key Performance Metrics Dashboard. Dispense information and present a thorough explanation of Performance, Dashboard, Engagement using the slides given. This template can be altered and personalized to fit your needs. It is also available for immediate download. So grab it now.
-
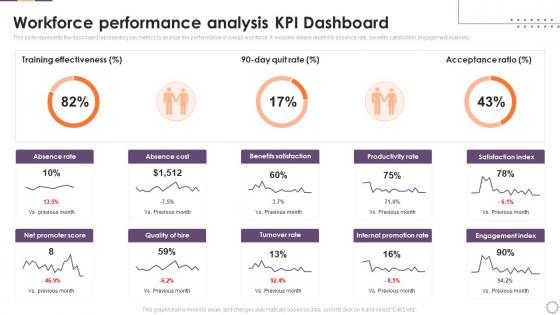 Implementing Business Enhancing Hr Operation Workforce Performance Analysis Kpi Dashboard
This slide represents the dashboard representing key metrics to analyze the performance of overall workforce. It includes details related to absence rate, benefits satisfaction, engagement index etc. Deliver an outstanding presentation on the topic using this Implementing Business Enhancing Hr Operation Workforce Performance Analysis Kpi Dashboard. Dispense information and present a thorough explanation of Workforce, Performance, Analysis using the slides given. This template can be altered and personalized to fit your needs. It is also available for immediate download. So grab it now.
-
 Marketing Operational Excellence KPI Dashboard
This slide shows marketing KPIs dashboard for operational excellence of an organization. It includes metrics such as total spending, total clicks, cost per acquisition, and campaigns Introducing our Marketing Operational Excellence KPI Dashboard set of slides. The topics discussed in these slides are Marketing, Operational Excellence, KPI Dashboard. This is an immediately available PowerPoint presentation that can be conveniently customized. Download it and convince your audience.
-
 Key Business Metrics Dashboard Blueprint To Optimize Business Operations And Increase Revenues
The following dashboard displays the key business metrics such as new customers, profit, revenue per customer, and weekly revenue. Deliver an outstanding presentation on the topic using this Key Business Metrics Dashboard Blueprint To Optimize Business Operations And Increase Revenues. Dispense information and present a thorough explanation of Business, Dashboard, Revenue using the slides given. This template can be altered and personalized to fit your needs. It is also available for immediate download. So grab it now.
-
 Banking Operation Strategy Dashboard Highlighting Operational Process Management In The Banking
This slide highlights the banking operation strategy dashboard which showcases current account and saving account growth rate, savings account deposits, current account deposits and retail term deposits. Deliver an outstanding presentation on the topic using this Banking Operation Strategy Dashboard Highlighting Operational Process Management In The Banking. Dispense information and present a thorough explanation of Operation, Strategy, Dashboard using the slides given. This template can be altered and personalized to fit your needs. It is also available for immediate download. So grab it now.
-
 Operational Process Management In The Banking Banking Operation Strategy Dashboard Highlighting
This slide highlights the banking operation strategy which includes accounts opened and closed, total deposit vs branch goal, accounts by type, expense to budget and referrals by product. Present the topic in a bit more detail with this Operational Process Management In The Banking Banking Operation Strategy Dashboard Highlighting. Use it as a tool for discussion and navigation on Operation, Strategy, Dashboard. This template is free to edit as deemed fit for your organization. Therefore download it now.
-
 Banking Operation Strategy Dashboard Highlighting Deposits Operational Transformation Banking Model
This slide highlights the banking operation strategy dashboard which showcases current account and saving account growth rate, savings account deposits, current account deposits and retail term deposits. Deliver an outstanding presentation on the topic using this Banking Operation Strategy Dashboard Highlighting Deposits Operational Transformation Banking Model. Dispense information and present a thorough explanation of Operation, Strategy, Dashboard using the slides given. This template can be altered and personalized to fit your needs. It is also available for immediate download. So grab it now.
-
 Operational Transformation Banking Model Banking Operation Strategy Dashboard Highlighting Accounts
This slide highlights the banking operation strategy which includes accounts opened and closed, total deposit vs branch goal, accounts by type, expense to budget and referrals by product. Deliver an outstanding presentation on the topic using this Operational Transformation Banking Model Banking Operation Strategy Dashboard Highlighting Accounts. Dispense information and present a thorough explanation of Operation, Strategy, Dashboard using the slides given. This template can be altered and personalized to fit your needs. It is also available for immediate download. So grab it now.
-
 Vendor Risk Assessment And Headcount Dashboard Managing Suppliers Effectively Purchase Supply Operations
The following slide showcases vendor risk assessment and headcount dashboard. It provides information about vendor onboarding, high risk vendors, vendor spend, active vendors, vendor risk rating, etc Deliver an outstanding presentation on the topic using this Vendor Risk Assessment And Headcount Dashboard Managing Suppliers Effectively Purchase Supply Operations. Dispense information and present a thorough explanation of Assessment, Headcount, Dashboard using the slides given. This template can be altered and personalized to fit your needs. It is also available for immediate download. So grab it now.
-
 Sales Operation E Commerce Business Dashboard
This slide showcase sales and operations dashboard for e commerce business. It involves total sales, total orders, profit and loss statement, average product value, sales by reference, sales by reference that help in tracking growth of product in market and also for analyzing organization market share. Presenting our well structured Sales Operation E Commerce Business Dashboard. The topics discussed in this slide are Sales By Location, Product Value, Business Dashboard. This is an instantly available PowerPoint presentation that can be edited conveniently. Download it right away and captivate your audience.
-
 Digital Marketing Dashboard For Organic Growth Playbook Driving Growth From Internal Operations
Present the topic in a bit more detail with this Digital Marketing Dashboard For Organic Growth Playbook Driving Growth From Internal Operations. Use it as a tool for discussion and navigation on Digital Marketing, Organic Growth Playbook. This template is free to edit as deemed fit for your organization. Therefore download it now.
-
 IT Operations Dashboard For Project Management
This slide focuses on dashboard that provides information about the information technology operations for managing IT project which covers the investments, billed amount, time taken to complete the project, customer satisfaction, monthly expenses, service level agreement status, etc. Presenting our well structured IT Operations Dashboard For Project Management. The topics discussed in this slide are IT Operations Dashboard, For Project Management. This is an instantly available PowerPoint presentation that can be edited conveniently. Download it right away and captivate your audience.
-
 Retail Store Employee Engagement Dashboards Analysis Of Retail Store Operations Efficiency
This slide represents the dashboard to showcase retail stores employee engagement score teamwise, hierarchy levels wise. It also provides details of score on multiple engagement dimensions such as work life balance, salary, growth opportunities etc. Present the topic in a bit more detail with this Retail Store Employee Engagement Dashboards Analysis Of Retail Store Operations Efficiency. Use it as a tool for discussion and navigation on Retail Store Employee, Engagement Dashboards. This template is free to edit as deemed fit for your organization. Therefore download it now.
-
 Sales Dashboards For Retail Store Analysis Of Retail Store Operations Efficiency
This slide illustrates the dashboard retail store sales forecasting providing information regarding sales per employee, price unit every transaction, total number of customers and average value of customer transaction. Deliver an outstanding presentation on the topic using this Sales Dashboards For Retail Store Analysis Of Retail Store Operations Efficiency. Dispense information and present a thorough explanation of Sales Dashboards, For Retail Store using the slides given. This template can be altered and personalized to fit your needs. It is also available for immediate download. So grab it now.
-
 Social Media Dashboards For Retail Store Analysis Of Retail Store Operations Efficiency
This slide showcase dashboard for retail store social media channels performance in terms of reach, new fans, engagement, shares, likes, comments etc. Deliver an outstanding presentation on the topic using this Social Media Dashboards For Retail Store Analysis Of Retail Store Operations Efficiency. Dispense information and present a thorough explanation of Social Media Dashboards, For Retail Store using the slides given. This template can be altered and personalized to fit your needs. It is also available for immediate download. So grab it now.
-
 Dashboard For Business Operational Activities Management
This slide represents dashboard for management of business operational activities. It includes marketing, product, human resource, sales, finance, services and support. Presenting our well structured Dashboard For Business Operational Activities Management. The topics discussed in this slide are Dashboard, Business Operational, Activities Management. This is an instantly available PowerPoint presentation that can be edited conveniently. Download it right away and captivate your audience.
-
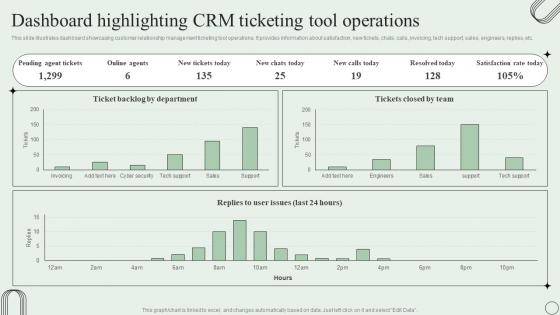 Dashboard Highlighting CRM Ticketing Tool Operations Revamping Ticket Management System
This slide illustrates dashboard showcasing customer relationship management ticketing tool operations. It provides information about satisfaction, new tickets, chats, calls, invoicing, tech support, sales, engineers, replies, etc. Deliver an outstanding presentation on the topic using this Dashboard Highlighting CRM Ticketing Tool Operations Revamping Ticket Management System. Dispense information and present a thorough explanation of Pending Agent Tickets, Online Agents, Satisfaction Rate using the slides given. This template can be altered and personalized to fit your needs. It is also available for immediate download. So grab it now.
-
 IT Department Operational Issues Analytics Dashboard
This slide represents the dashboard showing operational analysis of issues faced by the IT team of the organization. It shows data related to uptime and downtime of servers, downtime issues, IT support employee per thousand end user over time etc. Introducing our IT Department Operational Issues Analytics Dashboard set of slides. The topics discussed in these slides are Support Employee, Downtime Server, Count Percentage. This is an immediately available PowerPoint presentation that can be conveniently customized. Download it and convince your audience.
-
 IT Operational Analytics With Tickets Management Dashboard
This slide represents the dashboard showing analysis report of tickets management by the IT support service team. It shows details related to no. of support requests, average hours spent to resolve issues, support status, total resolved and unresolved tickets by month etc. Introducing our IT Operational Analytics With Tickets Management Dashboard set of slides. The topics discussed in these slides are Resolve Issue, Ticket Resolved, Support Status. This is an immediately available PowerPoint presentation that can be conveniently customized. Download it and convince your audience.
-
 IT Project Change Management Operations Analytics Dashboard
This slide shows the dashboard representing the operational analysis related to change management of an IT project. It shows details related to top requesting groups, outstanding change requests, outstanding age breakdown etc. Presenting our well structured IT Project Change Management Operations Analytics Dashboard. The topics discussed in this slide are Untheorized Change, Outstanding Requests, Monthly Breakdown. This is an instantly available PowerPoint presentation that can be edited conveniently. Download it right away and captivate your audience.
-
 IT Project Operational Analytics And Performance Dashboard
This slide represents the dashboard showing the operational analysis of an IT project. It includes details related to bugs status, planned vs completed work items, work item type by priority, active bugs by severity, sprint velocity and analysis by assignee. Introducing our IT Project Operational Analytics And Performance Dashboard set of slides. The topics discussed in these slides are Work Item Type, Active Bugs Severity, Sprint Velocity. This is an immediately available PowerPoint presentation that can be conveniently customized. Download it and convince your audience.
-
 IT Software Development Project Operational Analytics Dashboard
This slide represents the dashboard showing the operational analysis of the software development project undertaken by the IT team. It shows details related to overall progress, planning, design, development, testing, risks, budget, overdue tasks etc. related to the project. Presenting our well structured IT Software Development Project Operational Analytics Dashboard. The topics discussed in this slide are Overdue Tasks, Upcoming Deadlines, Project Budget. This is an instantly available PowerPoint presentation that can be edited conveniently. Download it right away and captivate your audience.
-
 IT Team Project Operational Analytics Dashboard
This slide represents the dashboard showing the operational analysis of the team project of the IT department. It shows details related to investment, billed amount, completion of project, revenue by month, total days spent on project completion, customer satisfaction etc. Introducing our IT Team Project Operational Analytics Dashboard set of slides. The topics discussed in these slides are Complete Each Project, Customer Satisfaction, Monthly Expenses. This is an immediately available PowerPoint presentation that can be conveniently customized. Download it and convince your audience.
-
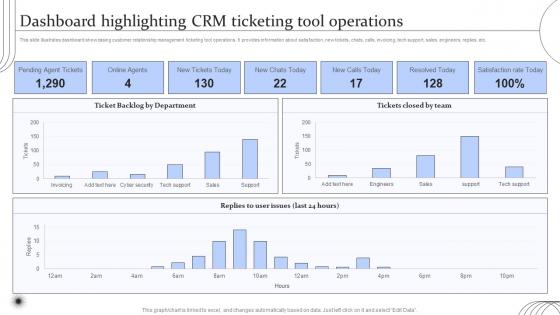 Digital Transformation Of Help Desk Management Dashboard Highlighting CRM Ticketing Tool Operations
This slide illustrates dashboard showcasing customer relationship management ticketing tool operations. It provides information about satisfaction, new tickets, chats, calls, invoicing, tech support, sales, engineers, replies, etc. Present the topic in a bit more detail with this Digital Transformation Of Help Desk Management Dashboard Highlighting CRM Ticketing Tool Operations. Use it as a tool for discussion and navigation on Dashboard, Highlighting CRM, Ticketing Tool Operations. This template is free to edit as deemed fit for your organization. Therefore download it now.
-
 Dashboard To Manage Inventory And Warehouse Operations Strategic Guide To Manage And Control Warehouse
This showcases dashboard that can help organization to manage warehouse operations and reduce unnecessary expenses. Its other key elements are inventory carrying cost, inventory days of supply and product stock details. Deliver an outstanding presentation on the topic using this Dashboard To Manage Inventory And Warehouse Operations Strategic Guide To Manage And Control Warehouse. Dispense information and present a thorough explanation of Inventory Carrying Cost, Inventory Days Of Supply using the slides given. This template can be altered and personalized to fit your needs. It is also available for immediate download. So grab it now.
-
 Dashboard To Track Warehouse Shipments And Operating Cost Strategic Guide To Manage And Control Warehouse
This slide showcases dashboard that can help organization to track operating cost incurred by organization in different warehousing activities. Its other key elements are perfect order rate, total shipments by country and on. Present the topic in a bit more detail with this Dashboard To Track Warehouse Shipments And Operating Cost Strategic Guide To Manage And Control Warehouse. Use it as a tool for discussion and navigation on Warehouse Operating Costs, Perfect Order Rate, Shipments By Country. This template is free to edit as deemed fit for your organization. Therefore download it now.
-
 Supply Chain Transformation Toolkit Warehouse Operations Success Metrics Dashboard
This slide illustrates success measurement dashboard for warehouse operations. It include KPIs namely operating cost, order rate, total shipment by country and on time shipment. Present the topic in a bit more detail with this Supply Chain Transformation Toolkit Warehouse Operations Success Metrics Dashboard. Use it as a tool for discussion and navigation on Warehouse, Operations, Success Metrics, Dashboard. This template is free to edit as deemed fit for your organization. Therefore download it now.
-
 Dashboard Depicting Business Operations Metrics
This slide exhibits business operations dashboard to track progress on monthly basis. It covers revenue by source, monthly sign ups, top performing support agents, monthly visits etc. Introducing our Dashboard Depicting Business Operations Metrics set of slides. The topics discussed in these slides are Dashboard Depicting, Business Operations Metrics. This is an immediately available PowerPoint presentation that can be conveniently customized. Download it and convince your audience.
-
 Dashboard Exhibiting Sales Operations Metrics
This slide represents the sales operations dashboard. It covers the number of sales, total revenue, profit, cost, sales revenue, cost breakdown, accumulated revenue, etc. Presenting our well structured Dashboard Exhibiting Sales Operations Metrics. The topics discussed in this slide are Accumulated Revenue, Cost Breakdown, Sales Through Source. This is an instantly available PowerPoint presentation that can be edited conveniently. Download it right away and captivate your audience.
-
 Dashboard For IT Operations Data Analysis
This slide exhibits IT operations dashboard. It covers number of cases, weekly open and close cases, open case status, case priority by divisions, time distribution of tickets. Introducing our Dashboard For IT Operations Data Analysis set of slides. The topics discussed in these slides are Case Priority, Distribution Of Tickets, Open Case Status. This is an immediately available PowerPoint presentation that can be conveniently customized. Download it and convince your audience.
-
 Dashboard Showcasing Project Management Operations
This slide exhibits project management operations dashboard. It covers task status, budget status, pending tasks, activity progress status etc to track project progress. Presenting our well structured Dashboard Showcasing Project Management Operations. The topics discussed in this slide are Feasibility Analysis, Mark Research, Funds Availability. This is an instantly available PowerPoint presentation that can be edited conveniently. Download it right away and captivate your audience.
-
 Fleet Management Operations Dashboard For Logistics Organization
This slide exhibits logistics operations KPIs dashboard for fleet management. It includes vehicle status, maintenance cost, fuel cost, cost breakdown, and insurance by vehicle type. Introducing our Fleet Management Operations Dashboard For Logistics Organization set of slides. The topics discussed in these slides are Vehicle Status, Cost Breakdown, Insurance Cost. This is an immediately available PowerPoint presentation that can be conveniently customized. Download it and convince your audience.
-
 Hospital Operations Dashboard To Monitor Performance
This slide represents a dashboard showcasing operations metrics to monitor medical institute performance. It includes the total number of patients, operational cost, available staff, etc. Presenting our well structured Hospital Operations Dashboard To Monitor Performance. The topics discussed in this slide are Hospital Operations Dashboard, Monitor Performance. This is an instantly available PowerPoint presentation that can be edited conveniently. Download it right away and captivate your audience.
-
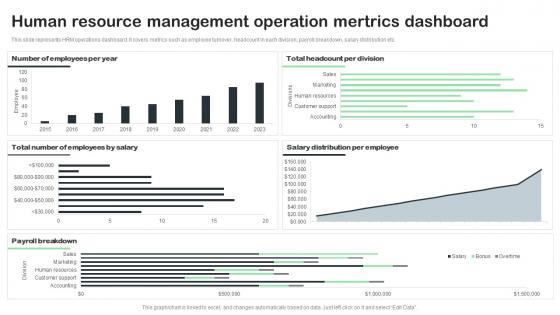 Human Resource Management Operation Mertrics Dashboard
This slide represents HRM operations dashboard. It covers metrics such as employee turnover, headcount in each division, payroll breakdown, salary distribution etc. Introducing our Human Resource Management Operation Mertrics Dashboard set of slides. The topics discussed in these slides are Human Resource, Management Operation, Mertrics Dashboard. This is an immediately available PowerPoint presentation that can be conveniently customized. Download it and convince your audience.
-
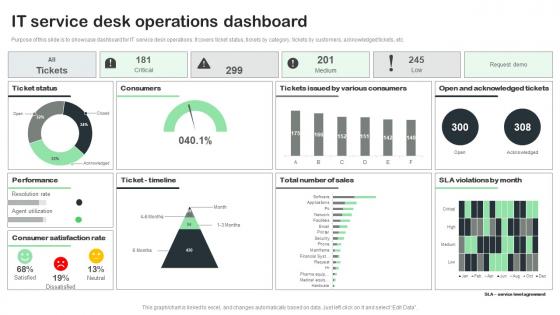 IT Service Desk Operations Dashboard
Purpose of this slide is to showcase dashboard for IT service desk operations. It covers ticket status, tickets by category, tickets by customers, acknowledged tickets, etc. Presenting our well structured IT Service Desk Operations Dashboard. The topics discussed in this slide are Ticket Status, Consumers, Performance, Consumer Satisfaction Rate. This is an instantly available PowerPoint presentation that can be edited conveniently. Download it right away and captivate your audience.
-
 Logistics Operations Dashboard With Fleet And Delivery Status
This slide illustrates logistics operations dashboard. It includes total revenue, cost, profit, fleet status, delivery status, deliveries by countries, profit by countries etc. Introducing our Logistics Operations Dashboard With Fleet And Delivery Status set of slides. The topics discussed in these slides are Fleet Status, Delivery Status, Deliveries By Country. This is an immediately available PowerPoint presentation that can be conveniently customized. Download it and convince your audience.
-
 Marketing Operations Dashboard Showcasing Campaign Performance
This slide exhibits operations dashboard for tracking campaign performance. It includes total expenditure, total impression, total clicks, total acquisitions, cost per acquisitions etc. Presenting our well structured Marketing Operations Dashboard Showcasing Campaign Performance. The topics discussed in this slide are Marketing Operations, Dashboard Showcasing, Campaign Performance. This is an instantly available PowerPoint presentation that can be edited conveniently. Download it right away and captivate your audience.
-
 Security Operations Dashboard For Detection And Response Effectiveness
This slide exhibits security operations dashboard. It include positive incidents, false positive incidents, false positive risk score, false positive security incident etc. Introducing our Security Operations Dashboard For Detection And Response Effectiveness set of slides. The topics discussed in these slides are Security Operations Dashboard, Detection, Response Effectiveness. This is an immediately available PowerPoint presentation that can be conveniently customized. Download it and convince your audience.
-
 Dashboard To Track Client Onboarding Operations Business Process Management System
This slide covers dashboard to track customer onboarding report of a company. The purpose of this slide is to provide employee wise report of signing up customers. It includes elements such as list of customers awaiting onboarding, paying customers along with package details and other important analytics. Deliver an outstanding presentation on the topic using this Dashboard To Track Client Onboarding Operations Business Process Management System. Dispense information and present a thorough explanation of Dashboard, Operations, Analytics using the slides given. This template can be altered and personalized to fit your needs. It is also available for immediate download. So grab it now.
-
 IT Operations Dashboard For Issues Management
The slide illustrates various KPIs to manage and track IT operations in business. Various elements included in the dashboard are month wise issue status, types of issues, average resolution time, overall status and resolved issues. Introducing our IT Operations Dashboard For Issues Management set of slides. The topics discussed in these slides are Overall Status, Resolved Issues, Resolution Time. This is an immediately available PowerPoint presentation that can be conveniently customized. Download it and convince your audience.
-
 Achieving Operational Excellence In Retail Dashboard For Measuring Customer Satisfaction
Mentioned slide illustrates customer satisfaction dashboard. It includes information about net promoter score, customer retention rate and customer effort score. Deliver an outstanding presentation on the topic using this Achieving Operational Excellence In Retail Dashboard For Measuring Customer Satisfaction. Dispense information and present a thorough explanation of Customer Retention, Customer Effort Score, Net Promoter Score using the slides given. This template can be altered and personalized to fit your needs. It is also available for immediate download. So grab it now.
-
 Achieving Operational Excellence In Retail KPI Dashboard For Retail Business Ppt Icon Images
This slide portrays key performance dashboard for measuring retail business performance. KPIs covered in the dashboards are average shopping time, shop visitors, average basket spend and customer retention. Deliver an outstanding presentation on the topic using this Achieving Operational Excellence In Retail KPI Dashboard For Retail Business Ppt Icon Images. Dispense information and present a thorough explanation of Customer Retention, Shopper Visitors, Shopping Time using the slides given. This template can be altered and personalized to fit your needs. It is also available for immediate download. So grab it now.
-
 Retail Store Performance Analysis Dashboard Achieving Operational Excellence In Retail
Mentioned slide displays a dashboard to assess retail store performance. Metrics included in the dashboard are net sales, average unit in retail, average basket size, sales volume by store and total visitors count. Deliver an outstanding presentation on the topic using this Retail Store Performance Analysis Dashboard Achieving Operational Excellence In Retail. Dispense information and present a thorough explanation of Retail Store, Performance, Analysis, Dashboard using the slides given. This template can be altered and personalized to fit your needs. It is also available for immediate download. So grab it now.
-
 AIOPS Dashboard To Monitor It Operations Implementing Artificial Intelligence In It Process
The following slide highlights the various key performance indicators of the AIOp, these can be problem quick review, cloud and infrastructure and applications health.Present the topic in a bit more detail with this AIOPS Dashboard To Monitor It Operations Implementing Artificial Intelligence In It Process. Use it as a tool for discussion and navigation on Cloud Infrastructure, Demo Environment, Smartscape. This template is free to edit as deemed fit for your organization. Therefore download it now.
-
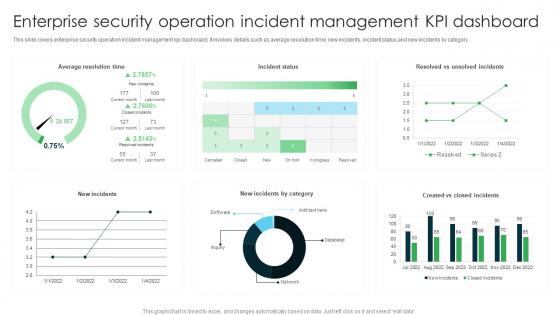 Enterprise Security Operation Incident Management Kpi Dashboard
This slide covers enterprise security operation incident management kpi dashboard. It involves details such as average resolution time, new incidents, incident status and new incidents by category. Presenting our well structured Enterprise Security Operation Incident Management Kpi Dashboard. The topics discussed in this slide are Average Resolution Time, Incident Status, Resolved Vs Unsolved Incidents. This is an instantly available PowerPoint presentation that can be edited conveniently. Download it right away and captivate your audience.
-
 KPI Dashboard For Enterprise Security Operations
This slide covers kpi dashboard for enterprise security operations. It involves details such as active alerts, active automated investigation, devices with major issues and report of daily devices. Introducing our KPI Dashboard For Enterprise Security Operations set of slides. The topics discussed in these slides are Security Health, Devices With Major Issues, Active Automated Investigations. This is an immediately available PowerPoint presentation that can be conveniently customized. Download it and convince your audience.
-
 Dashboard To Evaluate The Hospital Operations Healthcare Administration Overview Trend Statistics Areas
The following slide showcases dashboard which can be used by the healthcare professionals to measure the performance of operational department. The KPIs covered in the slide are total patients, operational cost, available staff per division etc. Deliver an outstanding presentation on the topic using this Dashboard To Evaluate The Hospital Operations Healthcare Administration Overview Trend Statistics Areas. Dispense information and present a thorough explanation of Operations, Performance, Evaluate using the slides given. This template can be altered and personalized to fit your needs. It is also available for immediate download. So grab it now.
-
 Operational Risk Management Key Metrics Dashboard Risk Management And Mitigation Strategy
This slide represents dashboard representing the key metrics of operational risk management. It includes KPIs such as operational risk by rating, by month, operational risk list etc. Present the topic in a bit more detail with this Operational Risk Management Key Metrics Dashboard Risk Management And Mitigation Strategy. Use it as a tool for discussion and navigation on Metrics Dashboard, Operational Risk, Total Risks. This template is free to edit as deemed fit for your organization. Therefore download it now.
-
 Dashboard Highlighting CRM Ticketing Tool Operations Deploying ITSM Ticketing Tools
This slide illustrates dashboard showcasing customer relationship management ticketing tool operations. It provides information about satisfaction, new tickets, chats, calls, invoicing, tech support, sales, engineers, replies, etc. Deliver an outstanding presentation on the topic using this Dashboard Highlighting CRM Ticketing Tool Operations Deploying ITSM Ticketing Tools. Dispense information and present a thorough explanation of Backlog Department, Tickets Closed, Pending Agent using the slides given. This template can be altered and personalized to fit your needs. It is also available for immediate download. So grab it now.
-
 AIOps Dashboard To Monitor IT Operations Artificial Intelligence In IT Operations
The following slide highlights the various key performance indicators of the AIOp, these can be problem quick review, cloud and infrastructure and applications health. Present the topic in a bit more detail with this AIOps Dashboard To Monitor IT Operations Artificial Intelligence In IT Operations. Use it as a tool for discussion and navigation on Cloud And Infrastructure, Quick Overview, Application Health. This template is free to edit as deemed fit for your organization. Therefore download it now.
-
 Customer Service Dashboard Through Ai Artificial Intelligence In IT Operations
The following slide highlights the customer service dashboard that shows the use of AI in customer satisfaction. Deliver an outstanding presentation on the topic using this Customer Service Dashboard Through Ai Artificial Intelligence In IT Operations. Dispense information and present a thorough explanation of Customer Service, Dashboard, Through AI using the slides given. This template can be altered and personalized to fit your needs. It is also available for immediate download. So grab it now.
-
 CRM Dashboard With Industry Operations Data Statistics
This slide illustrates graphical representation of statistical data of sales operation. It includes sales pipeline, closed operations, open operations, operations by closing date etc. Presenting our well structured CRM Dashboard With Industry Operations Data Statistics. The topics discussed in this slide are Sales Pipeline, Operations Closing Date. This is an instantly available PowerPoint presentation that can be edited conveniently. Download it right away and captivate your audience.
-
 Company Operations Budget Portfolio Dashboard
The following slide shows business operations budget summary dashboard. It provides information about expenses, difference, transportation, insurance, refreshment, etc. Presenting our well structured Company Operations Budget Portfolio Dashboard. The topics discussed in this slide are Transportation, Refreshment, Insurance. This is an instantly available PowerPoint presentation that can be edited conveniently. Download it right away and captivate your audience.
-
 AIOps Industry Report AIOps Dashboard To Monitor IT Operations Ppt Microsoft
The following slide highlights the various key performance indicators of the AIOp, these can be problem quick review, cloud and infrastructure and applications health. Present the topic in a bit more detail with this AIOps Industry Report AIOps Dashboard To Monitor IT Operations Ppt Microsoft. Use it as a tool for discussion and navigation on Quick Overview, Cloud And Infrastructure, Application Health. This template is free to edit as deemed fit for your organization. Therefore download it now.
-
 AIOps Dashboard To Monitor It Operations Operational Strategy For Machine Learning
The following slide highlights the various key performance indicators of the AIOps, these can be problem quick review, cloud and infrastructure and applications health. Present the topic in a bit more detail with this AIOps Dashboard To Monitor It Operations Operational Strategy For Machine Learning. Use it as a tool for discussion and navigation on Quick Overview, Application Health, User Experience. This template is free to edit as deemed fit for your organization. Therefore download it now.
-
 Customer Service Dashboard Through Ai Operational Strategy For Machine Learning
The following slide highlights the customer service dashboard that shows the use of AI in customer satisfaction. Deliver an outstanding presentation on the topic using this Customer Service Dashboard Through Ai Operational Strategy For Machine Learning. Dispense information and present a thorough explanation of Customer Service, Dashboard Through, Case Priority using the slides given. This template can be altered and personalized to fit your needs. It is also available for immediate download. So grab it now.
-
 AIOps Dashboard To Monitor Industry Report AI Implementation In IT Operations
The following slide highlights the various key performance indicators of the AIOp, these can be problem quick review, cloud and infrastructure and applications health. Present the topic in a bit more detail with this AIOps Dashboard To Monitor Industry Report AI Implementation In IT Operations. Use it as a tool for discussion and navigation on Quick Overview, Application Health, User Experience. This template is free to edit as deemed fit for your organization. Therefore download it now.


